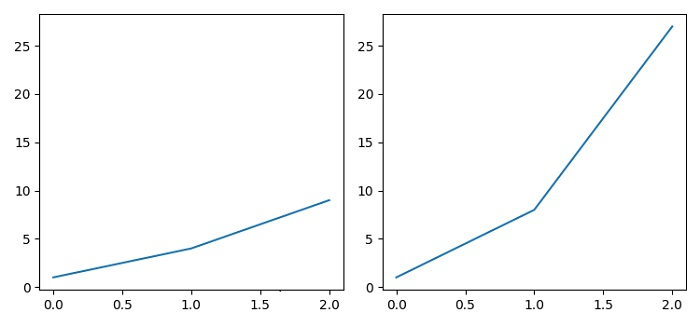
在Matplotlib中共享坐标轴时显示刻度标签
要在共享坐标轴时显示刻度标签,只需使用 subplot() 方法,带上 sharey 参数即可。默认情况下, y 刻度标签是可见的。
步骤
- 设置图形大小以及子图之间和周围的填充。
-
使用 subplot() 方法向当前图形添加一个子图,其中 nrows=1, ncols=2 ,axis ax1 的 index=1 。
-
在轴1上绘制一条线。
-
使用 subplot() 方法向当前图形添加一个子图,其中 nrows=1, ncols=2 ,axis ax2 的 index=2 。
-
在轴2上绘制一条线。
-
使用 show() 方法显示图形。
示例
from matplotlib import pyplot as plt
plt.rcParams["figure.figsize"] = [7.50, 3.50]
plt.rcParams["figure.autolayout"] = True
ax1 = plt.subplot(1, 2, 1)
ax1.plot([1, 4, 9])
ax2 = plt.subplot(1, 2, 2, sharey=ax1)
ax2.plot([1, 8, 27])
plt.show()
输出结果

 极客教程
极客教程