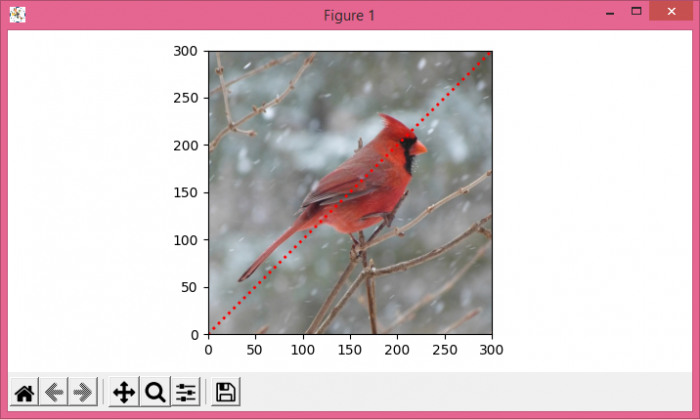
在 Python 中的 Matplotlib 图像背景上绘制图表
要在图像背景上绘制图表,可以按照以下步骤进行操作−
- 从文件中读取图像到一个数组中。
- 创建一个 figure(fig),并添加一个范围为[0, 300, 0, 300]的子图集(ax)。
- 创建一个范围为(300)的数组 x。
使用 plot() 方法绘制 x,设置 linestyle=dotted , linewidth=2 和 color=red 。 - 要显示图像,请使用 show() 方法。
示例
import numpy as np
from matplotlib import pyplot as plt
plt.rcParams["figure.figsize"] = [7.00, 3.50]
plt.rcParams["figure.autolayout"] = True
im = plt.imread("bird.jpg")
fig, ax = plt.subplots()
im = ax.imshow(im, extent=[0, 300, 0, 300])
x = np.array(range(300))
ax.plot(x, x, ls='dotted', linewidth=2, color='red')
plt.show()
输出

 极客教程
极客教程