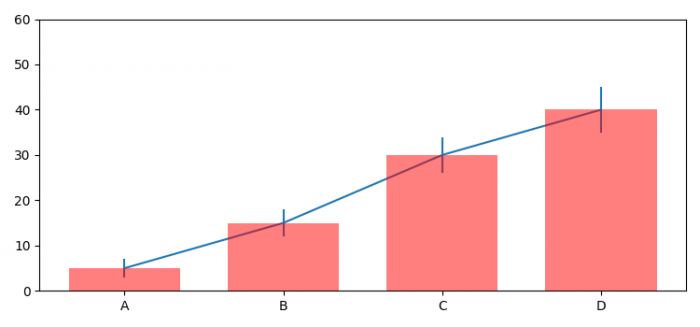
在条形图(Matplotlib)中指示统计学上的显著差异
为了在条形图中指示统计学上的显著差异,我们可以采取以下步骤:
- 设置图形大小并调整子图之间和周围的填充。
- 创建 means , std , index , width 和 labels 数据点。
- 使用 subplots() 方法创建一个图和一组子图。
- 使用 bar() 方法绘制条形图。
- 用连线和/或带有错误条的标记绘制Y与X的图像。缩放Y轴。
- 获取或设置X轴的当前刻度位置和标签。
- 使用 show() 方法显示图形。
例子
import numpy as np
import matplotlib.pyplot as plt
plt.rcParams["figure.figsize"] = [7.50, 3.50]
plt.rcParams["figure.autolayout"] = True

means = (5, 15, 30, 40)
std = (2, 3, 4, 5)
index = np.arange(4)
width = 0.7
labels = ('A', 'B', 'C', 'D')

fig, ax = plt.subplots()
ax.p1 = plt.bar(index, means, width=width, color="red",
               linewidth=2, zorder=5, alpha=0.5)
ax.errs = plt.errorbar(index, means, yerr=std)

plt.ylim(ymax=60)
plt.xticks(index, labels, color='k')

plt.show()
输出

 极客教程
极客教程