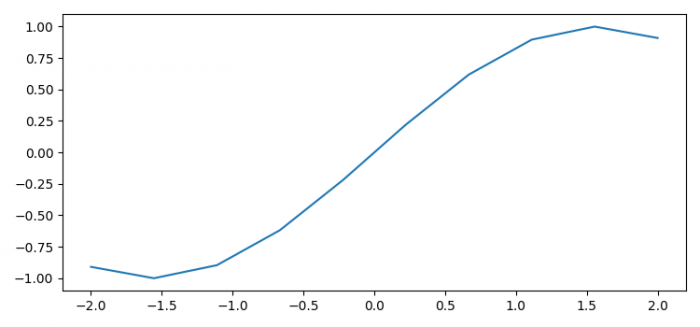
如何在 Matplotlib 中关闭上部 / 右侧轴刻度线?
为了在 Matplotlib 中关闭上部或右侧轴刻度线,我们需要创建一个自定义的字典 visible_ticks 并关闭标志。
步骤
- 设置图像大小并调整子图之间和周围的填充。
- 使用 numpy 创建 x 和 y 数据点。
- 使用 plot() 方法绘制 x 和 y 数据点。
- 创建一个字典以关闭轴刻度线。
- 使用 show() 方法显示图像。
示例
import numpy as np
import matplotlib.pyplot as plt

plt.rcParams["figure.figsize"] = [7.50, 3.50]
plt.rcParams["figure.autolayout"] = True
x = np.linspace(-2, 2, 10)
y = np.sin(x)
plt.plot(x, y)
visible_ticks = {
   "top": False,
   "right": False
}
plt.tick_params(axis="x", which="both", **visible_ticks)
plt.show()
输出

 极客教程
极客教程