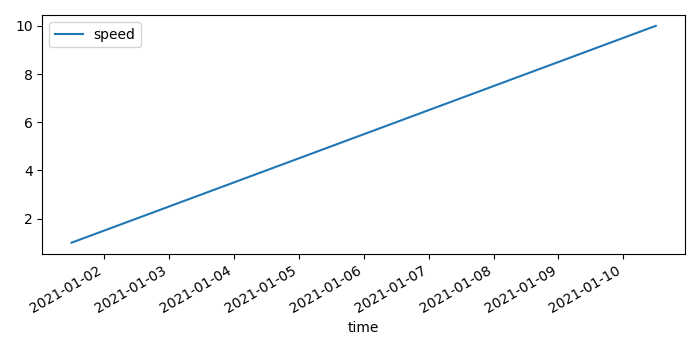
如何在Matplotlib中将 Pandas dataframe 中的时间作为索引进行绘图?
要在 matplotlib 中将 Pandas dataframe 中的时间作为索引进行绘图,可以执行以下步骤。
步骤
- 设置图形大小并调整子图之间和周围的填充。
-
创建一个带有两列的 Pandas dataframe, 时间 和 速度 。
-
使用现有列设置 DataFrame 索引。
-
使用 Show() 方法显示图形。
示例
from matplotlib import pyplot as plt
import pandas as pd
import numpy as np

# 设置图形大小
plt.rcParams["figure.figsize"] = [7.00, 3.50]
plt.rcParams["figure.autolayout"] = True

# Pandas dataframe
df = pd.DataFrame(dict(time=list(pd.date_range("2021-01-01 12:00:00", periods=10)), speed=np.linspace(1, 10, 10)))

# 设置 dataframe 索引
df.set_index('time').plot()

# 显示图形
plt.show()
输出
它将产生以下输出:

 极客教程
极客教程