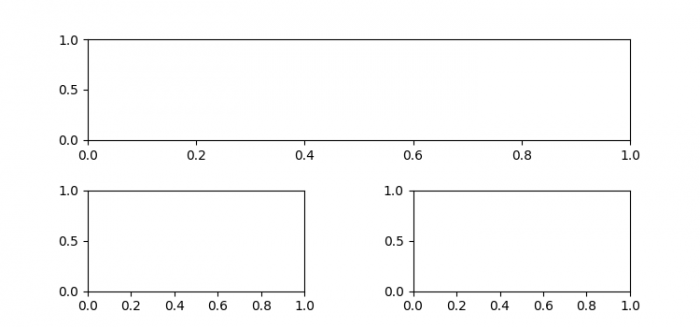
如何在使用 subplot2grid 的 Matplotlib 中增加子图之间的间距?
要在使用 subplot2grid 的 Matplotlib 中增加子图之间的间距,可以按照以下步骤进行−
- 设置图形大小并调整子图之间和周围的填充。
-
添加一个网格布局来放置图中的子图。
-
更新网格的子图参数。
-
添加当前图的一个子图。
-
为了显示图形,请使用 show() 方法。
示例
from matplotlib import pyplot as plt

plt.rcParams["figure.figsize"] = [7.50, 3.50]
plt.rcParams["figure.autolayout"] = True

ax = plt.GridSpec(2, 2)
ax.update(wspace=0.5, hspace=0.5)

ax1 = plt.subplot(ax[0, :])
ax2 = plt.subplot(ax[1, 0])
ax3 = plt.subplot(ax[1, 1])

plt.show()
输出

 极客教程
极客教程