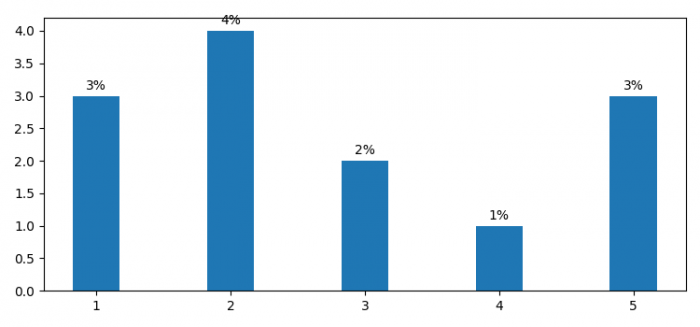
如何在Matplotlib中在条形图上方显示百分比?
要在Matplotlib中的条形图上方显示百分比,可以按照以下步骤进行-
- 设置图像大小并调整子图之间和周围的间距。
- 创建x和y数据点;初始化一个变量 width 。
- 使用 subplots() 方法创建一个图和一组子图。
- 添加具有x和y数据点的条形。
- 迭代条形路径;使用 text() 方法在条形上方放置文本。
- 要显示图形,请使用 show() 方法。
例子
from matplotlib import pyplot as plt
import numpy as np

plt.rcParams["figure.figsize"] = [7.50, 3.50]
plt.rcParams["figure.autolayout"] = True

x = [1, 2, 3, 4, 5]
y = [3, 4, 2, 1, 3]

width = 0.35
fig, ax = plt.subplots()

pps = ax.bar(x, y, width, align='center')

for p in pps:
   height = p.get_height()
   ax.text(x=p.get_x() + p.get_width() / 2, y=height+.10,
      s="{}%".format(height),
      ha='center')

plt.show()
输出

 极客教程
极客教程