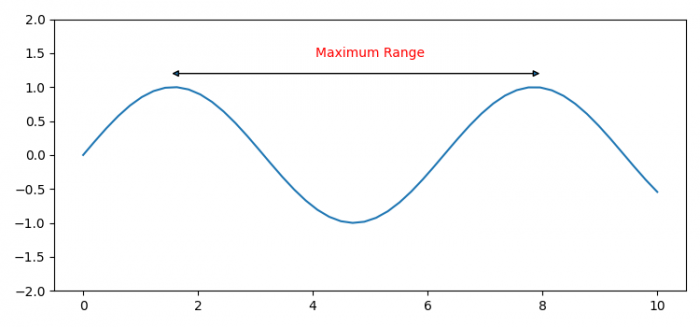
如何在Matplotlib中注释X轴的一段范围?
要在Matplotlib中注释X轴的一段范围,可以按照以下步骤进行 –
- 设置图形大小,并调整子图之间和周围的填充。
- 使用numpy创建xx和yy数据点。
- 创建一个图和一组子图。
- 使用 plot() 方法绘制xx和yy数据点。
- 设置轴的y范围。
- 使用注释方法放置箭头头和范围标签名称。
- 使用 show() 方法显示图形。
示例
import matplotlib.pyplot as plt
import numpy as np

plt.rcParams["figure.figsize"] = [7.50, 3.50]
plt.rcParams["figure.autolayout"] = True

xx = np.linspace(0, 10)
yy = np.sin(xx)

fig, ax = plt.subplots(1, 1)

ax.plot(xx, yy)
ax.set_ylim([-2, 2])

ax.annotate('', xy=(5,2), xytext=(8,2),
            xycoords='data', textcoords='data',
            arrowprops={'arrowstyle': '<|-|>'}, color='yellow')

ax.annotate('Maximum Range', xy=(5,5), ha='center', va='center', color='red')

plt.show()
输出

 极客教程
极客教程