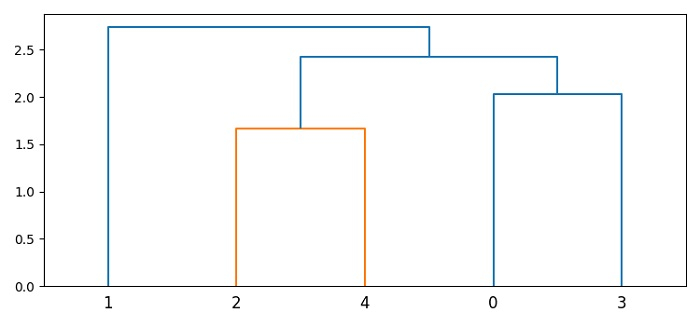
如何在Matplotlib中调整树状图的分支长度?
要在Matplotlib中调整树状图的分支长度,我们可以采取以下步骤 –
- 设置图形大小并调整子图之间和周围的填充。
-
从多元正态分布中随机抽取样本(a和b)。
-
使用concatenate()方法沿现有轴连接数组序列。
-
执行分层/凝聚聚类。
-
使用figure()方法创建一个新图形或激活一个现有图形。
-
作为subplot布置的一部分,将轴添加到图形上。
-
使用dendrogram()方法将分层聚类绘制成树状图。
-
使用show()方法显示图形。
示例
from matplotlib import pyplot as plt
from scipy.cluster.hierarchy import dendrogram, linkage
import numpy as np
plt.rcParams["figure.figsize"] = [7.50, 3.50]
plt.rcParams["figure.autolayout"] = True
a = np.random.multivariate_normal([0, 10], [[3, 1], [1, 4]], size=[2, ])
b = np.random.multivariate_normal([0, 10], [[3, 1], [1, 4]], size=[3, ])
X = np.concatenate((a, b), )
Z = linkage(X)
fig = plt.figure()
ax = fig.add_subplot(1, 1, 1)
dendrogram(Z, ax=ax)
plt.show()
输出

 极客教程
极客教程