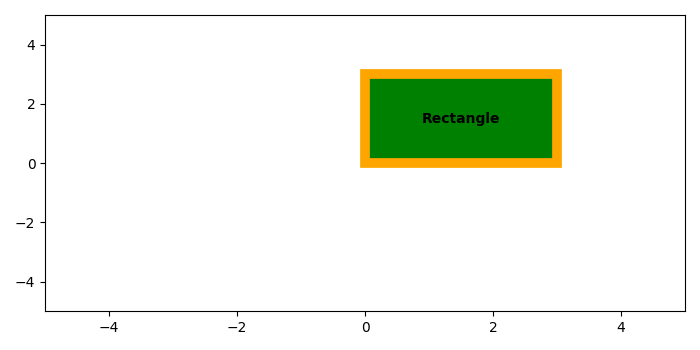
如何在Matplotlib中的矩形中添加文本?
要在Matplotlib的矩形中添加文本,我们可以在annotate方法中添加一个标签,放在矩形中心的位置。
步骤
- 创建一个新的图形或使用现有的图形。 使用 figure() 方法。
-
在当前轴上添加一个子图。
-
要在图中添加一个矩形,请使用 Rectangle() 类来获取矩形对象。
-
在图中添加一个矩形补丁。
-
要在矩形中添加文本标签,我们可以获取矩形的中心值,即cx和cy。
-
使用 annotate() 方法在矩形上放置文本。
-
限制x和y轴以获得可见的矩形。
-
使用 show() 方法来显示图形。
示例
from matplotlib import pyplot as plt, patches
plt.rcParams["figure.figsize"] = [7.00, 3.50]
plt.rcParams["figure.autolayout"] = True
fig = plt.figure()
ax = fig.add_subplot(111)
rectangle = patches.Rectangle((0, 0), 3, 3, edgecolor='orange',
facecolor="green", linewidth=7)
ax.add_patch(rectangle)
rx, ry = rectangle.get_xy()
cx = rx + rectangle.get_width()/2.0
cy = ry + rectangle.get_height()/2.0
ax.annotate("Rectangle", (cx, cy), color='black', weight='bold', fontsize=10, ha='center', va='center')
plt.xlim([-5, 5])
plt.ylim([-5, 5])
plt.show()
输出

 极客教程
极客教程