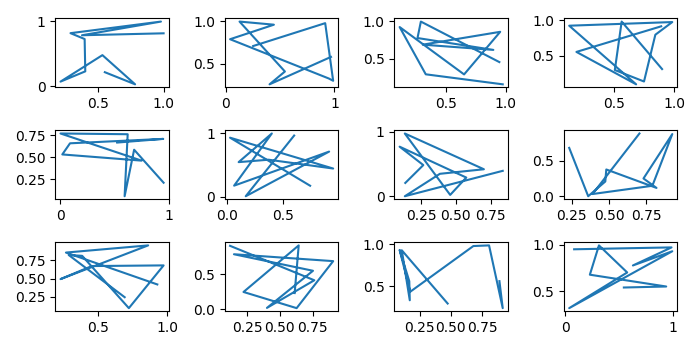
如何将matplotlib对象通过函数传递; 作为Axis,Axes或Figure?
要将matplotlib对象通过函数传递; 作为Axis,Axes或Figure,我们可以采取以下步骤−
- 设置绘图尺寸和子图之间及周围的间距。
- 在 plot() 方法中,在轴ax上绘制x和y数据点。
- 在 profile() 方法中创建一个图形和一组子图。迭代轴并传入 plot() 方法以绘制图形。
- 用3行4列调用 profile() 方法。
- 要显示图形,请使用 show() 方法。
示例
import numpy as np
from matplotlib import pyplot as plt

plt.rcParams [“figure.figsize“] = [7.00, 3.50]
plt.rcParams [“figure.autolayout“] = True

def plot(ax, x, y):
   ax.plot(x, y)

def profile(rows,cols):
   fig,axes = plt.subplots(rows,cols)
   for ax in axes:
      for a in ax:
          plot(a,np.random.rand(10),np.random.rand(10))

profile(3, 4)
plt.show()
输出
它将产生以下输出

 极客教程
极客教程