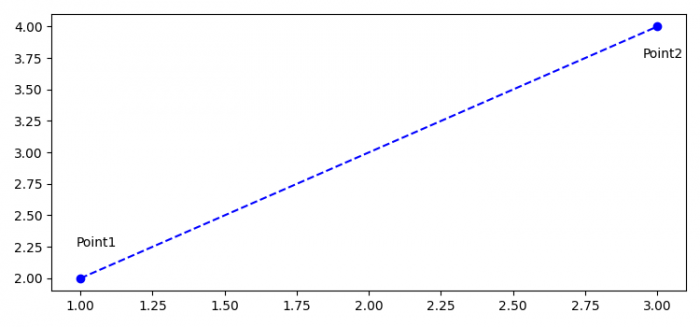
如何在Matplotlib中创建两个点之间的线段?
要在matplotlib中创建两个点之间的线段,可以按照以下步骤进行操作
- 设置图形大小并调整子图之间和周围的填充。
- 为了创建两个点,请创建两个列表。
- 从 point1 和 point2 中提取 x 和 y 值。
- 使用 plot() 方法绘制 x 和 y 值的线段。
- 为两个点放置文本。
- 使用 show() 方法来显示图形。
实例
import matplotlib.pyplot as plt
plt.rcParams["figure.figsize"] = [7.50, 3.50]
plt.rcParams["figure.autolayout"] = True
point1 = [1, 2]
point2 = [3, 4]
x_values = [point1[0], point2[0]]
y_values = [point1[1], point2[1]]
plt.plot(x_values, y_values, 'bo', linestyle="--")
plt.text(point1[0]-0.015, point1[1]+0.25, "Point1")
plt.text(point2[0]-0.050, point2[1]-0.25, "Point2")
plt.show()
输出

 极客教程
极客教程