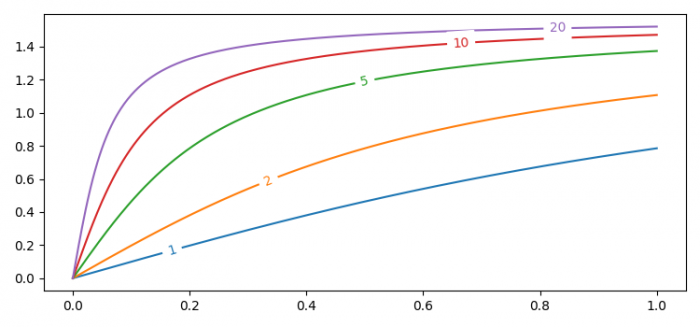
如何在Matplotlib中绘制内联线标签?
要在Matplotlib中绘制内联标签,我们可以使用 labelLines() 方法。 −
步骤
- 设置图形大小并调整子图之间和周围的填充。
- 使用numpy创建随机数据点x和数据点列表 A。
- 对 A 列表进行迭代,并绘制 X 和(迭代项)的图例。
- 为绘制的线条标记它们各自的图例。
- 使用 show() 方法显示图形。
例子
import numpy as np
from matplotlib import pyplot as plt
from labellines import labelLines

plt.rcParams["figure.figsize"] = [7.50,3.50]
plt.rcParams["figure.autolayout"] = True

X = np.linspace(0, 1, 500)
A = [1, 2, 5, 10, 20]

for a in A:
   plt.plot(X, np.arctan(a*X), label=str(a))

labelLines(plt.gca().get_lines(), zorder=2.5)

plt.show()
输出

 极客教程
极客教程