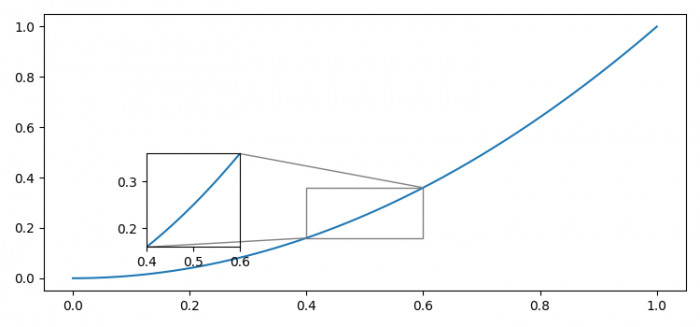
Matplotlib中缩略图的不同X轴和Y轴刻度
为了在Matplotlib中显示缩略图不同的X轴和Y轴刻度,我们可以使用 inset_axes() 方法。
步骤
- 设置图形大小并调整子图之间及其周围的填充量。
- 使用numpy创建 x 和 y 数据点。
- 将子图添加到当前图形中。
- 使用 plot() 方法绘制 x 和 y 数据点。
- 创建给定宽度和高度的缩略图轴。
- 设置不同的 x 和 y 刻度。
- 绘制一个框以标记由缩略图轴表示的区域的位置。
- 要显示图形,请使用 show() 方法。
示例
import matplotlib.pyplot as plt
import numpy as np
from mpl_toolkits.axes_grid1.inset_locator import mark_inset, inset_axes

plt.rcParams["figure.figsize"] = [7.50, 3.50]
plt.rcParams["figure.autolayout"] = True

x = np.linspace(0, 1, 100)
y = x ** 2

ax = plt.subplot(1, 1, 1)
ax.plot(x, y)

axins = inset_axes(ax, 1, 1, loc=2, bbox_to_anchor=(0.2, 0.55),
                  bbox_transform=ax.figure.transFigure)
axins.plot(x, y)

x1, x2 = .4, .6
y1, y2 = x1 ** 2, x2 ** 2

axins.set_xlim(x1, x2)
axins.set_ylim(y1, y2)

mark_inset(ax, axins, loc1=1, loc2=3, fc="none", ec="0.5")

plt.show()
输出

 极客教程
极客教程