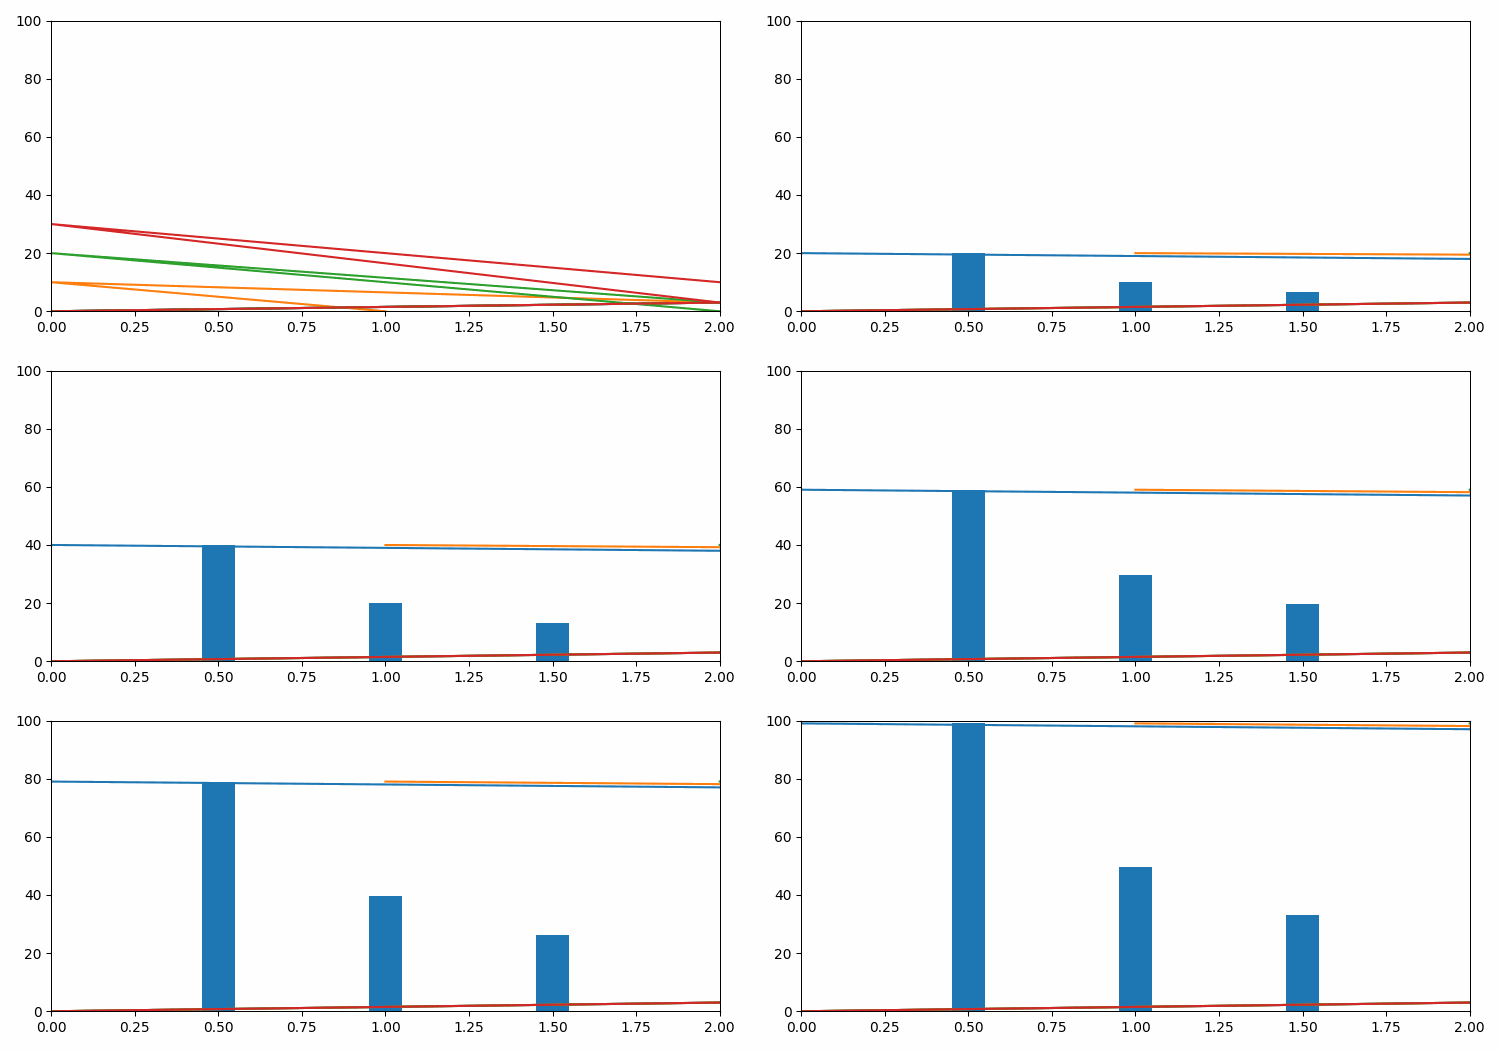
用Matplotlib在for循环中定义多个要进行动画化的绘图
为了使用Matplotlib在for循环中定义多个要进行动画化的绘图,可以执行以下步骤:-
- 设置图形大小并调整子图之间和周围的填充。
- 使用figure方法创建一个新图或激活现有图。
- 将一个轴添加到当前图形并将其设置为当前轴。
- 使用numpy初始化两个变量N和x。
- 获取直线和条形图补丁的列表。
- 在for循环中对线条和矩形(条形图补丁)进行动画处理。
- 通过反复调用功能函数func来制作动画。
- 使用show()方法显示图形。
示例
从matplotlib中导入pyplot和animation
import numpy as np

plt.rcParams["figure.figsize"] = [7.50, 3.50]
plt.rcParams["figure.autolayout"] = True

fig = plt.figure()
ax = plt.axes(xlim=(0, 2), ylim=(0, 100))
N = 4
x = np.linspace(-5, 5, 100)
lines = [plt.plot(x, np.sin(x))[0] for _ in range(N)]
rectangles = plt.bar([0.5, 1, 1.5], [50, 40, 90], width=0.1)
patches = lines + list(rectangles)

def animate(i):
   for j, line in enumerate(lines):
      line.set_data([0, 2, i, j], [0, 3, 10 * j, i])
   for j, rectangle in enumerate(rectangles):
      rectangle.set_height(i / (j + 1))
return patches

anim = animation.FuncAnimation(fig, animate,
                              frames=100, interval=20, blit=True)

plt.show()
输出

 极客教程
极客教程