Matplotlib散点图中使用误差条:全面指南与实例
参考:Use error bars in a Matplotlib scatter plot
Matplotlib是Python中最流行的数据可视化库之一,它提供了丰富的绘图功能,包括散点图和误差条的绘制。在数据分析和科学研究中,准确表示数据的不确定性至关重要,而误差条正是实现这一目的的有效工具。本文将深入探讨如何在Matplotlib散点图中使用误差条,通过详细的解释和实例代码,帮助读者掌握这一重要技能。
1. 误差条的基本概念
误差条(Error bars)是用于表示数据点不确定性或变异性的图形元素。在散点图中,误差条通常表现为从数据点延伸出的线段,线段的长度代表了误差的大小。误差可能来自测量误差、统计误差或其他类型的不确定性。
使用误差条的主要目的包括:
– 显示数据的精确度
– 表示测量的标准偏差
– 展示数据的置信区间
– 表示数据的范围或分布
让我们从一个简单的例子开始,展示如何在散点图中添加基本的误差条:
import matplotlib.pyplot as plt
import numpy as np

# 生成示例数据
x = np.linspace(0, 10, 10)
y = np.sin(x) + np.random.random(10)
yerr = np.random.random(10) * 0.2

# 创建散点图并添加误差条
plt.figure(figsize=(10, 6))
plt.errorbar(x, y, yerr=yerr, fmt='o', capsize=5, label='Data with error bars')
plt.xlabel('X-axis (how2matplotlib.com)')
plt.ylabel('Y-axis (how2matplotlib.com)')
plt.title('Basic Scatter Plot with Error Bars')
plt.legend()
plt.grid(True)
plt.show()
Output:
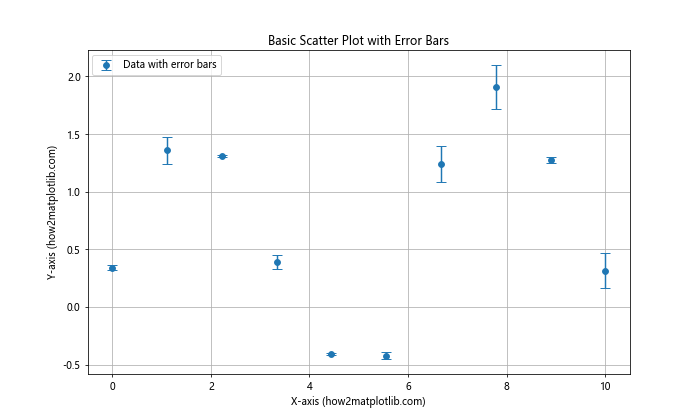
在这个例子中,我们使用plt.errorbar()函数创建了一个带有误差条的散点图。x和y参数定义了数据点的位置,yerr参数指定了y方向的误差值。fmt='o'参数设置数据点的样式为圆点,capsize=5设置误差条末端的横线长度。
2. 自定义误差条的外观
Matplotlib提供了多种方式来自定义误差条的外观,使其更好地适应您的可视化需求。以下是一些常用的自定义选项:
2.1 调整误差条的颜色和线型
import matplotlib.pyplot as plt
import numpy as np

x = np.linspace(0, 10, 10)
y = np.exp(x/10) + np.random.random(10)
yerr = y * 0.1

plt.figure(figsize=(10, 6))
plt.errorbar(x, y, yerr=yerr, fmt='s', capsize=5,
             ecolor='red', elinewidth=2, capthick=2,
             label='Custom error bars')
plt.xlabel('X-axis (how2matplotlib.com)')
plt.ylabel('Y-axis (how2matplotlib.com)')
plt.title('Scatter Plot with Customized Error Bars')
plt.legend()
plt.grid(True)
plt.show()
Output:
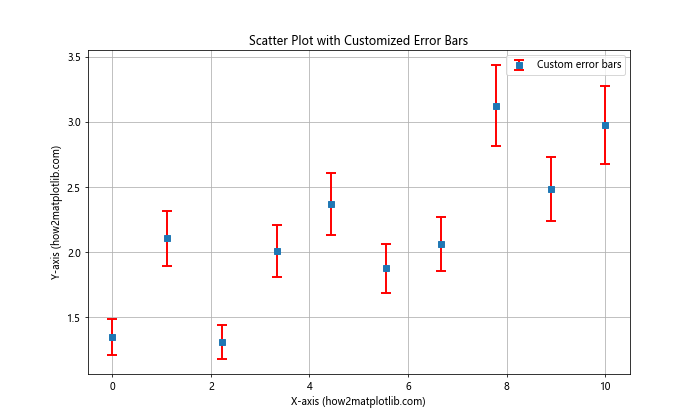
在这个例子中,我们使用了以下参数来自定义误差条的外观:
– ecolor='red':设置误差条的颜色为红色
– elinewidth=2:设置误差条的线宽
– capthick=2:设置误差条末端横线的粗细
2.2 使用不同的标记样式
import matplotlib.pyplot as plt
import numpy as np

x = np.linspace(0, 10, 5)
y1 = np.sin(x) + np.random.random(5)
y2 = np.cos(x) + np.random.random(5)
yerr1 = np.random.random(5) * 0.2
yerr2 = np.random.random(5) * 0.1

plt.figure(figsize=(10, 6))
plt.errorbar(x, y1, yerr=yerr1, fmt='o', capsize=5, label='Sin data')
plt.errorbar(x, y2, yerr=yerr2, fmt='^', capsize=5, label='Cos data')
plt.xlabel('X-axis (how2matplotlib.com)')
plt.ylabel('Y-axis (how2matplotlib.com)')
plt.title('Scatter Plot with Different Marker Styles')
plt.legend()
plt.grid(True)
plt.show()
Output:
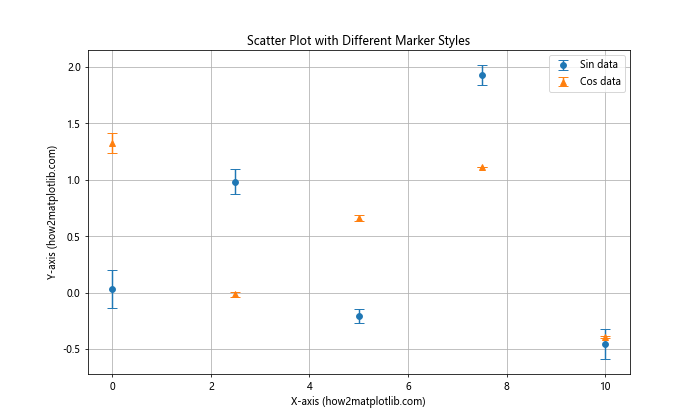
这个例子展示了如何在同一图表中使用不同的标记样式('o'和'^')来区分不同的数据系列。
3. 添加水平误差条
除了垂直误差条,有时我们也需要表示x轴方向的误差。Matplotlib允许我们同时添加水平和垂直误差条:
import matplotlib.pyplot as plt
import numpy as np

x = np.linspace(0, 10, 5)
y = np.exp(x/5) + np.random.random(5)
xerr = np.random.random(5) * 0.5
yerr = y * 0.1

plt.figure(figsize=(10, 6))
plt.errorbar(x, y, xerr=xerr, yerr=yerr, fmt='o', capsize=5,
             label='Data with X and Y errors')
plt.xlabel('X-axis (how2matplotlib.com)')
plt.ylabel('Y-axis (how2matplotlib.com)')
plt.title('Scatter Plot with Horizontal and Vertical Error Bars')
plt.legend()
plt.grid(True)
plt.show()
Output:
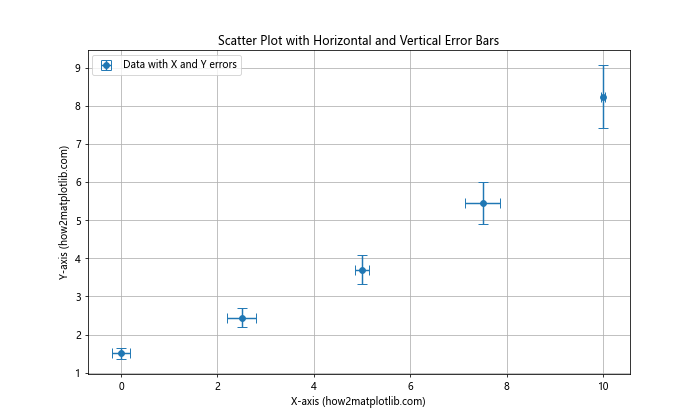
在这个例子中,我们通过添加xerr参数来指定x轴方向的误差。这对于表示两个变量都有不确定性的情况非常有用。
4. 非对称误差条
在某些情况下,数据点的上下误差可能不相等。Matplotlib允许我们为每个数据点指定不同的上下误差值:
import matplotlib.pyplot as plt
import numpy as np

x = np.linspace(0, 10, 5)
y = np.sin(x) + np.random.random(5)
yerr_lower = np.random.random(5) * 0.1
yerr_upper = np.random.random(5) * 0.2

plt.figure(figsize=(10, 6))
plt.errorbar(x, y, yerr=[yerr_lower, yerr_upper], fmt='o', capsize=5,
             label='Data with asymmetric errors')
plt.xlabel('X-axis (how2matplotlib.com)')
plt.ylabel('Y-axis (how2matplotlib.com)')
plt.title('Scatter Plot with Asymmetric Error Bars')
plt.legend()
plt.grid(True)
plt.show()
Output:
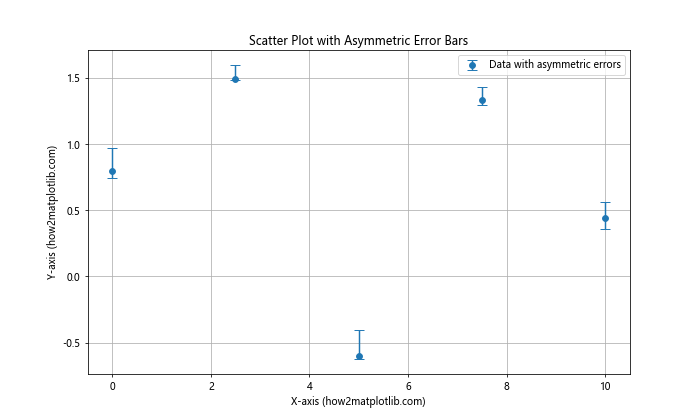
在这个例子中,我们将yerr参数设置为一个包含两个数组的列表:第一个数组表示下误差,第二个数组表示上误差。
5. 使用误差条表示置信区间
误差条不仅可以用来表示标准误差,还可以用来表示置信区间。以下是一个使用95%置信区间的例子:
import matplotlib.pyplot as plt
import numpy as np
from scipy import stats

x = np.linspace(0, 10, 20)
y = 2 * x + 1 + np.random.normal(0, 2, 20)

# 计算线性回归
slope, intercept, r_value, p_value, std_err = stats.linregress(x, y)
line = slope * x + intercept

# 计算95%置信区间
confidence = 0.95
n = len(x)
std_error = np.sqrt(np.sum((y - line)**2) / (n-2)) / np.sqrt(np.sum((x - np.mean(x))**2))
t_value = stats.t.ppf((1 + confidence) / 2, n - 2)
ci = t_value * std_error * np.sqrt(1 + 1/n + (x - np.mean(x))**2 / np.sum((x - np.mean(x))**2))

plt.figure(figsize=(10, 6))
plt.scatter(x, y, label='Data')
plt.plot(x, line, 'r', label='Regression line')
plt.fill_between(x, line - ci, line + ci, alpha=0.2, label='95% CI')
plt.errorbar(x, y, yerr=ci, fmt='none', capsize=5, color='gray', alpha=0.5)
plt.xlabel('X-axis (how2matplotlib.com)')
plt.ylabel('Y-axis (how2matplotlib.com)')
plt.title('Scatter Plot with Regression Line and Confidence Interval')
plt.legend()
plt.grid(True)
plt.show()
Output:
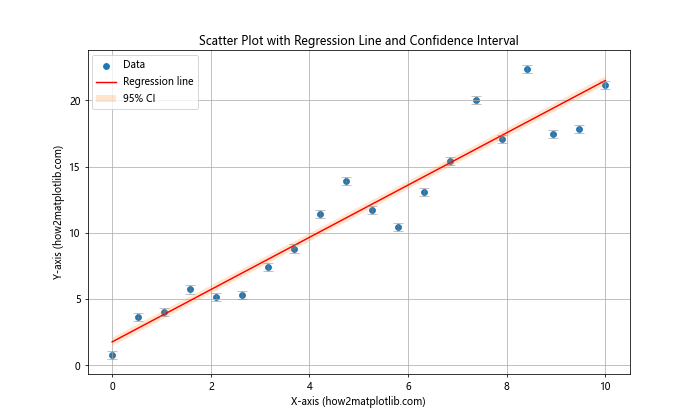
这个例子展示了如何结合使用散点图、回归线、置信区间和误差条。我们首先计算线性回归,然后计算95%置信区间。最后,我们使用plt.fill_between()函数绘制置信区间的阴影区域,并使用plt.errorbar()添加误差条。
6. 在柱状图中添加误差条
虽然本文主要关注散点图,但值得一提的是,误差条也常用于柱状图中。以下是一个在柱状图中添加误差条的例子:
import matplotlib.pyplot as plt
import numpy as np

categories = ['A', 'B', 'C', 'D']
values = np.random.randint(10, 30, len(categories))
errors = np.random.randint(1, 5, len(categories))

plt.figure(figsize=(10, 6))
plt.bar(categories, values, yerr=errors, capsize=5,
        label='Data with error bars')
plt.xlabel('Categories (how2matplotlib.com)')
plt.ylabel('Values (how2matplotlib.com)')
plt.title('Bar Plot with Error Bars')
plt.legend()
plt.grid(True, axis='y')
plt.show()
Output:
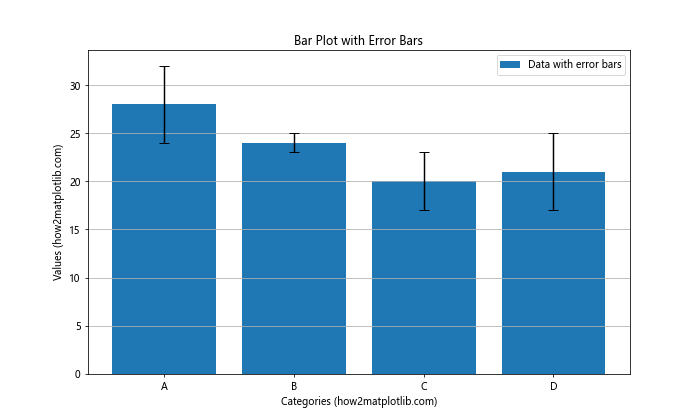
这个例子展示了如何在柱状图中添加误差条,这在比较不同类别的数据时特别有用。
7. 使用误差椭圆
对于二维数据,有时使用误差椭圆比使用传统的十字形误差条更为合适。误差椭圆可以同时表示x和y方向的误差,以及它们之间的相关性:
import matplotlib.pyplot as plt
import numpy as np
from matplotlib.patches import Ellipse

def confidence_ellipse(x, y, ax, n_std=3.0, facecolor='none', **kwargs):
    cov = np.cov(x, y)
    pearson = cov[0, 1]/np.sqrt(cov[0, 0] * cov[1, 1])
    ell_radius_x = np.sqrt(1 + pearson)
    ell_radius_y = np.sqrt(1 - pearson)
    ellipse = Ellipse((0, 0), width=ell_radius_x * 2, height=ell_radius_y * 2,
                      facecolor=facecolor, **kwargs)
    scale_x = np.sqrt(cov[0, 0]) * n_std
    scale_y = np.sqrt(cov[1, 1]) * n_std
    mean_x = np.mean(x)
    mean_y = np.mean(y)
    transf = transforms.Affine2D() \
        .rotate_deg(45) \
        .scale(scale_x, scale_y) \
        .translate(mean_x, mean_y)
    ellipse.set_transform(transf + ax.transData)
    return ax.add_patch(ellipse)

np.random.seed(42)
x = np.random.normal(0, 1, 100)
y = 2 * x + np.random.normal(0, 1, 100)

fig, ax = plt.subplots(figsize=(10, 6))
ax.scatter(x, y, s=5)
confidence_ellipse(x, y, ax, edgecolor='red')
ax.set_xlabel('X-axis (how2matplotlib.com)')
ax.set_ylabel('Y-axis (how2matplotlib.com)')
ax.set_title('Scatter Plot with Confidence Ellipse')
plt.grid(True)
plt.show()
这个例子定义了一个confidence_ellipse函数来计算和绘制置信椭圆。椭圆的大小和方向反映了数据的分布和相关性。
8. 处理大量数据点
当处理大量数据点时,单独的误差条可能会使图表变得杂乱。在这种情况下,我们可以考虑使用其他方法来表示误差,例如误差带(error band):
import matplotlib.pyplot as plt
import numpy as np

x = np.linspace(0, 10, 1000)
y = np.sin(x) + np.random.normal(0, 0.1, 1000)
y_mean = np.convolve(y, np.ones(50)/50, mode='same')
y_std = np.array([np.std(y[max(0, i-25):min(len(y), i+25)]) for i in range(len(y))])

plt.figure(figsize=(12, 6))
plt.plot(x, y, 'b.', alpha=0.1, label='Raw data')
plt.plot(x, y_mean, 'r-', label='Moving average')
plt.fill_between(x, y_mean - y_std, y_mean + y_std, alpha=0.2, label='Error band')
plt.xlabel('X-axis (how2matplotlib.com)')
plt.ylabel('Y-axis (how2matplotlib.com)')
plt.title('Scatter Plot with Error Band for Large Dataset')
plt.legend()
plt.grid(True)
plt.show()
Output:
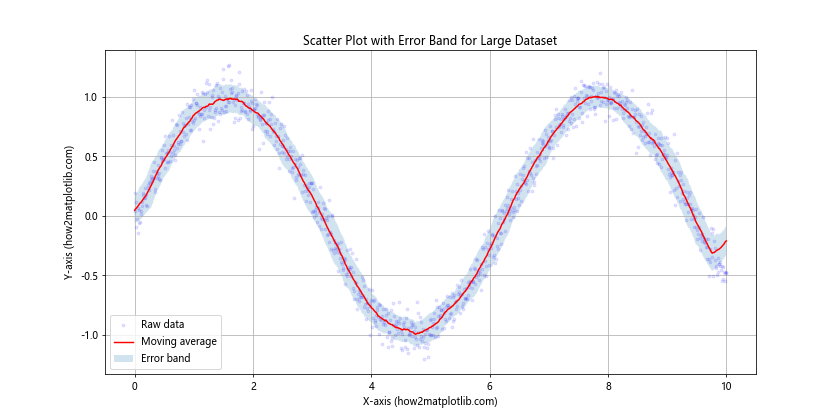
在这个例子中,我们使用移动平均来平滑数据,并使用标准差来创建误差带。这种方法可以有效地表示大量数据点的趋势和不确定性。
9. 结合箱线图和散点图
另一种表示数据分布和异常值的方法是结合使用箱线图和散点图:
import matplotlib.pyplot as plt
import numpy as np

# 生成示例数据
np.random.seed(42)
categories = ['A', 'B', 'C', 'D', 'E']
data = [np.random.normal(0, std, 100) for std in range(1, 6)]

fig, ax = plt.subplots(figsize=(12, 6))

# 绘制箱线图
bp = ax.boxplot(data, patch_artist=True)

# 自定义箱线图颜色
for patch in bp['boxes']:
    patch.set_facecolor('lightblue')

# 添加散点
for i, d in enumerate(data):
    y = d
    x = np.random.normal(i+1, 0.04, len(y))
    ax.plot(x, y, 'r.', alpha=0.2)

ax.set_xticklabels(categories)
ax.set_xlabel('Categories (how2matplotlib.com)')
ax.set_ylabel('Values (how2matplotlib.com)')
ax.set_title('Box Plot with Scatter Points')
plt.grid(True, axis='y')
plt.show()
Output:
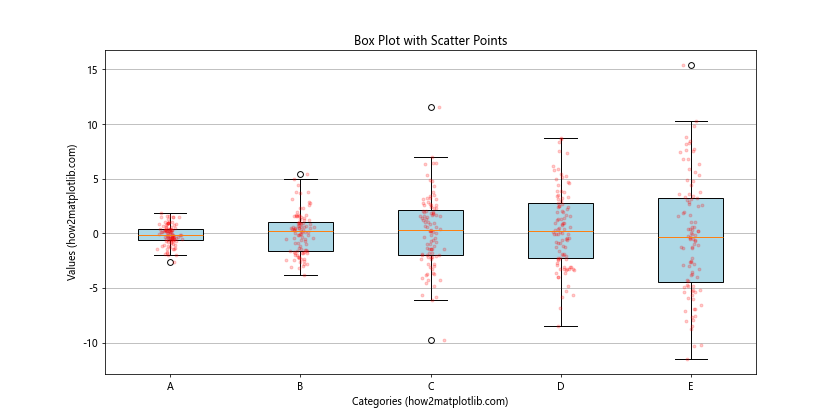
这个例子展示了如何将箱线图和散点图结合使用。箱线图显示了数据的四分位数和异常值,而散点图则展示了每个类别中所有数据点的分布。这种组合可以提供比单独使用误差条更丰富的信息。
10. 使用颜色编码表示误差
除了使用误差条,我们还可以使用颜色来编码误差信息:
import matplotlib.pyplot as plt
import numpy as np

x = np.linspace(0, 10, 50)
y = np.sin(x) + np.random.normal(0, 0.2, 50)
errors = np.random.uniform(0.05, 0.5, 50)

plt.figure(figsize=(12, 6))
scatter = plt.scatter(x, y, c=errors, s=50, cmap='viridis')
plt.colorbar(scatter, label='Error magnitude')
plt.xlabel('X-axis (how2matplotlib.com)')
plt.ylabel('Y-axis (how2matplotlib.com)')
plt.title('Scatter Plot with Color-Coded Errors')
plt.grid(True)
plt.show()
Output:
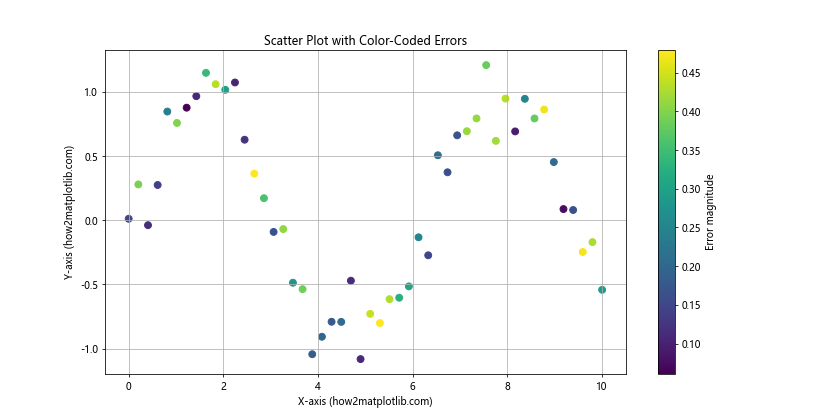
在这个例子中,我们使用plt.scatter()函数创建散点图,并通过c参数将误差值映射到颜色。颜色条显示了误差的大小范围。这种方法可以在不增加视觉复杂性的情况下传达误差信息。
11. 3D散点图中的误差条
Matplotlib也支持在3D散点图中添加误差条:
import matplotlib.pyplot as plt
import numpy as np

fig = plt.figure(figsize=(12, 8))
ax = fig.add_subplot(111, projection='3d')

# 生成示例数据
n = 100
x = np.random.rand(n)
y = np.random.rand(n)
z = np.random.rand(n)
dx = np.random.rand(n) * 0.1
dy = np.random.rand(n) * 0.1
dz = np.random.rand(n) * 0.1

# 绘制3D散点图和误差条
ax.scatter(x, y, z, c='b', marker='o')
for i in range(n):
    ax.plot([x[i], x[i]], [y[i], y[i]], [z[i]-dz[i], z[i]+dz[i]], color='r', alpha=0.5)
    ax.plot([x[i], x[i]], [y[i]-dy[i], y[i]+dy[i]], [z[i], z[i]], color='g', alpha=0.5)
    ax.plot([x[i]-dx[i], x[i]+dx[i]], [y[i], y[i]], [z[i], z[i]], color='b', alpha=0.5)

ax.set_xlabel('X-axis (how2matplotlib.com)')
ax.set_ylabel('Y-axis (how2matplotlib.com)')
ax.set_zlabel('Z-axis (how2matplotlib.com)')
ax.set_title('3D Scatter Plot with Error Bars')
plt.show()
Output:
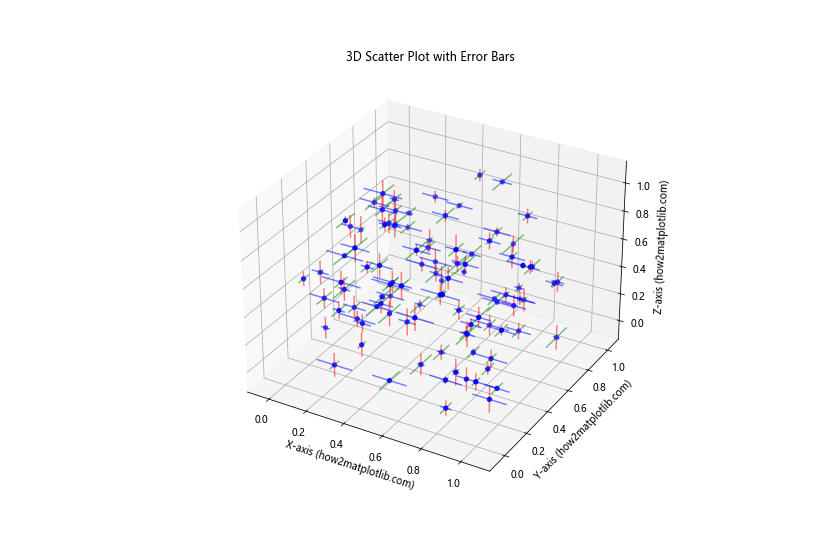
这个例子展示了如何在3D空间中为每个数据点添加x、y和z方向的误差条。这种可视化方法在处理多维数据时特别有用。
12. 使用误差条进行数据比较
误差条在比较不同组或条件下的数据时非常有用:
import matplotlib.pyplot as plt
import numpy as np

# 生成示例数据
groups = ['Group A', 'Group B', 'Group C']
means = [5, 7, 3]
std_devs = [0.8, 1.2, 0.6]

# 创建条形图
x = np.arange(len(groups))
width = 0.35

fig, ax = plt.subplots(figsize=(10, 6))
rects = ax.bar(x, means, width, yerr=std_devs, align='center', alpha=0.8, capsize=10)

# 添加一些文本,用于标记和美化
ax.set_ylabel('Scores (how2matplotlib.com)')
ax.set_title('Scores by Group with Error Bars')
ax.set_xticks(x)
ax.set_xticklabels(groups)
ax.legend()

# 在条形上方添加具体数值
def autolabel(rects):
    for rect in rects:
        height = rect.get_height()
        ax.annotate(f'{height:.1f}',
                    xy=(rect.get_x() + rect.get_width() / 2, height),
                    xytext=(0, 3),  # 3 points vertical offset
                    textcoords="offset points",
                    ha='center', va='bottom')

autolabel(rects)

fig.tight_layout()
plt.show()
这个例子展示了如何使用条形图和误差条来比较不同组的数据。误差条清晰地显示了每组数据的变异性,使得组间比较更加直观。
13. 使用bootstrap方法估计误差
在某些情况下,我们可能需要使用统计方法(如bootstrap)来估计误差:
import matplotlib.pyplot as plt
import numpy as np
from scipy import stats

def bootstrap_mean_ci(data, num_bootstrap_samples=10000, ci=0.95):
    bootstrap_means = np.random.choice(data, (num_bootstrap_samples, len(data)), replace=True).mean(axis=1)
    return np.percentile(bootstrap_means, [(1-ci)/2 * 100, (1+ci)/2 * 100])

# 生成示例数据
np.random.seed(42)
x = np.linspace(0, 10, 20)
y = 2 * x + 1 + np.random.normal(0, 2, 20)

# 计算bootstrap置信区间
ci_lower, ci_upper = np.array([bootstrap_mean_ci(y[max(0, i-2):min(len(y), i+3)]) for i in range(len(y))]).T

plt.figure(figsize=(12, 6))
plt.errorbar(x, y, yerr=[y-ci_lower, ci_upper-y], fmt='o', capsize=5, label='Data with CI')
plt.fill_between(x, ci_lower, ci_upper, alpha=0.2)
plt.xlabel('X-axis (how2matplotlib.com)')
plt.ylabel('Y-axis (how2matplotlib.com)')
plt.title('Scatter Plot with Bootstrap Confidence Intervals')
plt.legend()
plt.grid(True)
plt.show()
这个例子展示了如何使用bootstrap方法来估计每个数据点的置信区间,并将其作为误差条显示在散点图上。这种方法特别适用于数据分布未知或不符合正态分布的情况。
14. 在时间序列数据中使用误差条
对于时间序列数据,误差条可以帮助我们理解数据随时间的变化和不确定性:
import matplotlib.pyplot as plt
import numpy as np
import pandas as pd

# 生成示例时间序列数据
dates = pd.date_range(start='2023-01-01', end='2023-12-31', freq='D')
values = np.cumsum(np.random.randn(len(dates))) + 100
errors = np.random.rand(len(dates)) * 5

# 创建时间序列图
plt.figure(figsize=(14, 6))
plt.errorbar(dates, values, yerr=errors, fmt='o', capsize=3, alpha=0.7)
plt.xlabel('Date (how2matplotlib.com)')
plt.ylabel('Value (how2matplotlib.com)')
plt.title('Time Series with Error Bars')
plt.grid(True)
plt.xticks(rotation=45)
plt.tight_layout()
plt.show()
Output:
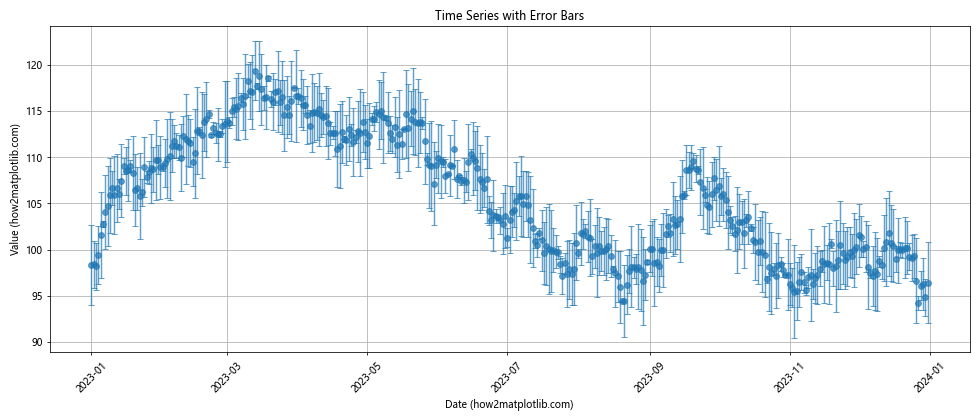
这个例子展示了如何在时间序列数据中添加误差条。这对于显示每日、每月或每年数据的变化和不确定性特别有用。
15. 结合热图和误差条
在某些情况下,我们可能需要在热图中添加误差信息:
import matplotlib.pyplot as plt
import numpy as np

# 生成示例数据
data = np.random.rand(5, 5)
errors = np.random.rand(5, 5) * 0.1

fig, (ax1, ax2) = plt.subplots(1, 2, figsize=(16, 6))

# 绘制热图
im = ax1.imshow(data, cmap='viridis')
ax1.set_title('Heatmap')
fig.colorbar(im, ax=ax1)

# 绘制带有误差条的散点图
x, y = np.meshgrid(range(data.shape[1]), range(data.shape[0]))
ax2.errorbar(x.ravel(), y.ravel(), xerr=errors.ravel(), yerr=errors.ravel(),
             fmt='o', capsize=3, ecolor='gray', alpha=0.5)
ax2.set_title('Scatter Plot with Error Bars')
ax2.invert_yaxis()
ax2.set_xlim(-0.5, 4.5)
ax2.set_ylim(4.5, -0.5)

for ax in [ax1, ax2]:
    ax.set_xlabel('X-axis (how2matplotlib.com)')
    ax.set_ylabel('Y-axis (how2matplotlib.com)')

plt.tight_layout()
plt.show()
Output:
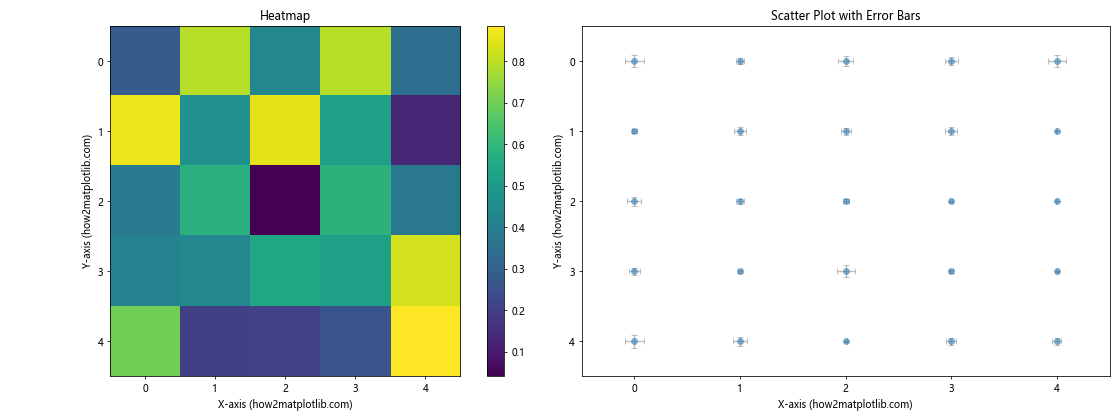
这个例子展示了如何将热图和带误差条的散点图结合使用。左侧的热图显示了数据的整体分布,而右侧的散点图则通过误差条展示了每个数据点的不确定性。
结论
在Matplotlib散点图中使用误差条是一种强大的数据可视化技术,可以帮助我们更好地理解和传达数据的不确定性。通过本文介绍的各种方法和技巧,您可以根据具体需求选择最合适的误差表示方式,从而创建更加信息丰富和准确的数据可视化。
无论是简单的垂直误差条,还是复杂的3D误差表示,Matplotlib都提供了灵活的工具来满足各种可视化需求。通过实践和探索,您可以掌握这些技术,并在自己的数据分析和科研工作中灵活运用。
记住,好的数据可视化不仅要准确表达数据,还要清晰易懂。在使用误差条时,要注意平衡信息的丰富性和图表的清晰度。适当的颜色选择、标记大小和误差条样式可以大大提高图表的可读性和美观度。
最后,希望本文的详细解释和丰富的示例代码能够帮助您更好地掌握在Matplotlib散点图中使用误差条的技巧,为您的数据分析工作增添新的维度。
 极客教程
极客教程