Matplotlib中的自动换行文本框:如何实现和优化
参考:Text box with line wrapping in Matplotlib
Matplotlib是Python中强大的数据可视化库,它不仅可以绘制各种图表,还能在图表中添加文本注释。在某些情况下,我们需要在图表中添加较长的文本说明,这时就需要用到自动换行的文本框功能。本文将详细介绍如何在Matplotlib中实现带有自动换行功能的文本框,以及如何优化其外观和位置。
1. 基本概念
在开始之前,我们需要了解一些基本概念:
- 文本框(Text box):在Matplotlib中,文本框是一个可以容纳文本的矩形区域。
- 自动换行(Line wrapping):当文本超过指定宽度时,自动将文本换行到下一行。
- 注释(Annotation):在图表中添加说明性文字的过程。
2. 使用plt.text()创建简单文本
首先,让我们从最基本的文本添加开始。我们可以使用plt.text()函数在图表中添加文本。
import matplotlib.pyplot as plt

fig, ax = plt.subplots()
ax.set_xlim(0, 10)
ax.set_ylim(0, 10)

ax.text(5, 5, "Welcome to how2matplotlib.com", ha='center', va='center')

plt.show()
Output:
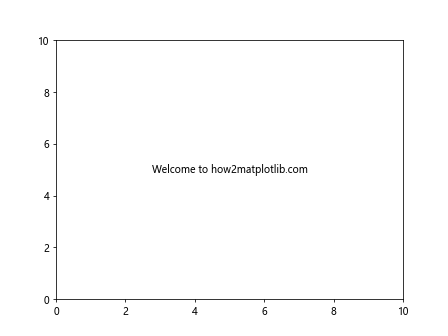
在这个例子中,我们在坐标(5, 5)处添加了一个简单的文本。但是,这种方法不支持自动换行。
3. 使用textwrap模块实现简单换行
Python的textwrap模块可以帮助我们实现简单的文本换行。
import matplotlib.pyplot as plt
import textwrap

fig, ax = plt.subplots()
ax.set_xlim(0, 10)
ax.set_ylim(0, 10)

text = "Welcome to how2matplotlib.com. This is a long text that needs to be wrapped."
wrapped_text = textwrap.fill(text, width=20)

ax.text(5, 5, wrapped_text, ha='center', va='center')

plt.show()
Output:
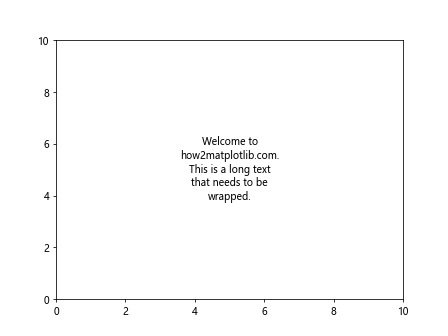
这个方法可以实现基本的换行,但是无法控制文本框的大小和位置。
4. 使用matplotlib.patches.TextArea实现自动换行文本框
matplotlib.patches.TextArea类提供了更多的控制选项,可以创建自动换行的文本框。
import matplotlib.pyplot as plt
from matplotlib.offsetbox import AnnotationBbox, TextArea

fig, ax = plt.subplots()
ax.set_xlim(0, 10)
ax.set_ylim(0, 10)

text = "Welcome to how2matplotlib.com. This is a long text that will be automatically wrapped in a text box."
text_box = TextArea(text, textprops=dict(size=10, ha='left', va='top'), multilinebaseline=True, minimumdescent=True)

ab = AnnotationBbox(text_box, (5, 5), frameon=True, box_alignment=(0.5, 0.5))
ax.add_artist(ab)

plt.show()
这个方法创建了一个自动换行的文本框,并将其放置在图表的中心。
5. 自定义文本框样式
我们可以通过设置bbox参数来自定义文本框的样式。
import matplotlib.pyplot as plt
from matplotlib.offsetbox import AnnotationBbox, TextArea

fig, ax = plt.subplots()
ax.set_xlim(0, 10)
ax.set_ylim(0, 10)

text = "Welcome to how2matplotlib.com. This text box has custom style."
text_box = TextArea(text, textprops=dict(color='white', fontweight='bold'))

ab = AnnotationBbox(text_box, (5, 5), frameon=True, box_alignment=(0.5, 0.5),
                    bboxprops=dict(facecolor='blue', edgecolor='white', alpha=0.8))
ax.add_artist(ab)

plt.show()
Output:
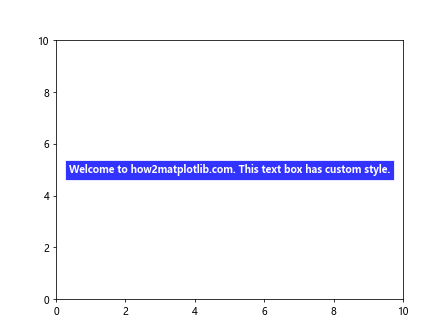
这个例子展示了如何创建一个蓝色背景、白色边框的文本框。
6. 添加箭头指向特定点
有时我们需要用箭头将文本框指向图表中的特定点。
import matplotlib.pyplot as plt
from matplotlib.offsetbox import AnnotationBbox, TextArea

fig, ax = plt.subplots()
ax.set_xlim(0, 10)
ax.set_ylim(0, 10)

ax.plot(3, 7, 'ro')  # 添加一个红点

text = "This arrow points to\nthe red dot (how2matplotlib.com)"
text_box = TextArea(text, textprops=dict(size=8))

ab = AnnotationBbox(text_box, (3, 7), xybox=(5, 5), frameon=True,
                    box_alignment=(0.5, 0.5), arrowprops=dict(arrowstyle="->"))
ax.add_artist(ab)

plt.show()
Output:
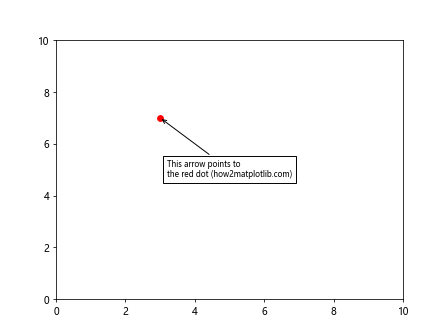
这个例子展示了如何添加一个带箭头的文本框,指向图表中的一个红点。
7. 在文本框中使用LaTeX
Matplotlib支持在文本中使用LaTeX语法,这对于添加数学公式特别有用。
import matplotlib.pyplot as plt
from matplotlib.offsetbox import AnnotationBbox, TextArea

fig, ax = plt.subplots()
ax.set_xlim(0, 10)
ax.set_ylim(0, 10)

text = r"\int_0^1 x^2 dx = \frac{1}{3} (how2matplotlib.com)"
text_box = TextArea(text, textprops=dict(size=12))

ab = AnnotationBbox(text_box, (5, 5), frameon=True, box_alignment=(0.5, 0.5))
ax.add_artist(ab)

plt.show()
Output:
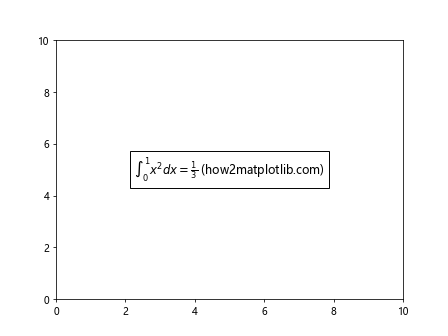
这个例子展示了如何在文本框中使用LaTeX语法添加数学公式。
8. 创建多列文本框
对于较长的文本,我们可能希望将其分成多列显示。
import matplotlib.pyplot as plt
from matplotlib.offsetbox import AnnotationBbox, TextArea, VPacker

fig, ax = plt.subplots(figsize=(12, 6))
ax.set_xlim(0, 10)
ax.set_ylim(0, 10)

text1 = "Welcome to how2matplotlib.com.\nThis is column 1."
text2 = "This is column 2.\nIt contains different text."

text_box1 = TextArea(text1, textprops=dict(size=10))
text_box2 = TextArea(text2, textprops=dict(size=10))

vpack = VPacker(children=[text_box1, text_box2], align="center", pad=5, sep=5)

ab = AnnotationBbox(vpack, (5, 5), frameon=True, box_alignment=(0.5, 0.5))
ax.add_artist(ab)

plt.show()
Output:
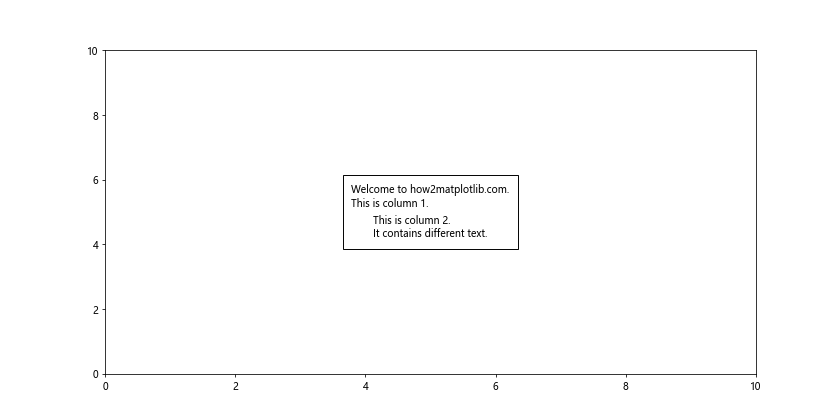
这个例子创建了一个包含两列文本的文本框。
9. 自动调整文本框大小
有时我们需要根据文本内容自动调整文本框的大小。
import matplotlib.pyplot as plt
from matplotlib.offsetbox import AnnotationBbox, TextArea
from matplotlib.transforms import Bbox

fig, ax = plt.subplots()
ax.set_xlim(0, 10)
ax.set_ylim(0, 10)

text = "Welcome to how2matplotlib.com.\nThis text box will adjust its size automatically."
text_box = TextArea(text, textprops=dict(size=10))

# 获取文本的边界框
renderer = fig.canvas.get_renderer()
bbox = text_box.get_window_extent(renderer)

# 将边界框转换为数据坐标
bbox_data = bbox.transformed(ax.transData.inverted())

# 创建一个稍大的边界框
padding = 0.1
new_bbox = Bbox.from_bounds(bbox_data.x0 - padding, bbox_data.y0 - padding,
                            bbox_data.width + 2*padding, bbox_data.height + 2*padding)

ab = AnnotationBbox(text_box, (5, 5), frameon=True, box_alignment=(0.5, 0.5), bboxprops=dict(boxstyle="round,pad=0.3"))
ax.add_artist(ab)

plt.show()
这个例子展示了如何根据文本内容自动调整文本框的大小。
10. 在文本框中添加图像
我们还可以在文本框中添加图像,创建更丰富的注释。
import matplotlib.pyplot as plt
import numpy as np
from matplotlib.offsetbox import AnnotationBbox, TextArea, DrawingArea, OffsetImage

fig, ax = plt.subplots()
ax.set_xlim(0, 10)
ax.set_ylim(0, 10)

# 创建一个简单的图像
image = np.random.rand(20, 20)
imagebox = OffsetImage(image, zoom=2)

# 创建文本
text = "This box contains both\ntext and image\n(how2matplotlib.com)"
text_box = TextArea(text, textprops=dict(size=10))

# 将图像和文本组合
drawing_area = DrawingArea(40, 80, 0, 0)
drawing_area.add_artist(imagebox)
drawing_area.add_artist(text_box)

ab = AnnotationBbox(drawing_area, (5, 5), frameon=True, box_alignment=(0.5, 0.5))
ax.add_artist(ab)

plt.show()
Output:
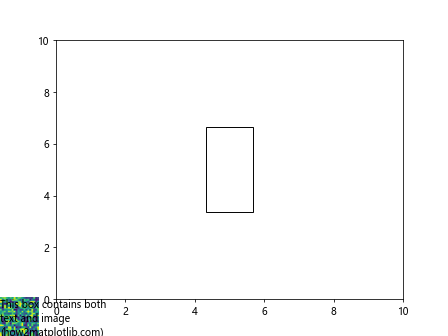
这个例子展示了如何在文本框中同时包含文本和图像。
11. 创建可交互的文本框
我们可以创建可以响应鼠标事件的交互式文本框。
import matplotlib.pyplot as plt
from matplotlib.offsetbox import AnnotationBbox, TextArea

fig, ax = plt.subplots()
ax.set_xlim(0, 10)
ax.set_ylim(0, 10)

text = "Click me! (how2matplotlib.com)"
text_box = TextArea(text, textprops=dict(size=12))

ab = AnnotationBbox(text_box, (5, 5), frameon=True, box_alignment=(0.5, 0.5))
ab.set_picker(True)
ax.add_artist(ab)

def on_pick(event):
    if event.artist == ab:
        print("Text box clicked!")

fig.canvas.mpl_connect('pick_event', on_pick)

plt.show()
Output:

这个例子创建了一个可以响应鼠标点击的文本框。
12. 在3D图表中添加文本框
Matplotlib也支持在3D图表中添加文本框。
import matplotlib.pyplot as plt
from mpl_toolkits.mplot3d import Axes3D
from matplotlib.offsetbox import AnnotationBbox, TextArea

fig = plt.figure()
ax = fig.add_subplot(111, projection='3d')

ax.set_xlim(0, 10)
ax.set_ylim(0, 10)
ax.set_zlim(0, 10)

text = "3D text box\n(how2matplotlib.com)"
text_box = TextArea(text, textprops=dict(size=10))

ab = AnnotationBbox(text_box, (5, 5, 5), frameon=True, box_alignment=(0.5, 0.5))
ax.add_artist(ab)

plt.show()
这个例子展示了如何在3D图表中添加文本框。
13. 使用HTML样式的文本
Matplotlib支持使用HTML样式的文本,这可以让我们创建更丰富的文本效果。
import matplotlib.pyplot as plt
from matplotlib.offsetbox import AnnotationBbox, TextArea

fig, ax = plt.subplots()
ax.set_xlim(0, 10)
ax.set_ylim(0, 10)

text = '<span style="color: red; font-size: 16px;">Red text</span><br><span style="color: blue; font-style: italic;">Blue italic text</span><br>(how2matplotlib.com)'
text_box = TextArea(text, textprops=dict(size=10), multilinebaseline=True)

ab = AnnotationBbox(text_box, (5, 5), frameon=True, box_alignment=(0.5, 0.5))
ax.add_artist(ab)

plt.show()
Output:
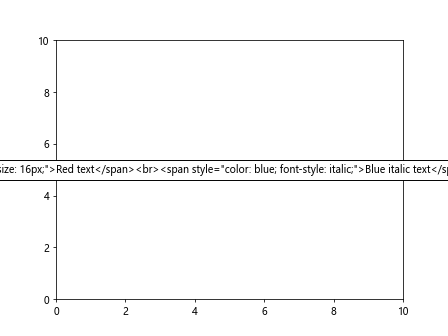
这个例子展示了如何使用HTML样式创建具有不同颜色和样式的文本。
14. 创建带有阴影的文本框
添加阴影可以让文本框在视觉上更加突出。
import matplotlib.pyplot as plt
from matplotlib.offsetbox import AnnotationBbox, TextArea
from matplotlib.patches import FancyBboxPatch

fig, ax = plt.subplots()
ax.set_xlim(0, 10)
ax.set_ylim(0, 10)

text = "Text box with shadow\n(how2matplotlib.com)"
text_box = TextArea(text, textprops=dict(size=12))

shadow = FancyBboxPatch((0, 0), 1, 1, boxstyle="round,pad=0.3", facecolor='gray', alpha=0.3)
ab = AnnotationBbox(text_box, (5, 5), frameon=True, box_alignment=(0.5, 0.5),
                    bboxprops=dict(boxstyle="round,pad=0.3", fc="white", ec="black"))

ax.add_artist(shadow)
ax.add_artist(ab)

plt.show()
Output:
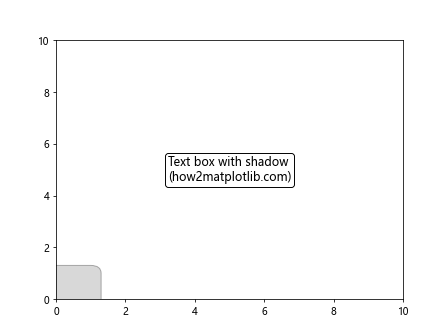
这个例子创建了一个带有阴影效果的文本框。
15. 创建带有渐变背景的文本框
我们可以使用Matplotlib的渐变功能为文本框创建渐变背景。
import matplotlib.pyplot as plt
import matplotlib.patches as patches
from matplotlib.offsetbox import AnnotationBbox, TextArea

fig, ax = plt.subplots()
ax.set_xlim(0, 10)
ax.set_ylim(0, 10)

text = "Gradient background\n(how2matplotlib.com)"
text_box = TextArea(text, textprops=dict(size=12, color='white'))

gradient = patches.Rectangle((0, 0), 1, 1, fc=(0, 0, 0, 0))
gradient.set_facecolor(plt.cm.viridis(np.linspace(0, 1, 2)))

ab = AnnotationBbox(text_box, (5, 5), frameon=True, box_alignment=(0.5, 0.5),
                    patch_artist=True, bboxprops=dict(facecolor=gradient.get_facecolor()))
ax.add_artist(ab)

plt.show()
这个例子创建了一个带有渐变背景的文本框。
16. 创建带有边框效果的文本框
我们可以为文本框添加特殊的边框效果,使其更加醒目。
import matplotlib.pyplot as plt
from matplotlib.offsetbox import AnnotationBbox, TextArea
from matplotlib.patches import FancyBboxPatch

fig, ax = plt.subplots()
ax.set_xlim(0, 10)
ax.set_ylim(0, 10)

text = "Fancy border\n(how2matplotlib.com)"
text_box = TextArea(text, textprops=dict(size=12))

fancy_box = FancyBboxPatch((0, 0), 1, 1, boxstyle="round,pad=0.3,rounding_size=0.2",
                           fc='white', ec='black', lw=2)

ab = AnnotationBbox(text_box, (5, 5), frameon=False, box_alignment=(0.5, 0.5))
ax.add_artist(fancy_box)
ax.add_artist(ab)

plt.show()
Output:
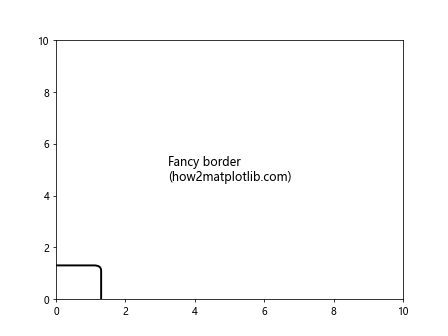
这个例子创建了一个带有圆角和粗边框的文本框。
17. 创建可折叠的文本框
我们可以创建一个可以展开和折叠的文本框,以节省图表空间。
import matplotlib.pyplot as plt
from matplotlib.offsetbox import AnnotationBbox, TextArea

fig, ax = plt.subplots()
ax.set_xlim(0, 10)
ax.set_ylim(0, 10)

short_text = "Click to expand (how2matplotlib.com)"
long_text = "This is a longer text that appears when you click.\nIt contains multiple lines of information."

short_box = TextArea(short_text, textprops=dict(size=10))
long_box = TextArea(long_text, textprops=dict(size=10))

ab_short = AnnotationBbox(short_box, (5, 5), frameon=True, box_alignment=(0.5, 0.5))
ab_long = AnnotationBbox(long_box, (5, 5), frameon=True, box_alignment=(0.5, 0.5))

ax.add_artist(ab_short)

def on_click(event):
    if ab_short in ax.artists:
        ax.artists.remove(ab_short)
        ax.add_artist(ab_long)
    else:
        ax.artists.remove(ab_long)
        ax.add_artist(ab_short)
    fig.canvas.draw()

fig.canvas.mpl_connect('button_press_event', on_click)

plt.show()
Output:
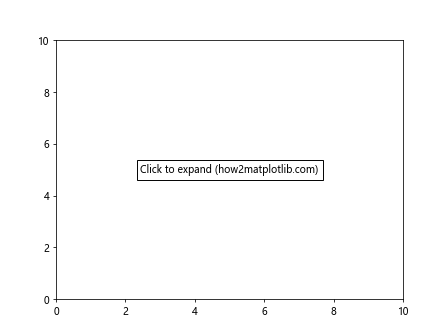
这个例子创建了一个可以通过点击展开和折叠的文本框。
18. 创建带有图标的文本框
我们可以在文本框中添加小图标,使其更加生动。
import matplotlib.pyplot as plt
from matplotlib.offsetbox import AnnotationBbox, TextArea, DrawingArea, OffsetImage
import matplotlib.patches as patches

fig, ax = plt.subplots()
ax.set_xlim(0, 10)
ax.set_ylim(0, 10)

# 创建一个简单的图标
icon = patches.Circle((0.5, 0.5), 0.4, fc='red')
icon_box = DrawingArea(1, 1)
icon_box.add_artist(icon)

text = "Text with icon\n(how2matplotlib.com)"
text_box = TextArea(text, textprops=dict(size=10))

# 组合图标和文本
drawing_area = DrawingArea(80, 40, 0, 0)
drawing_area.add_artist(icon_box)
drawing_area.add_artist(text_box)

ab = AnnotationBbox(drawing_area, (5, 5), frameon=True, box_alignment=(0.5, 0.5))
ax.add_artist(ab)

plt.show()
Output:
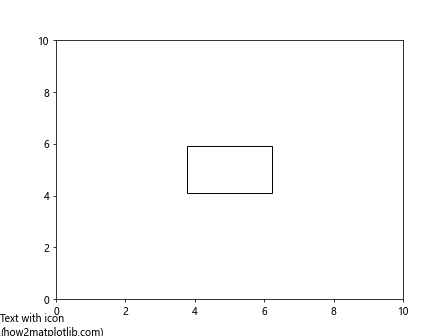
这个例子创建了一个带有小图标的文本框。
19. 创建带有进度条的文本框
我们可以在文本框中添加一个简单的进度条。
import matplotlib.pyplot as plt
from matplotlib.offsetbox import AnnotationBbox, TextArea, DrawingArea
import matplotlib.patches as patches

fig, ax = plt.subplots()
ax.set_xlim(0, 10)
ax.set_ylim(0, 10)

# 创建进度条
progress = 0.7  # 70% 进度
bar = patches.Rectangle((0, 0), progress, 0.2, fc='green')
bar_bg = patches.Rectangle((0, 0), 1, 0.2, fc='lightgray')

progress_box = DrawingArea(50, 10)
progress_box.add_artist(bar_bg)
progress_box.add_artist(bar)

text = f"Progress: {progress*100:.0f}%\n(how2matplotlib.com)"
text_box = TextArea(text, textprops=dict(size=10))

# 组合进度条和文本
drawing_area = DrawingArea(80, 40, 0, 0)
drawing_area.add_artist(progress_box)
drawing_area.add_artist(text_box)

ab = AnnotationBbox(drawing_area, (5, 5), frameon=True, box_alignment=(0.5, 0.5))
ax.add_artist(ab)

plt.show()
Output:
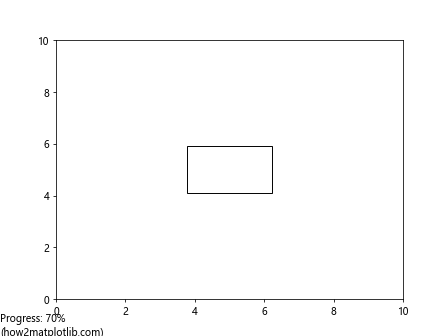
这个例子创建了一个带有简单进度条的文本框。
20. 创建带有表格的文本框
最后,我们可以在文本框中添加一个简单的表格。
import matplotlib.pyplot as plt
from matplotlib.offsetbox import AnnotationBbox, TextArea
import pandas as pd

fig, ax = plt.subplots(figsize=(10, 6))
ax.set_xlim(0, 10)
ax.set_ylim(0, 10)

# 创建一个简单的表格
data = {'Name': ['Alice', 'Bob', 'Charlie'],
        'Age': [25, 30, 35],
        'City': ['New York', 'London', 'Paris']}
df = pd.DataFrame(data)

# 将表格转换为字符串
table_str = df.to_string(index=False)
text = f"Simple table:\n\n{table_str}\n\n(how2matplotlib.com)"

text_box = TextArea(text, textprops=dict(size=10, family='monospace'))

ab = AnnotationBbox(text_box, (5, 5), frameon=True, box_alignment=(0.5, 0.5))
ax.add_artist(ab)

plt.show()
Output:
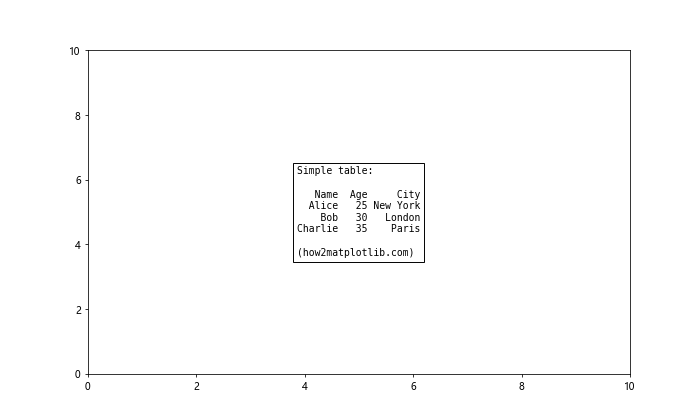
这个例子创建了一个包含简单表格的文本框。
通过以上20个示例,我们详细介绍了如何在Matplotlib中创建和自定义带有自动换行功能的文本框。这些技巧可以帮助你在数据可视化中添加更丰富、更有信息量的注释,使你的图表更加清晰和专业。记住,文本框不仅仅是用来显示文字,它还可以包含各种元素,如图像、图标、进度条甚至是表格。通过灵活运用这些技巧,你可以创建出更加吸引人和信息丰富的数据可视化作品。
在实际应用中,请根据你的具体需求选择合适的方法。例如,如果你只需要简单的文本注释,使用plt.text()或textwrap模块就足够了。如果你需要更复杂的布局或交互功能,可以考虑使用AnnotationBbox和TextArea。无论你选择哪种方法,都要记住保持文本清晰易读,并确保它不会遮挡重要的数据点或图表元素。
最后,不要忘记在使用这些技巧时考虑你的目标受众。确保你的文本框内容对他们来说是有意义和有价值的。通过精心设计的文本框,你可以有效地引导读者关注重要信息,解释复杂的概念,或者提供额外的上下文,从而增强你的数据可视化的整体效果和影响力。
 极客教程
极客教程