subplot和savefig
在matplotlib中,我们经常会使用subplot来创建多个子图,并且我们经常需要保存这些子图为图片文件。在本文中,我们将详细介绍如何使用subplot创建多个子图,以及如何使用savefig保存这些子图为图片文件。
创建子图
首先,让我们看看如何使用subplot创建多个子图。使用subplot函数,我们可以指定子图的行数、列数以及当前子图的位置。下面是一个简单的示例代码:
import matplotlib.pyplot as plt

# 创建第一个子图
plt.subplot(2, 1, 1)
plt.plot([1, 2, 3, 4], [10, 20, 30, 40])
plt.title('First Subplot')

# 创建第二个子图
plt.subplot(2, 1, 2)
plt.plot([1, 2, 3, 4], [40, 30, 20, 10])
plt.title('Second Subplot')

plt.show()
Output:
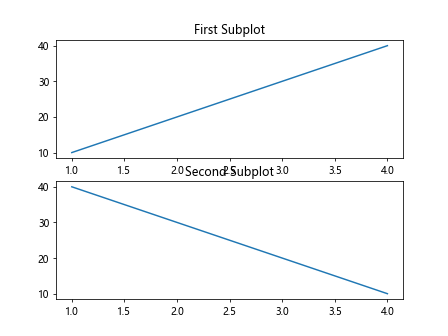
在上面的示例中,我们创建了一个包含两个子图的图形,第一个子图位于第一行,第二个子图位于第二行。每个子图都有自己的标题。
保存子图为图片文件
有时候,我们需要将创建的子图保存为图片文件。这时,我们可以使用savefig函数来实现。下面是一个示例代码:
import matplotlib.pyplot as plt

plt.subplot(2, 1, 1)
plt.plot([1, 2, 3, 4], [10, 20, 30, 40])
plt.title('First Subplot')

plt.subplot(2, 1, 2)
plt.plot([1, 2, 3, 4], [40, 30, 20, 10])
plt.title('Second Subplot')

plt.savefig('subplot_example.png')
plt.show()
Output:
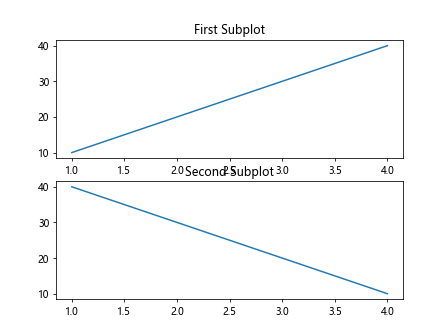
在上面的示例中,我们将创建的包含两个子图的图形保存为名为subplot_example.png的图片文件。
自定义子图布局
有时候,我们可能需要自定义子图的布局,比如调整子图之间的间距。这时,我们可以使用subplots函数来创建子图,并指定一些参数来自定义子图的布局。下面是一个示例代码:
import matplotlib.pyplot as plt

fig, axs = plt.subplots(2, 2, figsize=(10, 10), gridspec_kw={'hspace': 0.5, 'wspace': 0.4})

axs[0, 0].plot([1, 2, 3, 4], [10, 20, 30, 40])
axs[0, 0].set_title('First Subplot')

axs[0, 1].plot([1, 2, 3, 4], [40, 30, 20, 10])
axs[0, 1].set_title('Second Subplot')

plt.savefig('custom_subplot_layout.png')
plt.show()
Output:
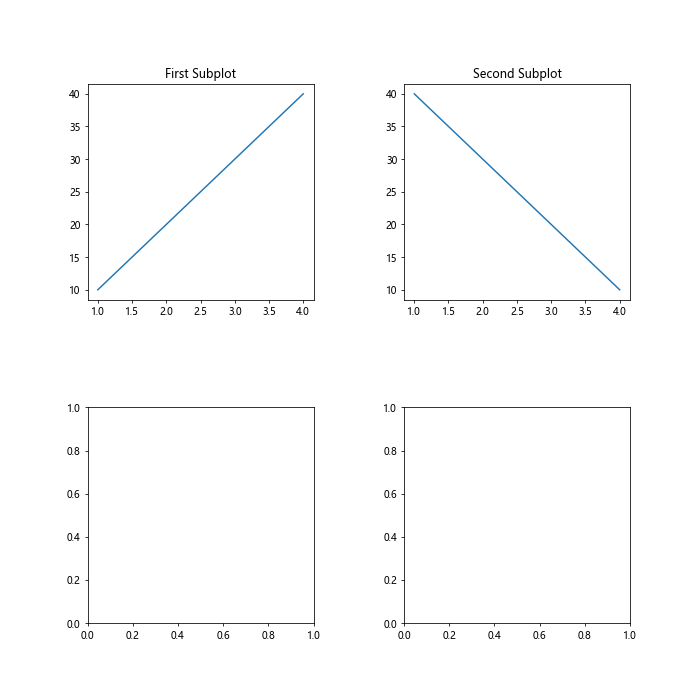
在上面的示例中,我们使用subplots函数创建了一个包含两行两列的子图布局,并通过gridspec_kw参数调整了子图之间的垂直间距和水平间距。
使用for循环创建多个子图
如果我们需要创建大量的子图,可以使用for循环来方便地创建多个子图。下面是一个示例代码:
import matplotlib.pyplot as plt

fig, axs = plt.subplots(4, 4, figsize=(20, 20))

for i in range(4):
    for j in range(4):
        axs[i, j].plot([1, 2, 3, 4], [10*(i+1), 20*(i+1), 30*(i+1), 40*(i+1)])
        axs[i, j].set_title(f'Subplot {i+1}-{j+1}')

plt.savefig('multiple_subplots.png')
plt.show()
Output:
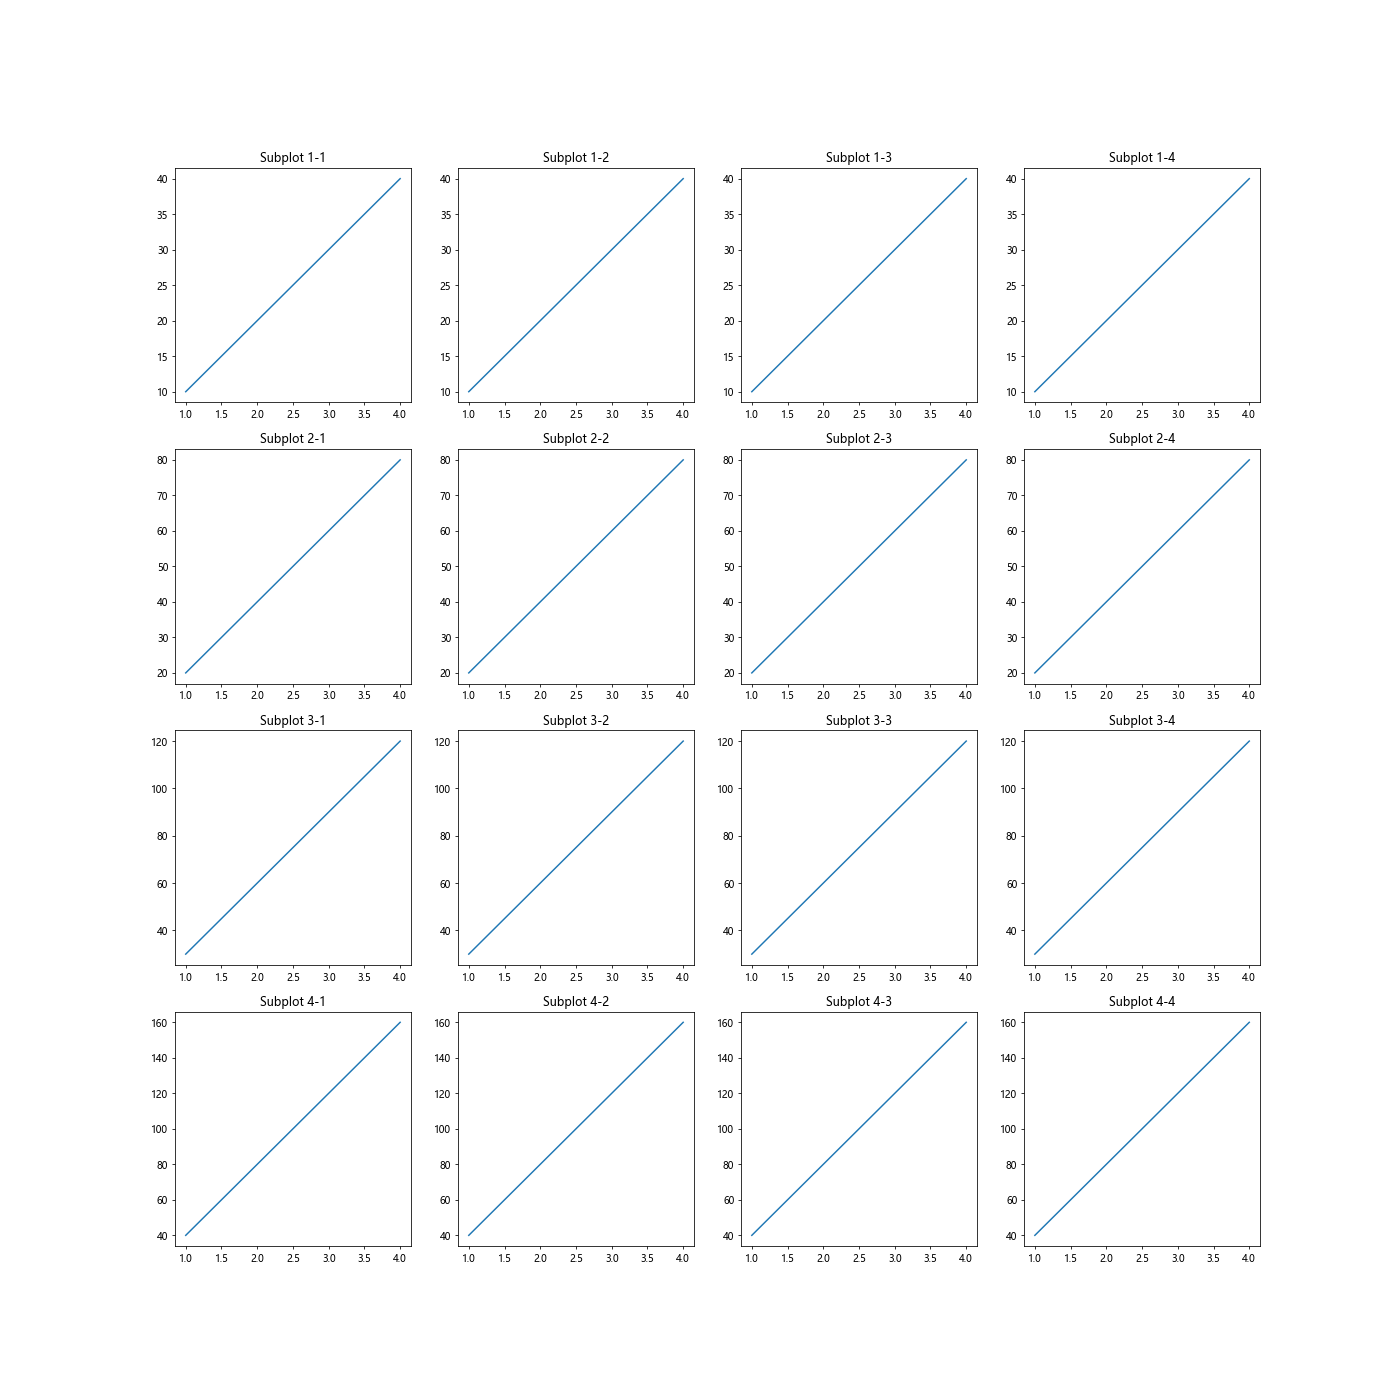
在上面的示例中,我们使用for循环创建了一个包含16个子图的图形,并使用f-string格式化了每个子图的标题。
设置子图之间的间距
有时候,我们希望调整子图之间的间距以使图形更美观。这时,我们可以使用subplots_adjust函数来实现。下面是一个示例代码:
import matplotlib.pyplot as plt

fig, axs = plt.subplots(2, 2)

axs[0, 0].plot([1, 2, 3, 4], [10, 20, 30, 40])
axs[0, 0].set_title('First Subplot')

axs[0, 1].plot([1, 2, 3, 4], [40, 30, 20, 10])
axs[0, 1].set_title('Second Subplot')

plt.subplots_adjust(wspace=0.5, hspace=0.3)

plt.savefig('adjusted_subplots.png')
plt.show()
Output:
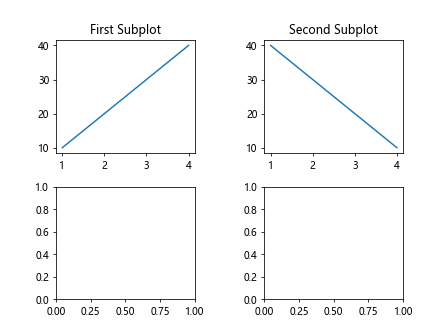
在上面的示例中,我们使用subplots_adjust函数调整了子图之间的水平间距和垂直间距。
使用gridspec创建自定义子图布局
除了subplots函数外,我们还可以使用gridspec模块来创建自定义的子图布局。下面是一个示例代码:
import matplotlib.pyplot as plt
import matplotlib.gridspec as gridspec

fig = plt.figure()

gs = gridspec.GridSpec(2, 2)

ax1 = fig.add_subplot(gs[0, 0])
ax1.plot([1, 2, 3, 4], [10, 20, 30, 40])
ax1.set_title('First Subplot')

ax2 = fig.add_subplot(gs[0, 1])
ax2.plot([1, 2, 3, 4], [40, 30, 20, 10])
ax2.set_title('Second Subplot')

plt.savefig('custom_grid_spec.png')
plt.show()
Output:
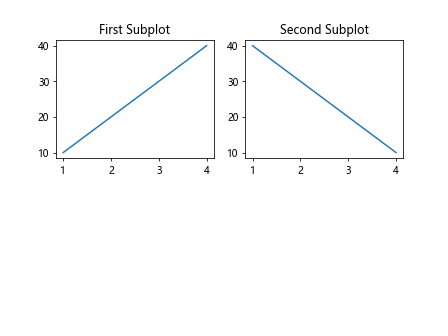
在上面的示例中,我们使用gridspec模块创建了一个包含两行两列的自定义子图布局。
使用subplot2grid创建灵活的子图布局
另一种创建子图的方法是使用subplot2grid函数。通过指定子图的行数、列数以及子图的位置,我们可以创建灵活的子图布局。下面是一个示例代码:
import matplotlib.pyplot as plt

plt.subplot2grid((3, 3), (0, 0), rowspan=2, colspan=2)
plt.plot([1, 2, 3, 4], [10, 20, 30, 40])
plt.title('First Subplot')

plt.subplot2grid((3, 3), (0, 2), rowspan=1, colspan=1)
plt.plot([1, 2, 3, 4], [40, 30, 20, 10])
plt.title('Second Subplot')

plt.savefig('flexible_subplot_layout.png')
plt.show()
Output:
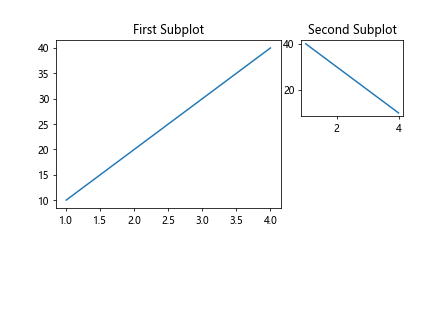
在上面的示例中,我们使用subplot2grid函数创建了一个包含两个子图的灵活子图布局,可以指定子图的跨度和列数。
使用gridspec来创建复杂的子图布局
如果需要创建更加复杂的子图布局,我们可以使用gridspec模块来实现。gridspec模块提供了更加灵活的子图布局方式,可以精确控制每个子图的位置和大小。下面是一个示例代码:
import matplotlib.pyplot as plt
import matplotlib.gridspec as gridspec

fig = plt.figure()

gs = gridspec.GridSpec(3, 3)

ax1 = fig.add_subplot(gs[0, :])
ax1.plot([1, 2, 3, 4], [10, 20, 30, 40])
ax1.set_title('First Subplot')

ax2 = fig.add_subplot(gs[1:, 0])
ax2.plot([1, 2, 3, 4], [40, 30, 20, 10])
ax2.set_title('Second Subplot')

ax3 = fig.add_subplot(gs[1:, 1:])
ax3.plot([1, 2, 3, 4], [25, 30, 35, 40])
ax3.set_title('Third Subplot')

plt.savefig('complex_subplot_layout.png')
plt.show()
Output:
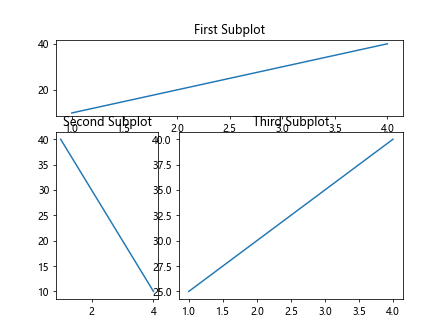
在上面的示例中,我们使用gridspec模块创建了一个包含三个子图的复杂子图布局,每个子图的位置和大小都可以通过指定参数来精确控制。
子图保存为不同格式的文件
除了保存子图为默认格式(如png)外,我们还可以将子图保存为其他格式的文件,比如pdf、svg等。下面是一个示例代码:
import matplotlib.pyplot as plt

plt.subplot(2, 1, 1)
plt.plot([1, 2, 3, 4], [10, 20, 30, 40])
plt.title('First Subplot')

plt.subplot(2, 1, 2)
plt.plot([1, 2, 3, 4], [40, 30, 20, 10])
plt.title('Second Subplot')

plt.savefig('subplot_example.pdf')
plt.show()
Output:
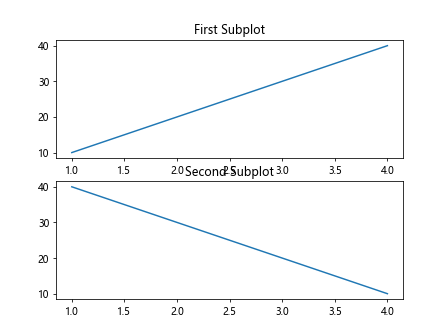
在上面的示例中,我们将包含两个子图的图形保存为pdf格式的文件。
使用figsize控制保存图片的大小
有时候,我们希望保存的图片大小和显示的大小不一样,这时可以使用figsize参数来控制图片的大小。下面是一个示例代码:
import matplotlib.pyplot as plt

plt.subplot(2, 1, 1)
plt.plot([1, 2, 3, 4], [10, 20, 30, 40])
plt.title('First Subplot')

plt.subplot(2, 1, 2)
plt.plot([1, 2, 3, 4], [40, 30, 20, 10])
plt.title('Second Subplot')

plt.savefig('subplot_custom_size.png', figsize=(6, 6))
plt.show()
在上面的示例中,我们通过figsize参数控制了保存的图片大小为6×6。
通过本文的介绍,我们学习了如何使用subplot创建多个子图,并且掌握了如何使用savefig保存这些子图为图片文件。同时,我们还学会了如何自定义子图布局、调整子图之间的间距,以及创建复杂的子图布局。
 极客教程
极客教程