Matplotlib直方图绘制:掌握plt.hist函数的bin宽度设置
直方图是数据分析和可视化中常用的图表类型,它可以帮助我们了解数据的分布情况。在Python的Matplotlib库中,plt.hist()函数是绘制直方图的主要工具。本文将深入探讨plt.hist()函数中的bin宽度设置,帮助读者更好地理解和应用这一重要参数。
1. 直方图基础
直方图是一种用于显示数据分布的图形表示。它将数据分成若干个区间(称为bin),然后计算每个区间内数据点的数量。在Matplotlib中,我们可以使用plt.hist()函数来创建直方图。
以下是一个基本的直方图示例:
import matplotlib.pyplot as plt
import numpy as np

# 生成随机数据
data = np.random.randn(1000)

# 绘制直方图
plt.hist(data, bins=30)
plt.title('Basic Histogram - how2matplotlib.com')
plt.xlabel('Value')
plt.ylabel('Frequency')
plt.show()
Output:
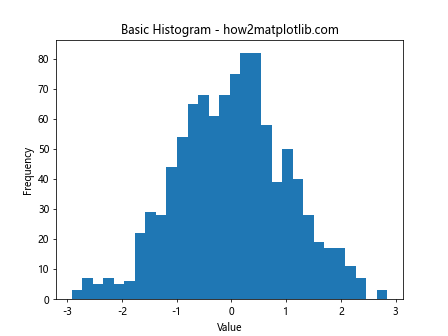
在这个例子中,我们生成了1000个服从标准正态分布的随机数,并使用30个bin来绘制直方图。bins参数决定了直方图的区间数量。
2. 理解bin宽度
bin宽度是直方图中每个区间的大小。它直接影响了直方图的外观和数据的解释。bin宽度太大可能会掩盖数据的细节,而bin宽度太小则可能会引入噪声。
默认情况下,Matplotlib会自动计算合适的bin宽度。但我们也可以手动设置bin宽度,以更好地控制直方图的表现。
2.1 固定bin宽度
我们可以通过设置bins参数为一个数组来指定固定的bin宽度:
import matplotlib.pyplot as plt
import numpy as np

data = np.random.randn(1000)

# 设置固定的bin宽度
bin_width = 0.5
bins = np.arange(min(data), max(data) + bin_width, bin_width)

plt.hist(data, bins=bins)
plt.title('Histogram with Fixed Bin Width - how2matplotlib.com')
plt.xlabel('Value')
plt.ylabel('Frequency')
plt.show()
Output:
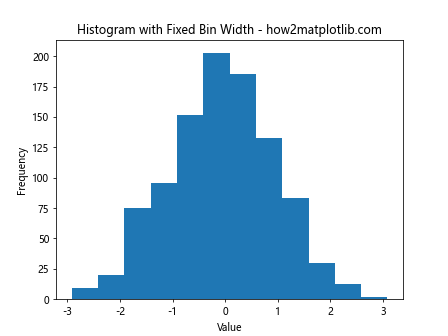
在这个例子中,我们将bin宽度设置为0.5,并使用np.arange()函数创建一个从数据最小值到最大值的等间距数组作为bin的边界。
2.2 可变bin宽度
有时,我们可能需要使用不同宽度的bin来更好地展示数据分布。Matplotlib允许我们设置可变的bin宽度:
import matplotlib.pyplot as plt
import numpy as np

data = np.random.exponential(scale=2, size=1000)

# 设置可变的bin宽度
bins = [0, 1, 2, 4, 8, 16]

plt.hist(data, bins=bins)
plt.title('Histogram with Variable Bin Width - how2matplotlib.com')
plt.xlabel('Value')
plt.ylabel('Frequency')
plt.show()
Output:
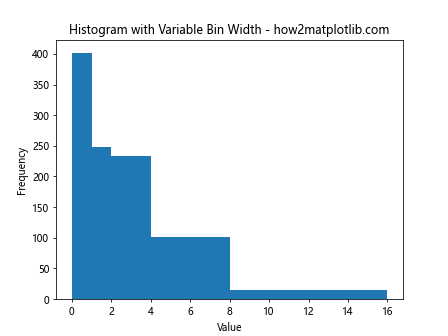
在这个例子中,我们使用指数分布生成数据,并设置了一个自定义的bin边界列表。这样可以在数据密集的区域使用较窄的bin,在数据稀疏的区域使用较宽的bin。
3. 自动bin宽度选择
Matplotlib提供了几种自动选择bin宽度的方法。这些方法可以通过bins参数的字符串值来指定。
3.1 ‘auto’方法
‘auto’方法是Matplotlib的默认选择,它使用Freedman-Diaconis规则来确定bin的数量:
import matplotlib.pyplot as plt
import numpy as np

data = np.random.randn(1000)

plt.hist(data, bins='auto')
plt.title("Histogram with 'auto' Bin Selection - how2matplotlib.com")
plt.xlabel('Value')
plt.ylabel('Frequency')
plt.show()
Output:
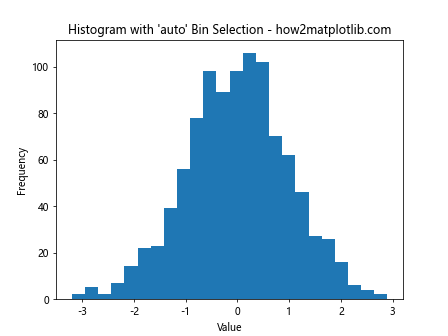
这个方法通常能够给出合理的结果,适用于大多数情况。
3.2 ‘sturges’方法
‘sturges’方法基于Sturges’ formula来确定bin的数量:
import matplotlib.pyplot as plt
import numpy as np

data = np.random.randn(1000)

plt.hist(data, bins='sturges')
plt.title("Histogram with 'sturges' Bin Selection - how2matplotlib.com")
plt.xlabel('Value')
plt.ylabel('Frequency')
plt.show()
Output:
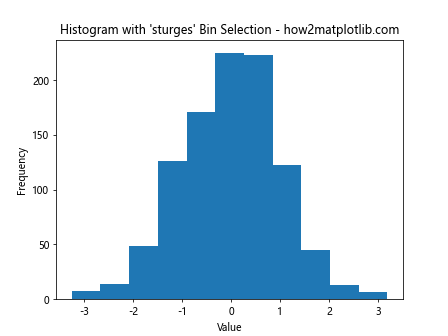
这个方法在数据量较小时效果较好。
3.3 ‘fd’方法
‘fd’方法直接使用Freedman-Diaconis规则来确定bin宽度:
import matplotlib.pyplot as plt
import numpy as np

data = np.random.randn(1000)

plt.hist(data, bins='fd')
plt.title("Histogram with 'fd' Bin Selection - how2matplotlib.com")
plt.xlabel('Value')
plt.ylabel('Frequency')
plt.show()
Output:
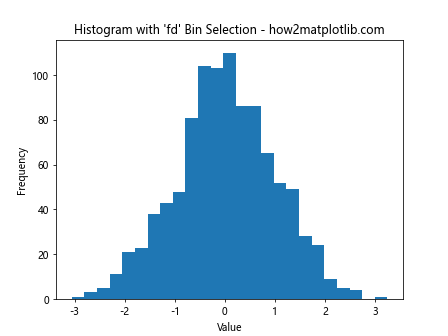
这个方法对异常值较为敏感,适用于大多数情况。
3.4 ‘doane’方法
‘doane’方法是Sturges’ formula的一个变体,适用于非正态分布的数据:
import matplotlib.pyplot as plt
import numpy as np

data = np.random.gamma(shape=2, scale=2, size=1000)

plt.hist(data, bins='doane')
plt.title("Histogram with 'doane' Bin Selection - how2matplotlib.com")
plt.xlabel('Value')
plt.ylabel('Frequency')
plt.show()
Output:
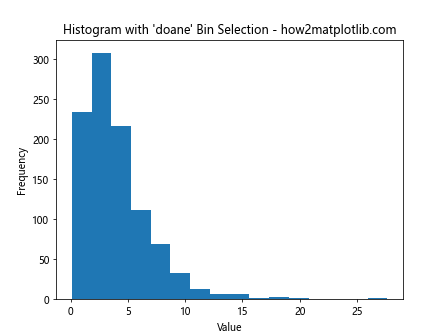
在这个例子中,我们使用了gamma分布的数据来展示’doane’方法的效果。
3.5 ‘scott’方法
‘scott’方法使用Scott’s normal reference rule来确定bin宽度:
import matplotlib.pyplot as plt
import numpy as np

data = np.random.randn(1000)

plt.hist(data, bins='scott')
plt.title("Histogram with 'scott' Bin Selection - how2matplotlib.com")
plt.xlabel('Value')
plt.ylabel('Frequency')
plt.show()
Output:
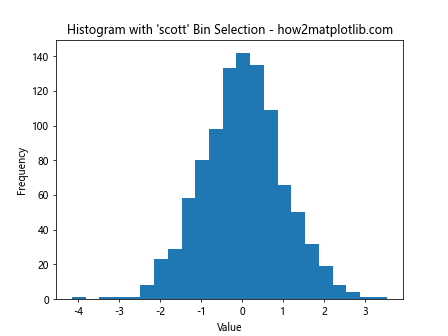
这个方法假设数据近似服从正态分布,并且对异常值不太敏感。
4. 高级bin宽度设置技巧
除了基本的bin宽度设置方法,我们还可以使用一些高级技巧来更精细地控制直方图的表现。
4.1 使用numpy的histogram函数
有时,我们可能想要更多地控制bin的边界。在这种情况下,我们可以先使用numpy的histogram函数计算直方图数据,然后使用plt.bar函数绘制:
import matplotlib.pyplot as plt
import numpy as np

data = np.random.randn(1000)

# 使用numpy计算直方图数据
hist, bin_edges = np.histogram(data, bins=30)

# 计算bin的中心位置
bin_centers = (bin_edges[:-1] + bin_edges[1:]) / 2

plt.bar(bin_centers, hist, width=bin_edges[1] - bin_edges[0])
plt.title('Histogram using numpy and plt.bar - how2matplotlib.com')
plt.xlabel('Value')
plt.ylabel('Frequency')
plt.show()
Output:
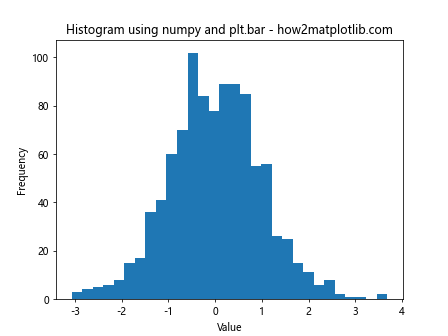
这种方法给了我们更多的灵活性,我们可以在绘图之前对直方图数据进行修改或进一步处理。
4.2 堆叠直方图
当我们需要比较多个数据集的分布时,堆叠直方图是一个很好的选择:
import matplotlib.pyplot as plt
import numpy as np

data1 = np.random.normal(0, 1, 1000)
data2 = np.random.normal(2, 1, 1000)

plt.hist([data1, data2], bins=30, stacked=True, label=['Data 1', 'Data 2'])
plt.title('Stacked Histogram - how2matplotlib.com')
plt.xlabel('Value')
plt.ylabel('Frequency')
plt.legend()
plt.show()
Output:
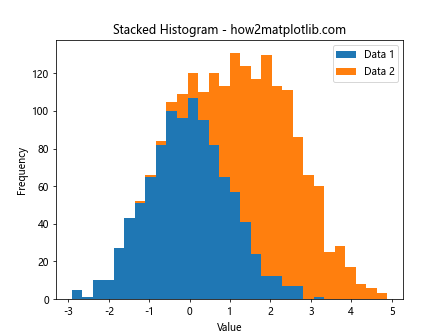
在这个例子中,我们创建了两个正态分布的数据集,并使用stacked=True参数来创建堆叠直方图。
4.3 累积直方图
累积直方图可以帮助我们理解数据的累积分布:
import matplotlib.pyplot as plt
import numpy as np

data = np.random.exponential(scale=2, size=1000)

plt.hist(data, bins=30, cumulative=True, density=True)
plt.title('Cumulative Histogram - how2matplotlib.com')
plt.xlabel('Value')
plt.ylabel('Cumulative Frequency')
plt.show()
Output:
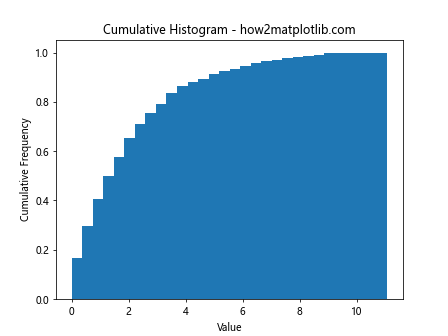
在这个例子中,我们使用cumulative=True参数来创建累积直方图,density=True参数将频率转换为概率密度。
4.4 多子图比较
当我们需要比较不同bin宽度设置的效果时,可以使用多子图:
import matplotlib.pyplot as plt
import numpy as np

data = np.random.randn(1000)

fig, axs = plt.subplots(2, 2, figsize=(12, 10))

axs[0, 0].hist(data, bins=10)
axs[0, 0].set_title('10 bins')

axs[0, 1].hist(data, bins=20)
axs[0, 1].set_title('20 bins')

axs[1, 0].hist(data, bins=50)
axs[1, 0].set_title('50 bins')

axs[1, 1].hist(data, bins=100)
axs[1, 1].set_title('100 bins')

plt.suptitle('Comparison of Different Bin Numbers - how2matplotlib.com')
plt.tight_layout()
plt.show()
Output:
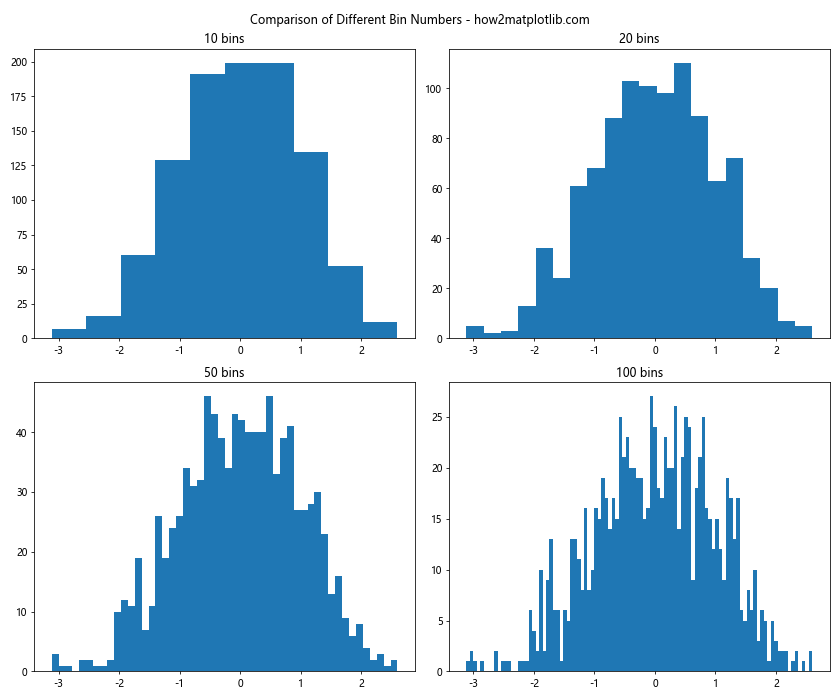
这个例子创建了一个2×2的子图网格,每个子图使用不同数量的bin来绘制同一组数据的直方图。
4.5 使用KDE曲线
有时,我们可能想要在直方图上叠加一个核密度估计(KDE)曲线,以更好地展示数据的分布:
import matplotlib.pyplot as plt
import numpy as np
from scipy import stats

data = np.random.randn(1000)

plt.hist(data, bins=30, density=True, alpha=0.7)
kde = stats.gaussian_kde(data)
x = np.linspace(data.min(), data.max(), 100)
plt.plot(x, kde(x), 'r-')
plt.title('Histogram with KDE - how2matplotlib.com')
plt.xlabel('Value')
plt.ylabel('Density')
plt.show()
Output:
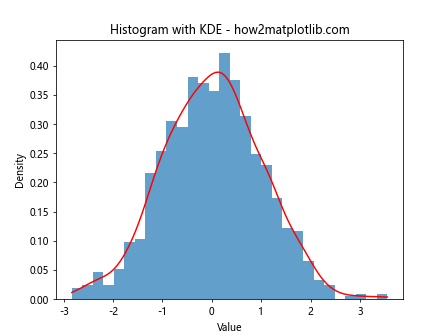
在这个例子中,我们使用scipy的gaussian_kde函数计算KDE,然后将其叠加在直方图上。
5. bin宽度对数据解释的影响
bin宽度的选择对数据的解释有重要影响。不同的bin宽度可能会导致对同一组数据得出不同的结论。
5.1 过宽的bin
import matplotlib.pyplot as plt
import numpy as np

np.random.seed(0)
data = np.concatenate([np.random.normal(-2, 1, 1000), np.random.normal(2, 1, 1000)])

plt.hist(data, bins=5)
plt.title('Histogram with Wide Bins - how2matplotlib.com')
plt.xlabel('Value')
plt.ylabel('Frequency')
plt.show()
Output:
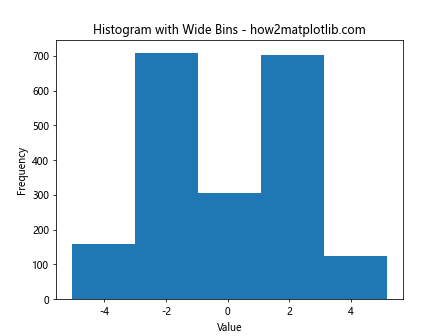
在这个例子中,我们使用了很宽的bin。这可能会掩盖数据的一些重要特征,比如数据的双峰分布。
5.2 过窄的bin
import matplotlib.pyplot as plt
import numpy as np

np.random.seed(0)
data = np.random.normal(0, 1, 1000)

plt.hist(data, bins=100)
plt.title('Histogram with Narrow Bins - how2matplotlib.com')
plt.xlabel('Value')
plt.ylabel('Frequency')
plt.show()
Output:
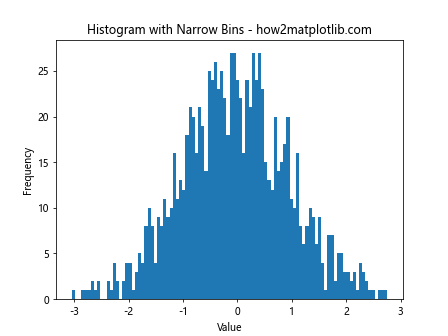
在这个例子中,我们使用了很窄的bin。这可能会引入过多的噪声,使得数据的整体趋势难以辨识。
5.3 合适的bin宽度
import matplotlib.pyplot as plt
import numpy as np

np.random.seed(0)
data = np.random.normal(0, 1, 1000)

plt.hist(data, bins='auto')
plt.title('Histogram with Appropriate Bin Width - how2matplotlib.com')
plt.xlabel('Value')
plt.ylabel('Frequency')
plt.show()
Output:
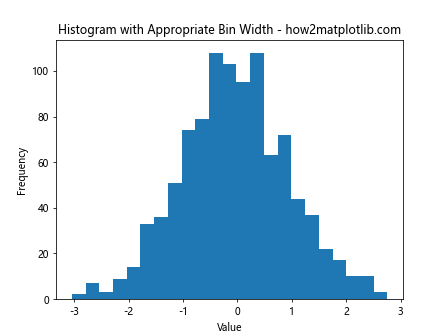
这个例子使用了Matplotlib的自动bin宽度选择。通常,这会给出一个合理的结果,能够较好地平衡细节和整体趋势。
6. 实际应用中的bin宽度选择
在实际应用中,选择合适的bin宽度通常需要结合数据的特性和分析的目的。以下是一些常见的应用场景和相应的bin宽度选择策略。
6.1 大数据集
对于大数据集,我们通常可以使用更多的bin来展示更多细节:
import matplotlib.pyplot as plt
import numpy as np

np.random.seed(0)
data = np.random.normal(0, 1, 100000)

plt.hist(data, bins=100)
plt.title('Histogram for Large Dataset - how2matplotlib.com')
plt.xlabel('Value')
plt.ylabel('Frequency')
plt.show()
Output:
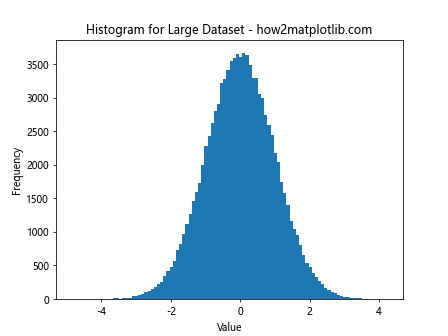
在这个例子中,我们使用了100个bin来展示100,000个数据点的分布。
6.2 小数据集
对于小数据集,我们可能需要使用较少的bin来避免过度拟合:
import matplotlib.pyplot as plt
import numpy as np

np.random.seed(0)
data = np.random.normal(0, 1, 50)

plt.hist(data,bins='sturges')
plt.title('Histogram for Small Dataset - how2matplotlib.com')
plt.xlabel('Value')
plt.ylabel('Frequency')
plt.show()
Output:
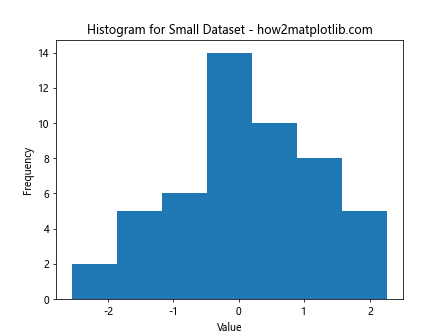
在这个例子中,我们使用Sturges方法来为50个数据点选择合适的bin数量。
6.3 多峰分布
对于多峰分布,我们可能需要使用更多的bin来捕捉分布的细节:
import matplotlib.pyplot as plt
import numpy as np

np.random.seed(0)
data = np.concatenate([np.random.normal(-3, 1, 1000), np.random.normal(0, 1, 1500), np.random.normal(3, 1, 1000)])

plt.hist(data, bins=50)
plt.title('Histogram for Multi-modal Distribution - how2matplotlib.com')
plt.xlabel('Value')
plt.ylabel('Frequency')
plt.show()
Output:
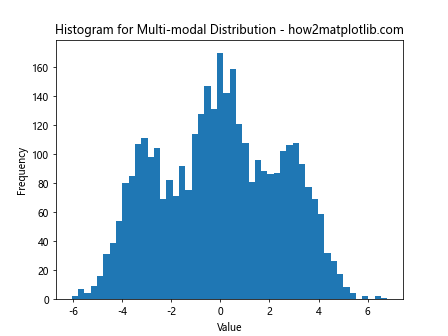
在这个例子中,我们使用了50个bin来展示一个三峰分布。
6.4 长尾分布
对于长尾分布,我们可能需要使用不等宽的bin:
import matplotlib.pyplot as plt
import numpy as np

np.random.seed(0)
data = np.random.pareto(1, 1000)

bins = [0, 1, 2, 5, 10, 20, 50, 100]
plt.hist(data, bins=bins)
plt.title('Histogram for Long-tailed Distribution - how2matplotlib.com')
plt.xlabel('Value')
plt.ylabel('Frequency')
plt.xscale('log')
plt.show()
Output:
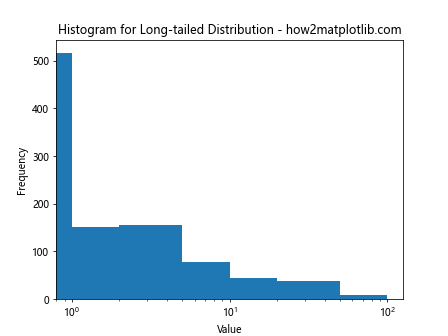
在这个例子中,我们使用了不等宽的bin来展示帕累托分布,并使用了对数刻度的x轴。
7. bin宽度与数据标准化
在某些情况下,我们可能需要对数据进行标准化,这会影响bin宽度的选择。
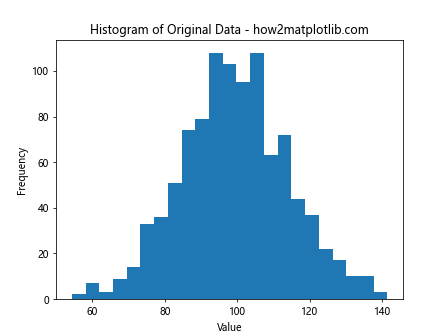
7.1 原始数据直方图
首先,让我们看一下原始数据的直方图:
import matplotlib.pyplot as plt
import numpy as np

np.random.seed(0)
data = np.random.normal(100, 15, 1000)

plt.hist(data, bins='auto')
plt.title('Histogram of Original Data - how2matplotlib.com')
plt.xlabel('Value')
plt.ylabel('Frequency')
plt.show()
Output:
7.2 标准化数据直方图
现在,让我们标准化数据并绘制直方图:
import matplotlib.pyplot as plt
import numpy as np
from scipy import stats

np.random.seed(0)
data = np.random.normal(100, 15, 1000)
data_standardized = stats.zscore(data)

plt.hist(data_standardized, bins='auto')
plt.title('Histogram of Standardized Data - how2matplotlib.com')
plt.xlabel('Z-score')
plt.ylabel('Frequency')
plt.show()
Output:
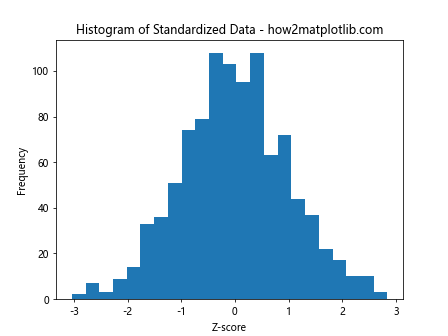
在这个例子中,我们使用了Z-score标准化。注意,标准化后的数据分布形状不变,但数值范围发生了变化。
8. bin宽度与数据可视化的美学
bin宽度不仅影响数据的解释,还会影响直方图的视觉效果。
8.1 美观的直方图
以下是一个美观的直方图示例:
import matplotlib.pyplot as plt
import numpy as np

np.random.seed(0)
data = np.random.normal(0, 1, 1000)

plt.figure(figsize=(10, 6))
plt.hist(data, bins=30, edgecolor='black', alpha=0.7)
plt.title('Aesthetically Pleasing Histogram - how2matplotlib.com', fontsize=16)
plt.xlabel('Value', fontsize=12)
plt.ylabel('Frequency', fontsize=12)
plt.grid(alpha=0.3)
plt.show()
Output:
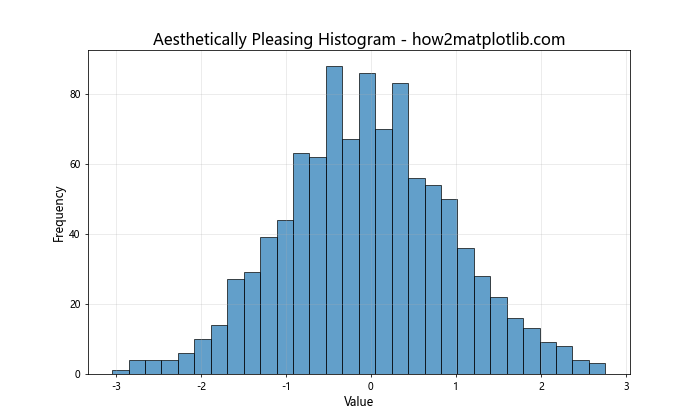
在这个例子中,我们调整了图形大小,添加了边框颜色,设置了透明度,并调整了字体大小和网格线。
8.2 颜色渐变直方图
我们还可以使用颜色渐变来增强直方图的视觉效果:
import matplotlib.pyplot as plt
import numpy as np

np.random.seed(0)
data = np.random.normal(0, 1, 1000)

n, bins, patches = plt.hist(data, bins=30)

# 设置颜色渐变
cm = plt.cm.get_cmap('viridis')
bin_centers = 0.5 * (bins[:-1] + bins[1:])
col = bin_centers - min(bin_centers)
col /= max(col)

for c, p in zip(col, patches):
    plt.setp(p, 'facecolor', cm(c))

plt.title('Gradient Color Histogram - how2matplotlib.com', fontsize=16)
plt.xlabel('Value', fontsize=12)
plt.ylabel('Frequency', fontsize=12)
plt.show()
Output:
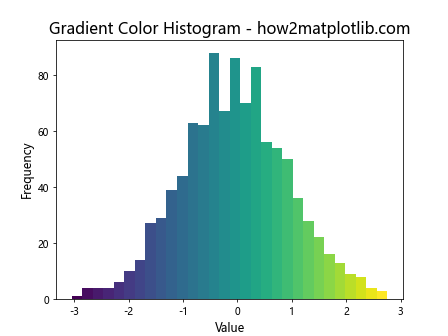
这个例子使用了颜色映射来为每个bin设置不同的颜色,创造出一种渐变效果。
9. bin宽度与统计分析
bin宽度的选择不仅影响直方图的视觉表现,还可能影响基于直方图的统计分析结果。
9.1 计算众数
直方图可以用来估计数据的众数。不同的bin宽度可能会导致不同的众数估计:
import matplotlib.pyplot as plt
import numpy as np

np.random.seed(0)
data = np.concatenate([np.random.normal(-1, 0.5, 1000), np.random.normal(1, 0.5, 1000)])

fig, (ax1, ax2) = plt.subplots(1, 2, figsize=(12, 5))

# 宽bin
n1, bins1, _ = ax1.hist(data, bins=10)
mode1 = bins1[np.argmax(n1)]
ax1.axvline(mode1, color='r', linestyle='dashed', linewidth=2)
ax1.set_title('Mode Estimation with Wide Bins - how2matplotlib.com')

# 窄bin
n2, bins2, _ = ax2.hist(data, bins=50)
mode2 = bins2[np.argmax(n2)]
ax2.axvline(mode2, color='r', linestyle='dashed', linewidth=2)
ax2.set_title('Mode Estimation with Narrow Bins - how2matplotlib.com')

plt.tight_layout()
plt.show()
Output:
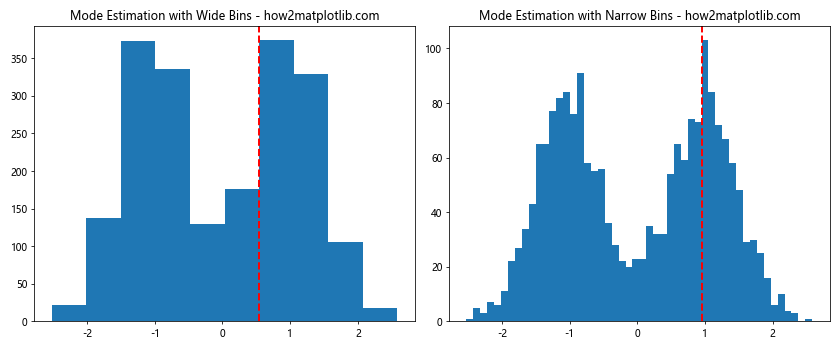
这个例子展示了不同bin宽度如何影响众数的估计。
9.2 密度估计
直方图也可以用于密度估计。bin宽度会影响估计的平滑程度:
import matplotlib.pyplot as plt
import numpy as np
from scipy import stats

np.random.seed(0)
data = np.random.normal(0, 1, 1000)

fig, (ax1, ax2) = plt.subplots(1, 2, figsize=(12, 5))

# 宽bin
ax1.hist(data, bins=10, density=True)
ax1.set_title('Density Estimation with Wide Bins - how2matplotlib.com')

# 窄bin
ax2.hist(data, bins=50, density=True)
ax2.set_title('Density Estimation with Narrow Bins - how2matplotlib.com')

# 真实密度函数
x = np.linspace(-4, 4, 100)
pdf = stats.norm.pdf(x)
ax1.plot(x, pdf, 'r-', lw=2)
ax2.plot(x, pdf, 'r-', lw=2)

plt.tight_layout()
plt.show()
Output:
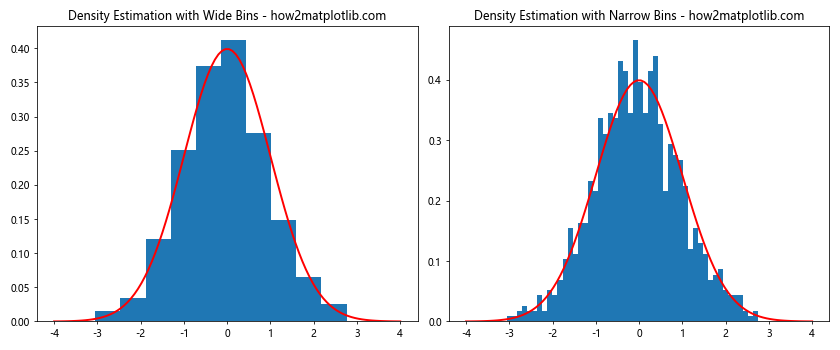
这个例子展示了不同bin宽度如何影响密度估计的结果,并与真实的概率密度函数进行了比较。
10. 结论
选择合适的bin宽度是创建有效直方图的关键。它需要平衡数据的细节和整体趋势,同时考虑数据的特性和分析的目的。Matplotlib提供了多种方法来设置bin宽度,从简单的固定宽度到复杂的自动选择算法。
在实际应用中,我们通常需要尝试不同的bin宽度设置,并结合领域知识来选择最合适的方案。同时,我们也要注意bin宽度对数据解释和统计分析的影响,确保我们的结论是基于合理的数据表示。
通过本文的介绍和示例,读者应该能够更好地理解和运用plt.hist函数中的bin宽度设置,从而创建更加准确和有洞察力的数据可视化。
 极客教程
极客教程