Matplotlib中如何在3D表面图上绘制单个点:详细教程与实例
参考:Plot Single 3D Point on Top of plot_surface in Python Matplotlib
Matplotlib是Python中强大的数据可视化库,它不仅能绘制2D图形,还能创建复杂的3D图表。本文将详细介绍如何在Matplotlib中的3D表面图上绘制单个点,这是一个常见但不太容易实现的需求。我们将从基础开始,逐步深入,通过多个示例来展示不同的技巧和方法。
1. 基础知识:3D图形在Matplotlib中的实现
在开始绘制3D表面图和单个点之前,我们需要了解Matplotlib中3D图形的基本概念和设置。
1.1 导入必要的库
首先,我们需要导入Matplotlib库以及其3D工具包。
import matplotlib.pyplot as plt
from mpl_toolkits.mplot3d import Axes3D
import numpy as np

# 创建一个新的图形
fig = plt.figure(figsize=(10, 8))
ax = fig.add_subplot(111, projection='3d')

# 设置标题
ax.set_title("How to plot 3D surface with a single point - how2matplotlib.com")

plt.show()
Output:
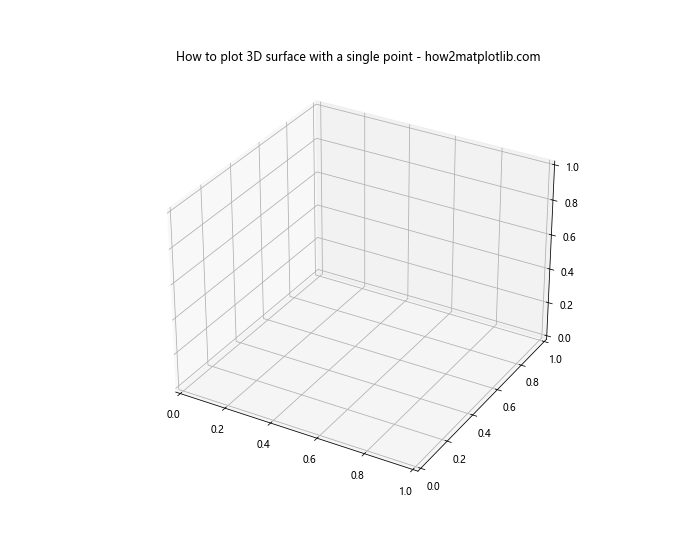
这段代码创建了一个基本的3D图形环境。我们导入了matplotlib.pyplot、Axes3D和numpy,这些是创建3D图形所必需的。
1.2 创建3D表面图
接下来,让我们创建一个简单的3D表面图。
import matplotlib.pyplot as plt
from mpl_toolkits.mplot3d import Axes3D
import numpy as np

# 创建数据
x = np.linspace(-5, 5, 100)
y = np.linspace(-5, 5, 100)
X, Y = np.meshgrid(x, y)
Z = np.sin(np.sqrt(X**2 + Y**2))

# 创建3D图形
fig = plt.figure(figsize=(10, 8))
ax = fig.add_subplot(111, projection='3d')

# 绘制表面
surf = ax.plot_surface(X, Y, Z, cmap='viridis')

# 添加颜色条
fig.colorbar(surf)

# 设置标题
ax.set_title("3D Surface Plot - how2matplotlib.com")

plt.show()
Output:
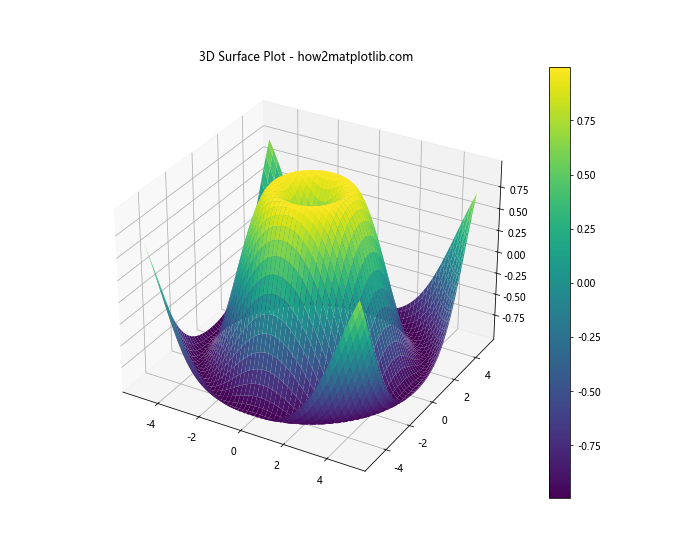
这个例子展示了如何创建一个基本的3D表面图。我们使用numpy生成了X、Y网格和对应的Z值,然后使用plot_surface函数绘制表面。
2. 在3D表面图上添加单个点
现在我们已经有了3D表面图,下一步是在这个表面上添加一个单独的点。
2.1 使用scatter函数添加点
scatter函数是在3D空间中添加点的最直接方法。
import matplotlib.pyplot as plt
from mpl_toolkits.mplot3d import Axes3D
import numpy as np

# 创建数据
x = np.linspace(-5, 5, 100)
y = np.linspace(-5, 5, 100)
X, Y = np.meshgrid(x, y)
Z = np.sin(np.sqrt(X**2 + Y**2))

# 创建3D图形
fig = plt.figure(figsize=(10, 8))
ax = fig.add_subplot(111, projection='3d')

# 绘制表面
surf = ax.plot_surface(X, Y, Z, cmap='viridis', alpha=0.8)

# 添加单个点
point_x, point_y = 2, 2
point_z = np.sin(np.sqrt(point_x**2 + point_y**2))
ax.scatter(point_x, point_y, point_z, color='red', s=100)

# 设置标题
ax.set_title("3D Surface with a Single Point - how2matplotlib.com")

plt.show()
Output:
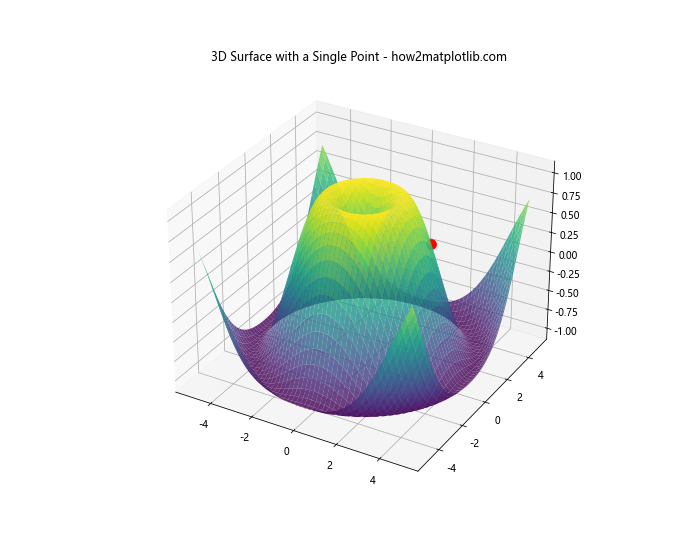
在这个例子中,我们首先创建了3D表面图,然后使用scatter函数在(2, 2)位置添加了一个红色的点。s=100参数设置点的大小。
2.2 调整点的外观
我们可以进一步调整点的外观,使其更加突出。
import matplotlib.pyplot as plt
from mpl_toolkits.mplot3d import Axes3D
import numpy as np

# 创建数据
x = np.linspace(-5, 5, 100)
y = np.linspace(-5, 5, 100)
X, Y = np.meshgrid(x, y)
Z = np.sin(np.sqrt(X**2 + Y**2))

# 创建3D图形
fig = plt.figure(figsize=(10, 8))
ax = fig.add_subplot(111, projection='3d')

# 绘制表面
surf = ax.plot_surface(X, Y, Z, cmap='viridis', alpha=0.7)

# 添加单个点
point_x, point_y = 0, 0
point_z = np.sin(np.sqrt(point_x**2 + point_y**2))
ax.scatter(point_x, point_y, point_z, color='red', s=200, marker='^', edgecolors='black')

# 设置标题
ax.set_title("3D Surface with a Customized Point - how2matplotlib.com")

plt.show()
Output:
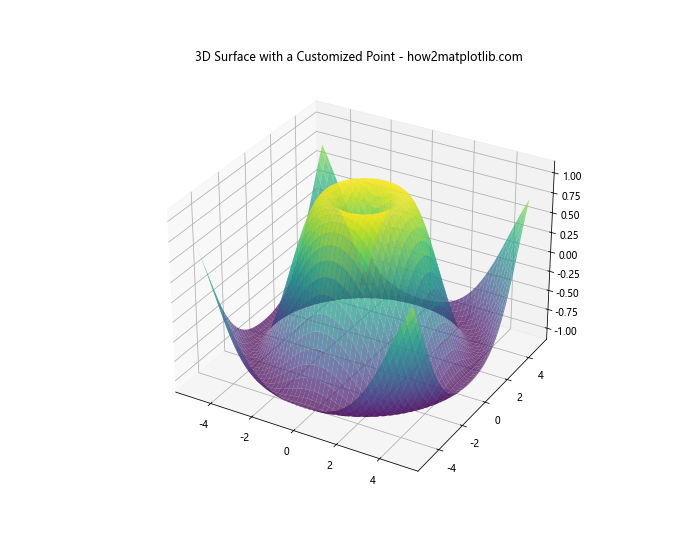
在这个例子中,我们将点移到了(0, 0)位置,增加了点的大小,改变了标记的形状为三角形,并添加了黑色边缘。
3. 添加多个点和标签
有时,我们可能需要在3D表面上添加多个点,并为这些点添加标签。
3.1 添加多个点
import matplotlib.pyplot as plt
from mpl_toolkits.mplot3d import Axes3D
import numpy as np

# 创建数据
x = np.linspace(-5, 5, 100)
y = np.linspace(-5, 5, 100)
X, Y = np.meshgrid(x, y)
Z = np.sin(np.sqrt(X**2 + Y**2))

# 创建3D图形
fig = plt.figure(figsize=(12, 10))
ax = fig.add_subplot(111, projection='3d')

# 绘制表面
surf = ax.plot_surface(X, Y, Z, cmap='viridis', alpha=0.7)

# 添加多个点
points = [(0, 0), (2, 2), (-2, -2)]
colors = ['red', 'green', 'blue']

for (px, py), color in zip(points, colors):
    pz = np.sin(np.sqrt(px**2 + py**2))
    ax.scatter(px, py, pz, color=color, s=100)

# 设置标题
ax.set_title("3D Surface with Multiple Points - how2matplotlib.com")

plt.show()
Output:
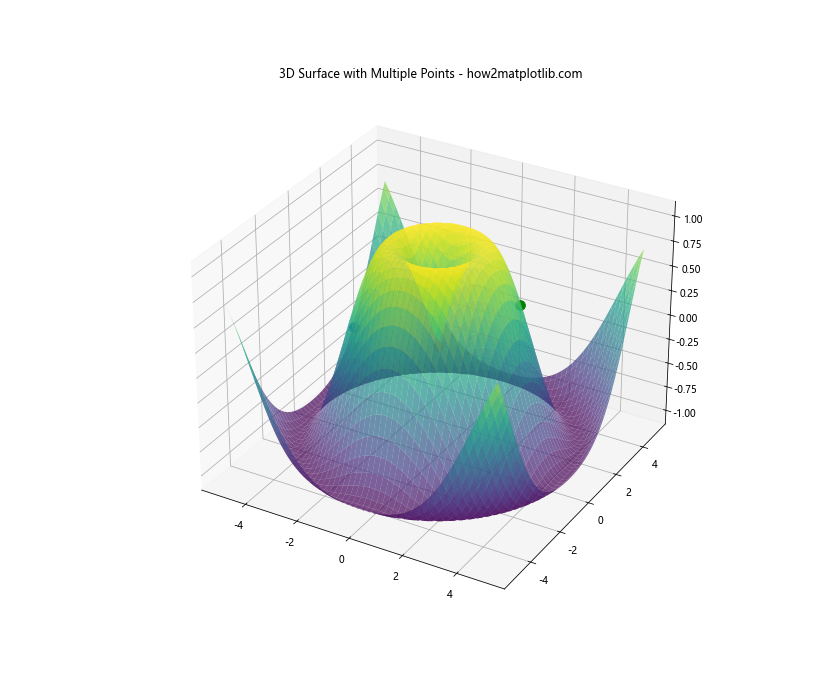
这个例子展示了如何在3D表面上添加多个不同颜色的点。
3.2 为点添加标签
我们可以使用text函数为点添加标签。
import matplotlib.pyplot as plt
from mpl_toolkits.mplot3d import Axes3D
import numpy as np

# 创建数据
x = np.linspace(-5, 5, 100)
y = np.linspace(-5, 5, 100)
X, Y = np.meshgrid(x, y)
Z = np.sin(np.sqrt(X**2 + Y**2))

# 创建3D图形
fig = plt.figure(figsize=(12, 10))
ax = fig.add_subplot(111, projection='3d')

# 绘制表面
surf = ax.plot_surface(X, Y, Z, cmap='viridis', alpha=0.7)

# 添加多个点并标记
points = [(0, 0), (2, 2), (-2, -2)]
colors = ['red', 'green', 'blue']
labels = ['Point A', 'Point B', 'Point C']

for (px, py), color, label in zip(points, colors, labels):
    pz = np.sin(np.sqrt(px**2 + py**2))
    ax.scatter(px, py, pz, color=color, s=100)
    ax.text(px, py, pz, label, fontsize=10)

# 设置标题
ax.set_title("3D Surface with Labeled Points - how2matplotlib.com")

plt.show()
Output:
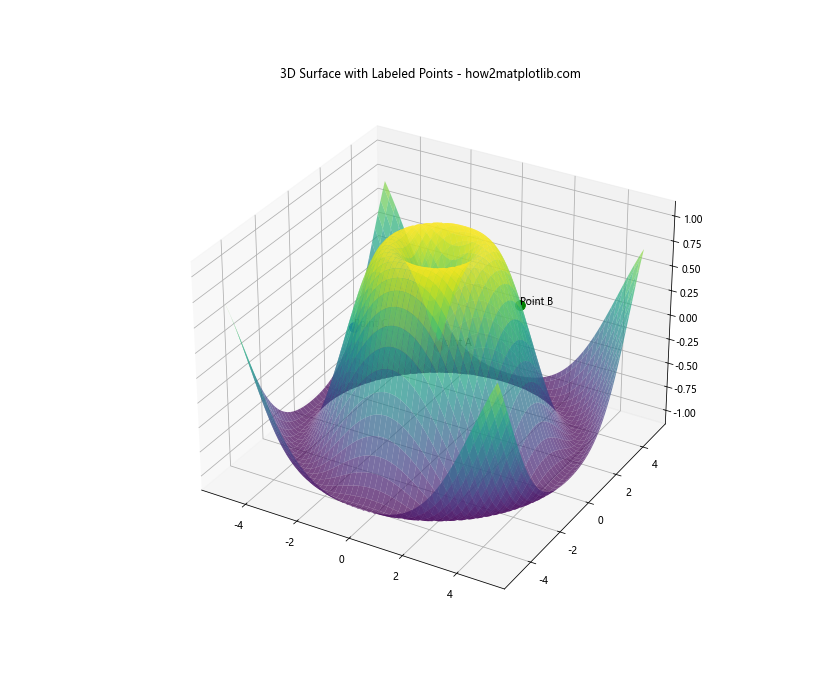
这个例子为每个点添加了标签,使用text函数在点的位置显示文本。
4. 高级技巧:动态点和交互
为了使我们的3D图形更加生动和交互,我们可以添加一些高级功能。
4.1 添加动态点
我们可以创建一个动画,使点在3D表面上移动。
import matplotlib.pyplot as plt
from mpl_toolkits.mplot3d import Axes3D
import numpy as np
from matplotlib.animation import FuncAnimation

# 创建数据
x = np.linspace(-5, 5, 100)
y = np.linspace(-5, 5, 100)
X, Y = np.meshgrid(x, y)
Z = np.sin(np.sqrt(X**2 + Y**2))

# 创建3D图形
fig = plt.figure(figsize=(10, 8))
ax = fig.add_subplot(111, projection='3d')

# 绘制表面
surf = ax.plot_surface(X, Y, Z, cmap='viridis', alpha=0.7)

# 初始化点
point, = ax.plot([], [], [], 'ro', markersize=10)

# 动画更新函数
def update(frame):
    t = frame / 50  # 时间参数
    px = 3 * np.cos(t)
    py = 3 * np.sin(t)
    pz = np.sin(np.sqrt(px**2 + py**2))
    point.set_data(px, py)
    point.set_3d_properties(pz)
    return point,

# 创建动画
anim = FuncAnimation(fig, update, frames=200, interval=50, blit=True)

# 设置标题
ax.set_title("3D Surface with Moving Point - how2matplotlib.com")

plt.show()
Output:

这个例子创建了一个动画,其中一个点沿着圆形路径在3D表面上移动。
4.2 添加交互功能
我们可以添加一些交互功能,允许用户通过鼠标点击在3D表面上添加点。
import matplotlib.pyplot as plt
from mpl_toolkits.mplot3d import Axes3D
import numpy as np

# 创建数据
x = np.linspace(-5, 5, 100)
y = np.linspace(-5, 5, 100)
X, Y = np.meshgrid(x, y)
Z = np.sin(np.sqrt(X**2 + Y**2))

# 创建3D图形
fig = plt.figure(figsize=(10, 8))
ax = fig.add_subplot(111, projection='3d')

# 绘制表面
surf = ax.plot_surface(X, Y, Z, cmap='viridis', alpha=0.7)

# 点击事件处理函数
def on_click(event):
    if event.inaxes == ax:
        x, y = event.xdata, event.ydata
        z = np.sin(np.sqrt(x**2 + y**2))
        ax.scatter(x, y, z, color='red', s=50)
        plt.draw()

# 连接点击事件
fig.canvas.mpl_connect('button_press_event', on_click)

# 设置标题
ax.set_title("Interactive 3D Surface - Click to Add Points - how2matplotlib.com")

plt.show()
Output:
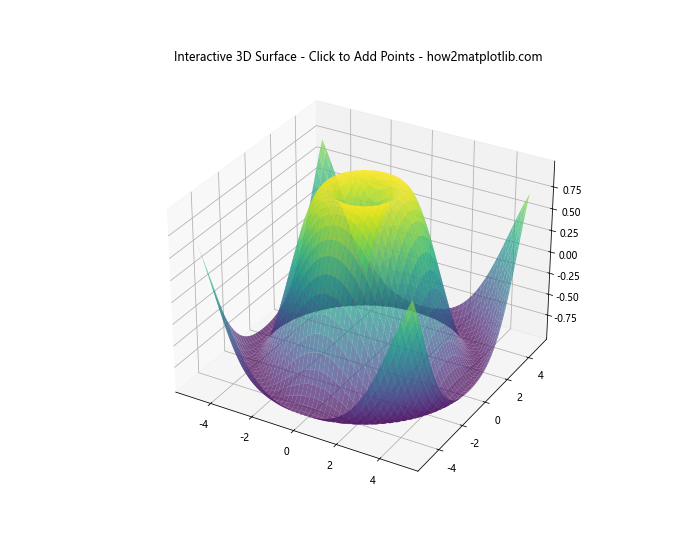
这个例子允许用户通过点击图形来在3D表面上添加点。
5. 优化图形显示
为了使我们的3D图形更加美观和易读,我们可以进行一些优化。
5.1 调整视角和缩放
我们可以调整3D图形的视角和缩放比例,以更好地展示点和表面。
import matplotlib.pyplot as plt
from mpl_toolkits.mplot3d import Axes3D
import numpy as np

# 创建数据
x = np.linspace(-5, 5, 100)
y = np.linspace(-5, 5, 100)
X, Y = np.meshgrid(x, y)
Z = np.sin(np.sqrt(X**2 + Y**2))

# 创建3D图形
fig = plt.figure(figsize=(12, 10))
ax = fig.add_subplot(111, projection='3d')

# 绘制表面
surf = ax.plot_surface(X, Y, Z, cmap='viridis', alpha=0.7)

# 添加点
ax.scatter(0, 0, np.sin(0), color='red', s=100)

# 调整视角
ax.view_init(elev=20, azim=45)

# 设置坐标轴范围
ax.set_xlim(-5, 5)
ax.set_ylim(-5, 5)
ax.set_zlim(-1, 1)

# 设置标题和标签
ax.set_title("Optimized 3D Surface with Point - how2matplotlib.com")
ax.set_xlabel('X axis')
ax.set_ylabel('Y axis')
ax.set_zlabel('Z axis')

plt.show()
Output:
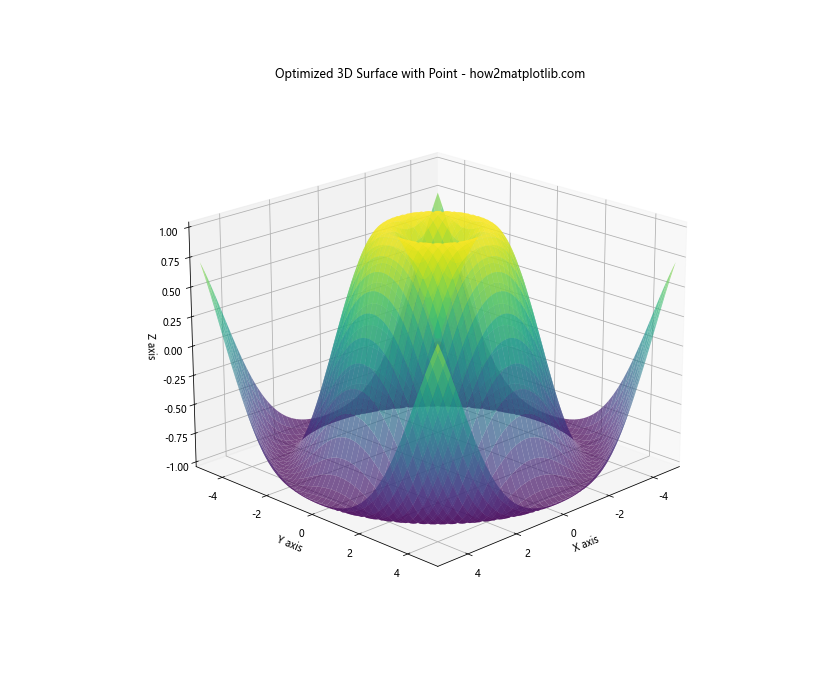
这个例子展示了如何调整3D图形的视角、坐标轴范围,以及添加坐标轴标签。
5.2 添加图例和颜色条
为了使图形更加信息丰富,我们可以添加图例和颜色条。
import matplotlib.pyplot as plt
from mpl_toolkits.mplot3d import Axes3D
import numpy as np

# 创建数据
x = np.linspace(-5, 5, 100)
y = np.linspace(-5, 5, 100)
X, Y = np.meshgrid(x, y)
Z = np.sin(np.sqrt(X**2 + Y**2))

# 创建3D图形
fig = plt.figure(figsize(12, 10))
ax = fig.add_subplot(111, projection='3d')

# 绘制表面
surf = ax.plot_surface(X, Y, Z, cmap='viridis', alpha=0.7)

# 添加点
point = ax.scatter(0, 0, np.sin(0), color='red', s=100, label='Point')

# 添加颜色条
fig.colorbar(surf, ax=ax, shrink=0.6, aspect=5)

# 设置标题和标签
ax.set_title("3D Surface with Point, Legend and Colorbar - how2matplotlib.com")
ax.set_xlabel('X axis')
ax.set_ylabel('Y axis')
ax.set_zlabel('Z axis')

# 添加图例
ax.legend()

plt.show()
这个例子展示了如何在3D图形中添加颜色条和图例,使图形更加完整和信息丰富。
6. 处理特殊情况
在某些情况下,我们可能需要处理一些特殊的场景,比如在不规则的3D表面上添加点,或者处理多个3D子图。
6.1 在不规则3D表面上添加点
有时,我们可能需要在一个不规则的3D表面上添加点。这种情况下,我们需要确保点的位置正确对应于表面。
import matplotlib.pyplot as plt
from mpl_toolkits.mplot3d import Axes3D
import numpy as np

# 创建不规则的3D数据
theta = np.linspace(0, 2*np.pi, 100)
r = 2 + np.random.rand(100)
x = r * np.cos(theta)
y = r * np.sin(theta)
z = np.sin(np.sqrt(x**2 + y**2))

# 创建3D图形
fig = plt.figure(figsize=(12, 10))
ax = fig.add_subplot(111, projection='3d')

# 绘制不规则表面
ax.plot_trisurf(x, y, z, cmap='viridis', alpha=0.7)

# 添加点
point_x, point_y = 1.5, 1.5
point_z = np.sin(np.sqrt(point_x**2 + point_y**2))
ax.scatter(point_x, point_y, point_z, color='red', s=100)

# 设置标题
ax.set_title("Irregular 3D Surface with Point - how2matplotlib.com")

plt.show()
Output:
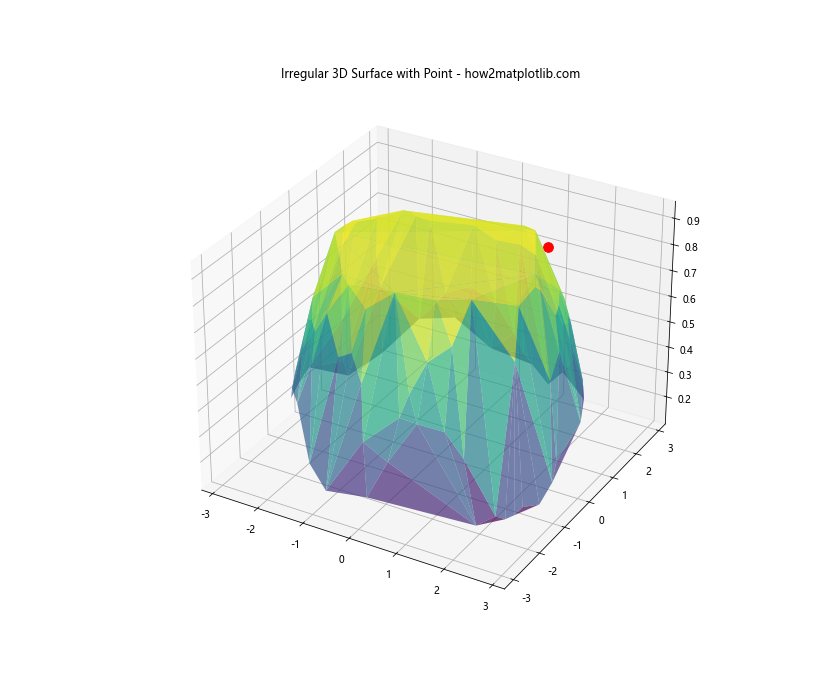
这个例子展示了如何在一个不规则的3D表面上添加点。我们使用plot_trisurf函数来绘制不规则的表面。
6.2 处理多个3D子图
在某些情况下,我们可能需要在一个图形中展示多个3D子图,每个子图上都有自己的表面和点。
import matplotlib.pyplot as plt
from mpl_toolkits.mplot3d import Axes3D
import numpy as np

# 创建数据
x = np.linspace(-5, 5, 50)
y = np.linspace(-5, 5, 50)
X, Y = np.meshgrid(x, y)
Z1 = np.sin(np.sqrt(X**2 + Y**2))
Z2 = np.cos(np.sqrt(X**2 + Y**2))

# 创建图形和子图
fig = plt.figure(figsize=(16, 8))
ax1 = fig.add_subplot(121, projection='3d')
ax2 = fig.add_subplot(122, projection='3d')

# 绘制第一个子图
surf1 = ax1.plot_surface(X, Y, Z1, cmap='viridis', alpha=0.7)
ax1.scatter(0, 0, np.sin(0), color='red', s=100)
ax1.set_title("Sine Surface - how2matplotlib.com")

# 绘制第二个子图
surf2 = ax2.plot_surface(X, Y, Z2, cmap='plasma', alpha=0.7)
ax2.scatter(0, 0, np.cos(0), color='blue', s=100)
ax2.set_title("Cosine Surface - how2matplotlib.com")

plt.tight_layout()
plt.show()
Output:
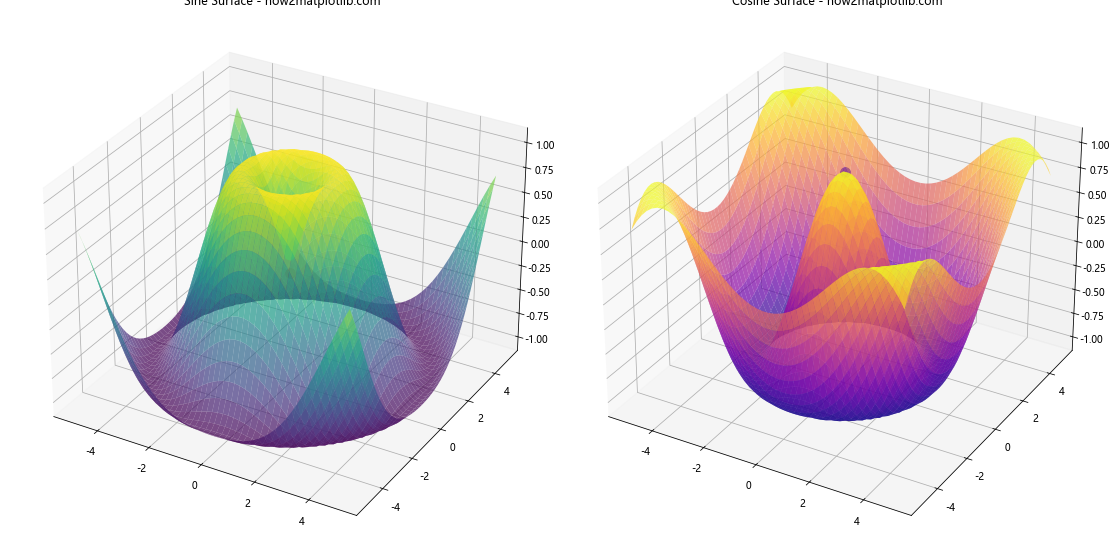
这个例子展示了如何创建两个3D子图,每个子图上都有不同的表面和点。
7. 高级自定义
为了进一步提升我们的3D图形,我们可以添加一些高级的自定义功能。
7.1 自定义颜色映射
我们可以创建自定义的颜色映射来更好地突出表面的特定区域。
import matplotlib.pyplot as plt
from mpl_toolkits.mplot3d import Axes3D
import numpy as np
from matplotlib.colors import LinearSegmentedColormap

# 创建数据
x = np.linspace(-5, 5, 100)
y = np.linspace(-5, 5, 100)
X, Y = np.meshgrid(x, y)
Z = np.sin(np.sqrt(X**2 + Y**2))

# 创建自定义颜色映射
colors = ['darkblue', 'blue', 'lightblue', 'white', 'yellow', 'orange', 'red']
n_bins = 100
cmap = LinearSegmentedColormap.from_list('custom_cmap', colors, N=n_bins)

# 创建3D图形
fig = plt.figure(figsize=(12, 10))
ax = fig.add_subplot(111, projection='3d')

# 绘制表面
surf = ax.plot_surface(X, Y, Z, cmap=cmap, alpha=0.8)

# 添加点
ax.scatter(0, 0, np.sin(0), color='black', s=100)

# 添加颜色条
fig.colorbar(surf, ax=ax, shrink=0.6, aspect=5)

# 设置标题
ax.set_title("3D Surface with Custom Colormap - how2matplotlib.com")

plt.show()
Output:
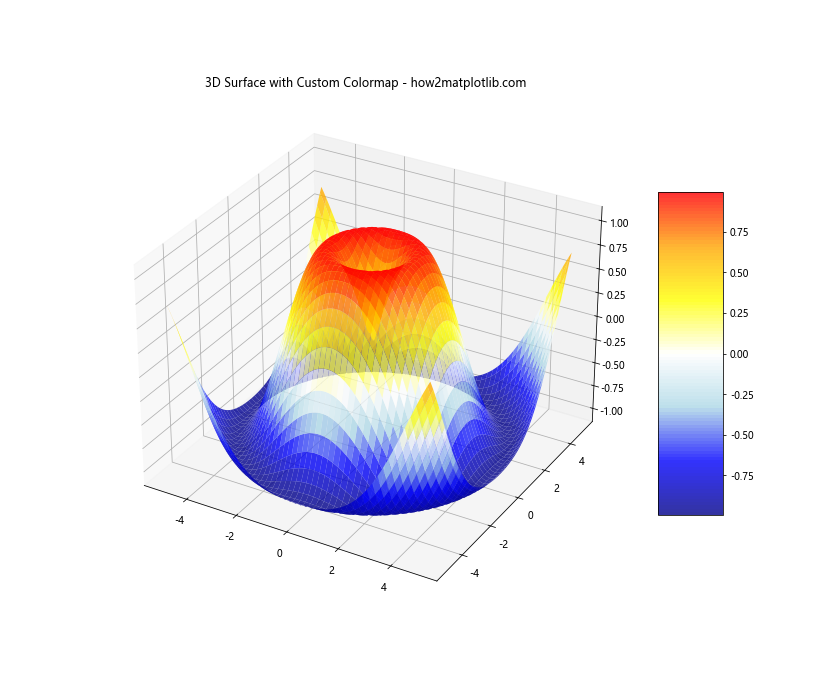
这个例子展示了如何创建和使用自定义的颜色映射,使3D表面的颜色更加丰富和有意义。
7.2 添加投影
我们可以在3D图形中添加投影,以更好地展示点和表面在各个平面上的位置。
import matplotlib.pyplot as plt
from mpl_toolkits.mplot3d import Axes3D
import numpy as np

# 创建数据
x = np.linspace(-5, 5, 50)
y = np.linspace(-5, 5, 50)
X, Y = np.meshgrid(x, y)
Z = np.sin(np.sqrt(X**2 + Y**2))

# 创建3D图形
fig = plt.figure(figsize=(12, 10))
ax = fig.add_subplot(111, projection='3d')

# 绘制表面
surf = ax.plot_surface(X, Y, Z, cmap='viridis', alpha=0.7)

# 添加点
point_x, point_y = 2, 2
point_z = np.sin(np.sqrt(point_x**2 + point_y**2))
ax.scatter(point_x, point_y, point_z, color='red', s=100)

# 添加投影
ax.contourf(X, Y, Z, zdir='z', offset=-1, cmap='viridis', alpha=0.5)
ax.contourf(X, Z, Y, zdir='y', offset=5, cmap='viridis', alpha=0.5)
ax.contourf(Y, Z, X, zdir='x', offset=-5, cmap='viridis', alpha=0.5)

# 设置坐标轴范围
ax.set_xlim(-5, 5)
ax.set_ylim(-5, 5)
ax.set_zlim(-1, 1)

# 设置标题
ax.set_title("3D Surface with Projections - how2matplotlib.com")

plt.show()
Output:
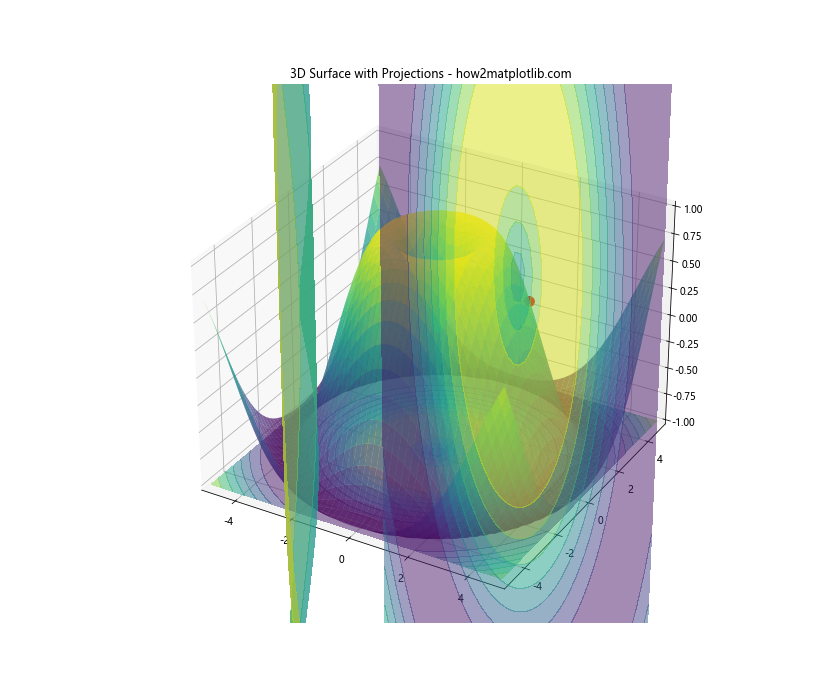
这个例子展示了如何在3D图形中添加投影,使点和表面在各个平面上的位置更加清晰。
8. 性能优化
当处理大量数据点或复杂的3D表面时,性能可能会成为一个问题。以下是一些优化3D图形性能的技巧。
8.1 使用更少的数据点
减少数据点的数量可以显著提高渲染速度,同时保持图形的整体形状。
import matplotlib.pyplot as plt
from mpl_toolkits.mplot3d import Axes3D
import numpy as np

# 创建较少的数据点
x = np.linspace(-5, 5, 30)  # 减少数据点
y = np.linspace(-5, 5, 30)
X, Y = np.meshgrid(x, y)
Z = np.sin(np.sqrt(X**2 + Y**2))

# 创建3D图形
fig = plt.figure(figsize=(12, 10))
ax = fig.add_subplot(111, projection='3d')

# 绘制表面
surf = ax.plot_surface(X, Y, Z, cmap='viridis', alpha=0.7)

# 添加点
ax.scatter(0, 0, np.sin(0), color='red', s=100)

# 设置标题
ax.set_title("Optimized 3D Surface with Fewer Data Points - how2matplotlib.com")

plt.show()
Output:
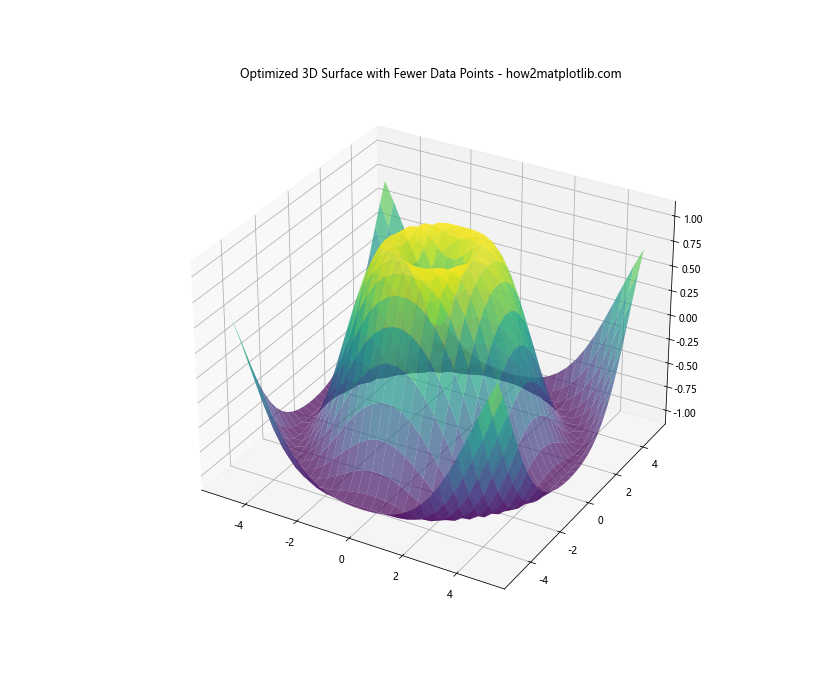
这个例子使用了较少的数据点来创建3D表面,从而提高了渲染速度。
8.2 使用线框图代替表面图
对于非常复杂的表面,使用线框图而不是完整的表面图可以大大提高性能。
import matplotlib.pyplot as plt
from mpl_toolkits.mplot3d import Axes3D
import numpy as np

# 创建数据
x = np.linspace(-5, 5, 50)
y = np.linspace(-5, 5, 50)
X, Y = np.meshgrid(x, y)
Z = np.sin(np.sqrt(X**2 + Y**2))

# 创建3D图形
fig = plt.figure(figsize=(12, 10))
ax = fig.add_subplot(111, projection='3d')

# 绘制线框图
wireframe = ax.plot_wireframe(X, Y, Z, color='blue', alpha=0.5)

# 添加点
ax.scatter(0, 0, np.sin(0), color='red', s=100)

# 设置标题
ax.set_title("3D Wireframe with Point - how2matplotlib.com")

plt.show()
Output:
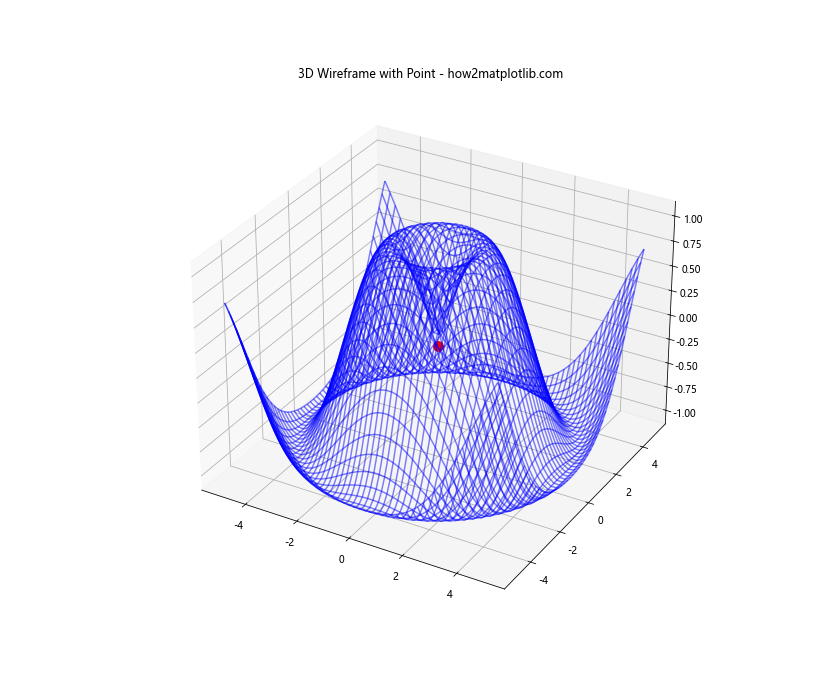
这个例子使用线框图代替了完整的表面图,这在处理大量数据点时特别有用。
9. 结论
在本文中,我们详细探讨了如何在Matplotlib中的3D表面图上绘制单个点。我们从基础知识开始,逐步深入到更高级的技巧和优化方法。通过这些示例,我们不仅学会了如何创建基本的3D表面图和添加点,还掌握了如何优化图形显示、处理特殊情况、添加高级自定义功能,以及提高大数据集的渲染性能。
3D可视化是数据分析和科学计算中的一个强大工具,它能够帮助我们更直观地理解复杂的数据关系。通过在3D表面上添加点,我们可以突出显示特定的数据点或关注区域,使图形更加信息丰富。
记住,创建有效的3D可视化不仅仅是技术问题,还需要考虑数据的本质和你想要传达的信息。选择适当的颜色、视角和附加元素(如标签、图例和颜色条)可以大大提高图形的可读性和信息传达效果。
最后,随着数据集规模的增长,性能优化变得越来越重要。通过减少数据点、使用线框图或其他优化技术,我们可以在保持图形质量的同时提高渲染速度。
 极客教程
极客教程