Matplotlib绘制Pandas数据框多列数据的柱状图教程
参考:Plot Multiple Columns of Pandas Dataframe on Bar Chart with Matplotlib
在数据可视化中,柱状图是一种常用且直观的图表类型,特别适合展示分类数据或时间序列数据。当我们需要同时比较多个变量或类别时,绘制多列数据的柱状图就显得尤为重要。本文将详细介绍如何使用Matplotlib库来绘制Pandas数据框中多列数据的柱状图,包括各种常见的柱状图类型、自定义样式以及一些高级技巧。
1. 基础知识
在开始绘制多列数据的柱状图之前,我们需要先了解一些基础知识。
1.1 Matplotlib简介
Matplotlib是Python中最流行的绘图库之一,它提供了一套类似MATLAB的绘图API,能够轻松创建各种静态、动态和交互式图表。在数据科学和机器学习领域,Matplotlib经常与NumPy和Pandas一起使用,用于数据可视化。
1.2 Pandas简介
Pandas是Python中用于数据分析的核心库,它提供了高性能、易用的数据结构和数据分析工具。Pandas的DataFrame是一种二维标记数据结构,类似于Excel表格,非常适合存储和处理多维数据。
1.3 柱状图基本概念
柱状图使用矩形条来表示数据,矩形的高度与数据值成正比。在多列数据的柱状图中,我们可以并排或堆叠显示多个类别的数据,以便进行比较和分析。
2. 准备数据
在绘制柱状图之前,我们需要准备好数据。通常,我们会使用Pandas DataFrame来存储和管理数据。以下是一个简单的示例,创建一个包含多列数据的DataFrame:
import pandas as pd
import matplotlib.pyplot as plt

# 创建示例数据
data = {
    'Product': ['A', 'B', 'C', 'D'],
    'Sales_2021': [100, 150, 80, 200],
    'Sales_2022': [120, 180, 90, 220],
    'Sales_2023': [140, 200, 110, 250]
}

df = pd.DataFrame(data)
print("Data from how2matplotlib.com:")
print(df)
这个示例创建了一个包含四种产品在2021年、2022年和2023年销售数据的DataFrame。
3. 绘制简单的多列柱状图
让我们从最基本的多列柱状图开始。我们将使用Matplotlib的bar函数来创建并排的柱状图,展示不同年份的销售数据。
import pandas as pd
import matplotlib.pyplot as plt

# 准备数据
data = {
    'Product': ['A', 'B', 'C', 'D'],
    'Sales_2021': [100, 150, 80, 200],
    'Sales_2022': [120, 180, 90, 220],
    'Sales_2023': [140, 200, 110, 250]
}
df = pd.DataFrame(data)

# 设置图形大小
plt.figure(figsize=(12, 6))

# 设置柱的宽度
bar_width = 0.25

# 设置x轴位置
r1 = range(len(df['Product']))
r2 = [x + bar_width for x in r1]
r3 = [x + bar_width for x in r2]

# 绘制柱状图
plt.bar(r1, df['Sales_2021'], color='blue', width=bar_width, label='2021')
plt.bar(r2, df['Sales_2022'], color='green', width=bar_width, label='2022')
plt.bar(r3, df['Sales_2023'], color='red', width=bar_width, label='2023')

# 添加标签和标题
plt.xlabel('Product')
plt.ylabel('Sales')
plt.title('Sales Comparison by Product and Year - how2matplotlib.com')
plt.xticks([r + bar_width for r in range(len(df['Product']))], df['Product'])

# 添加图例
plt.legend()

# 显示图形
plt.tight_layout()
plt.show()
Output:
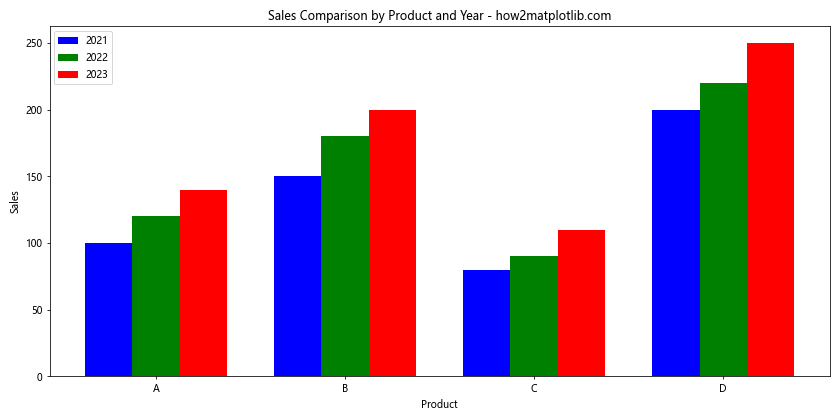
在这个示例中,我们使用plt.bar()函数为每一年的销售数据创建一组柱子。通过调整每组柱子的x轴位置(使用r1、r2和r3),我们可以将不同年份的柱子并排放置。bar_width变量用于控制柱子的宽度,确保它们不会重叠或间隔过大。
4. 自定义柱状图样式
Matplotlib提供了丰富的选项来自定义柱状图的外观。我们可以调整颜色、添加数据标签、更改柱子边框等。以下是一个展示如何自定义柱状图样式的示例:
import pandas as pd
import matplotlib.pyplot as plt

# 准备数据
data = {
    'Product': ['A', 'B', 'C', 'D'],
    'Sales_2021': [100, 150, 80, 200],
    'Sales_2022': [120, 180, 90, 220],
    'Sales_2023': [140, 200, 110, 250]
}
df = pd.DataFrame(data)

# 设置图形大小和样式
plt.figure(figsize=(12, 6))
plt.style.use('seaborn')

# 设置柱的宽度
bar_width = 0.25

# 设置x轴位置
r1 = range(len(df['Product']))
r2 = [x + bar_width for x in r1]
r3 = [x + bar_width for x in r2]

# 绘制柱状图
bars1 = plt.bar(r1, df['Sales_2021'], color='#4C72B0', width=bar_width, label='2021', alpha=0.8, edgecolor='white')
bars2 = plt.bar(r2, df['Sales_2022'], color='#55A868', width=bar_width, label='2022', alpha=0.8, edgecolor='white')
bars3 = plt.bar(r3, df['Sales_2023'], color='#C44E52', width=bar_width, label='2023', alpha=0.8, edgecolor='white')

# 添加数据标签
def add_labels(bars):
    for bar in bars:
        height = bar.get_height()
        plt.text(bar.get_x() + bar.get_width()/2., height,
                 f'{height}', ha='center', va='bottom')

add_labels(bars1)
add_labels(bars2)
add_labels(bars3)

# 添加标签和标题
plt.xlabel('Product', fontweight='bold')
plt.ylabel('Sales', fontweight='bold')
plt.title('Sales Comparison by Product and Year - how2matplotlib.com', fontsize=16, fontweight='bold')
plt.xticks([r + bar_width for r in range(len(df['Product']))], df['Product'])

# 添加图例
plt.legend(loc='upper left', frameon=True)

# 添加网格线
plt.grid(axis='y', linestyle='--', alpha=0.7)

# 显示图形
plt.tight_layout()
plt.show()
在这个示例中,我们使用了以下技巧来美化柱状图:
- 使用
plt.style.use('seaborn')应用了Seaborn样式,使图表更加美观。 - 为柱子设置了自定义颜色和透明度。
- 添加了数据标签,显示每个柱子的具体数值。
- 自定义了字体样式,如加粗和调整大小。
- 添加了网格线,使数据更易读。
5. 堆叠柱状图
堆叠柱状图是另一种展示多列数据的有效方式,特别适合展示部分与整体的关系。以下是创建堆叠柱状图的示例:
import pandas as pd
import matplotlib.pyplot as plt

# 准备数据
data = {
    'Product': ['A', 'B', 'C', 'D'],
    'Sales_2021': [100, 150, 80, 200],
    'Sales_2022': [120, 180, 90, 220],
    'Sales_2023': [140, 200, 110, 250]
}
df = pd.DataFrame(data)

# 设置图形大小
plt.figure(figsize=(12, 6))

# 绘制堆叠柱状图
plt.bar(df['Product'], df['Sales_2021'], label='2021')
plt.bar(df['Product'], df['Sales_2022'], bottom=df['Sales_2021'], label='2022')
plt.bar(df['Product'], df['Sales_2023'], bottom=df['Sales_2021'] + df['Sales_2022'], label='2023')

# 添加标签和标题
plt.xlabel('Product')
plt.ylabel('Total Sales')
plt.title('Stacked Sales by Product and Year - how2matplotlib.com')

# 添加图例
plt.legend()

# 添加数据标签
for i, product in enumerate(df['Product']):
    total = df.loc[i, ['Sales_2021', 'Sales_2022', 'Sales_2023']].sum()
    plt.text(i, total, f'{total}', ha='center', va='bottom')

# 显示图形
plt.tight_layout()
plt.show()
Output:
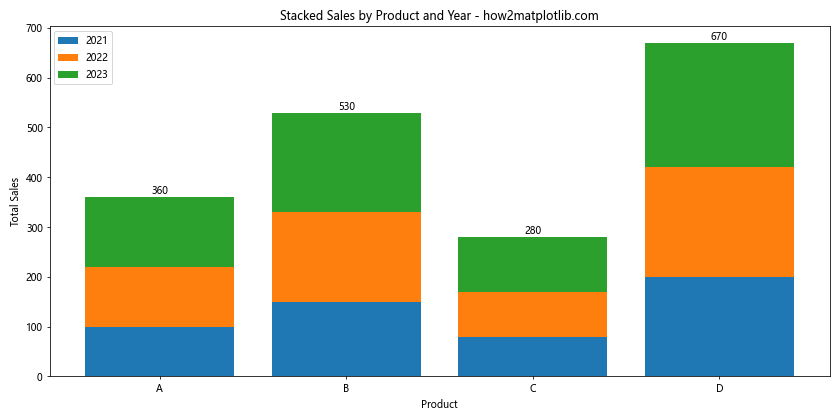
在这个堆叠柱状图中,我们使用bottom参数来指定每一层的起始位置。这样,2022年的销售数据会堆叠在2021年的数据之上,2023年的数据则堆叠在前两年的总和之上。
6. 分组柱状图
分组柱状图是将相关的柱子组合在一起,便于比较不同类别间的差异。以下是创建分组柱状图的示例:
import pandas as pd
import matplotlib.pyplot as plt
import numpy as np

# 准备数据
data = {
    'Product': ['A', 'B', 'C', 'D'],
    'Sales_2021': [100, 150, 80, 200],
    'Sales_2022': [120, 180, 90, 220],
    'Sales_2023': [140, 200, 110, 250]
}
df = pd.DataFrame(data)

# 设置图形大小
plt.figure(figsize=(12, 6))

# 设置x轴位置和宽度
x = np.arange(len(df['Product']))
width = 0.25

# 绘制分组柱状图
plt.bar(x - width, df['Sales_2021'], width, label='2021', color='#4C72B0')
plt.bar(x, df['Sales_2022'], width, label='2022', color='#55A868')
plt.bar(x + width, df['Sales_2023'], width, label='2023', color='#C44E52')

# 添加标签和标题
plt.xlabel('Product')
plt.ylabel('Sales')
plt.title('Grouped Sales by Product and Year - how2matplotlib.com')
plt.xticks(x, df['Product'])

# 添加图例
plt.legend()

# 添加数据标签
for i, v in enumerate(df['Sales_2021']):
    plt.text(i - width, v, str(v), ha='center', va='bottom')
for i, v in enumerate(df['Sales_2022']):
    plt.text(i, v, str(v), ha='center', va='bottom')
for i, v in enumerate(df['Sales_2023']):
    plt.text(i + width, v, str(v), ha='center', va='bottom')

# 显示图形
plt.tight_layout()
plt.show()
Output:
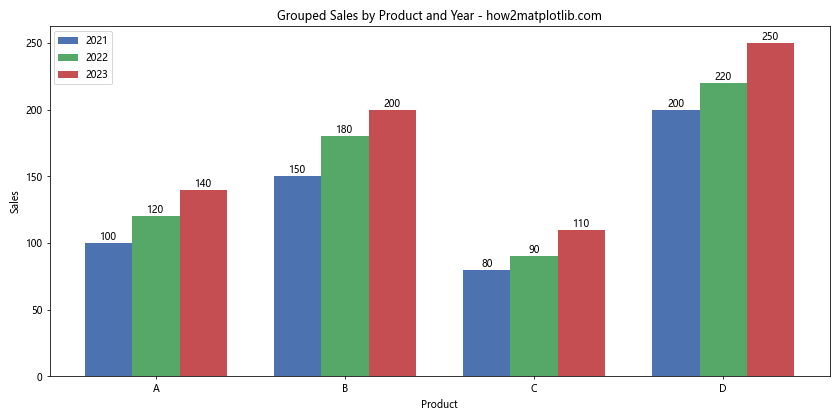
在这个示例中,我们使用numpy.arange()函数来创建均匀间隔的x轴位置,然后通过调整每组柱子的x坐标来创建分组效果。
7. 水平柱状图
有时,水平方向的柱状图可能更适合展示某些类型的数据,特别是当类别名称较长时。以下是创建水平多列柱状图的示例:
import pandas as pd
import matplotlib.pyplot as plt

# 准备数据
data = {
    'Product': ['Product A', 'Product B', 'Product C', 'Product D'],
    'Sales_2021': [100, 150, 80, 200],
    'Sales_2022': [120, 180, 90, 220],
    'Sales_2023': [140, 200, 110, 250]
}
df = pd.DataFrame(data)

# 设置图形大小
plt.figure(figsize=(12, 8))

# 设置柱的高度
bar_height = 0.25

# 设置y轴位置
y1 = range(len(df['Product']))
y2 = [y + bar_height for y in y1]
y3 = [y + bar_height for y in y2]

# 绘制水平柱状图
plt.barh(y1, df['Sales_2021'], height=bar_height, label='2021', color='#4C72B0')
plt.barh(y2, df['Sales_2022'], height=bar_height, label='2022', color='#55A868')
plt.barh(y3, df['Sales_2023'], height=bar_height, label='2023', color='#C44E52')

# 添加标签和标题
plt.ylabel('Product')
plt.xlabel('Sales')
plt.title('Horizontal Sales Comparison - how2matplotlib.com')
plt.yticks([y + bar_height for y in range(len(df['Product']))], df['Product'])

# 添加图例
plt.legend(loc='lower right')

# 添加数据标签
for i, v in enumerate(df['Sales_2021']):
    plt.text(v, i, str(v), va='center')
for i, v in enumerate(df['Sales_2022']):
    plt.text(v, i + bar_height, str(v), va='center')
for i, v in enumerate(df['Sales_2023']):
    plt.text(v, i + 2*bar_height, str(v), va='center')

# 显示图形
plt.tight_layout()
plt.show()
Output:
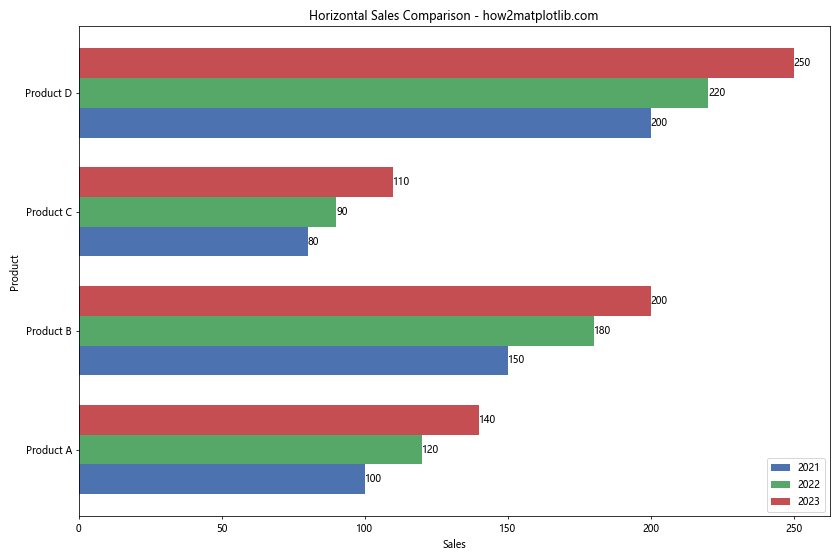
在这个示例中,我们使用plt.barh()函数来创建水平柱状图。通过调整每组柱子的y轴位置,我们可以将不同年份的数据并排显示。这种布局特别适合展示长文本标签的类别数据。
8. 百分比堆叠柱状图
百分比堆叠柱状图可以很好地展示各部分在整体中的占比。以下是创建百分比堆叠柱状图的示例:
import pandas as pd
import matplotlib.pyplot as plt

# 准备数据
data = {
    'Product': ['A', 'B', 'C', 'D'],
    'Sales_2021': [100, 150, 80, 200],
    'Sales_2022': [120, 180, 90, 220],
    'Sales_2023': [140, 200, 110, 250]
}
df = pd.DataFrame(data)

# 计算百分比
df_perc = df[['Sales_2021', 'Sales_2022', 'Sales_2023']].div(df[['Sales_2021', 'Sales_2022', 'Sales_2023']].sum(axis=1), axis=0)

# 设置图形大小
plt.figure(figsize=(12, 6))

# 绘制百分比堆叠柱状图
plt.bar(df['Product'], df_perc['Sales_2021'], label='2021')
plt.bar(df['Product'], df_perc['Sales_2022'], bottom=df_perc['Sales_2021'], label='2022')
plt.bar(df['Product'], df_perc['Sales_2023'], bottom=df_perc['Sales_2021'] + df_perc['Sales_2022'], label='2023')

# 添加标签和标题
plt.xlabel('Product')
plt.ylabel('Percentage')
plt.title('Percentage Sales Distribution by Product and Year - how2matplotlib.com')

# 添加图例
plt.legend(loc='upper right')

# 设置y轴范围和格式
plt.ylim(0, 1)
plt.gca().yaxis.set_major_formatter(plt.FuncFormatter(lambda x, _: '{:.0%}'.format(x)))

# 添加数据标签
for i, product in enumerate(df['Product']):
    for j, col in enumerate(['Sales_2021', 'Sales_2022', 'Sales_2023']):
        height = df_perc.loc[i, col]
        if height > 0.05:  # 只显示大于5%的标签
            plt.text(i, df_perc.loc[i, :col].sum() - height/2, f'{height:.1%}', ha='center', va='center')

# 显示图形
plt.tight_layout()
plt.show()
Output:
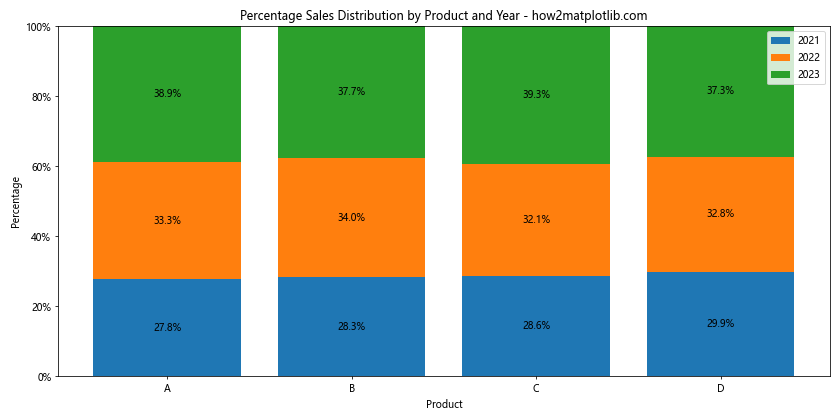
在这个示例中,我们首先计算了每年销售额在总销售额中的占比,然后使用这些百分比数据来创建堆叠柱状图。我们还使用了FuncFormatter来将y轴标签格式化为百分比形式。
9. 双轴柱状图
当需要在同一图表中比较不同量级的数据时,双轴柱状图非常有用。以下是创建双轴柱状图的示例:
import pandas as pd
import matplotlib.pyplot as plt

# 准备数据
data = {
    'Product': ['A', 'B', 'C', 'D'],
    'Sales_2023': [140, 200, 110, 250],
    'Growth_Rate': [0.15, 0.10, 0.22, 0.13]
}
df = pd.DataFrame(data)

# 设置图形大小
fig, ax1 = plt.subplots(figsize=(12, 6))

# 绘制销售额柱状图
ax1.bar(df['Product'], df['Sales_2023'], color='#4C72B0', alpha=0.7, label='Sales 2023')
ax1.set_xlabel('Product')
ax1.set_ylabel('Sales', color='#4C72B0')
ax1.tick_params(axis='y', labelcolor='#4C72B0')

# 创建第二个y轴
ax2 = ax1.twinx()

# 绘制增长率折线图
ax2.plot(df['Product'], df['Growth_Rate'], color='#C44E52', marker='o', linewidth=2, label='Growth Rate')
ax2.set_ylabel('Growth Rate', color='#C44E52')
ax2.tick_params(axis='y', labelcolor='#C44E52')

# 设置y轴格式为百分比
ax2.yaxis.set_major_formatter(plt.FuncFormatter(lambda y, _: '{:.0%}'.format(y)))

# 添加标题
plt.title('Sales and Growth Rate Comparison - how2matplotlib.com', fontsize=16)

# 合并图例
lines1, labels1 = ax1.get_legend_handles_labels()
lines2, labels2 = ax2.get_legend_handles_labels()
ax1.legend(lines1 + lines2, labels1 + labels2, loc='upper left')

# 添加数据标签
for i, v in enumerate(df['Sales_2023']):
    ax1.text(i, v, str(v), ha='center', va='bottom')

for i, v in enumerate(df['Growth_Rate']):
    ax2.text(i, v, f'{v:.1%}', ha='center', va='bottom')

# 显示图形
plt.tight_layout()
plt.show()
Output:
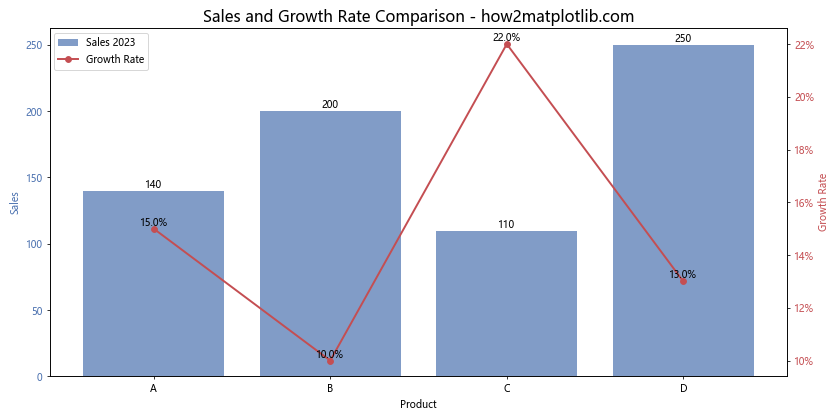
在这个示例中,我们使用twinx()方法创建了一个共享x轴的第二个y轴。左侧y轴显示销售额,用柱状图表示;右侧y轴显示增长率,用折线图表示。这种方式允许我们在同一图表中比较不同单位或量级的数据。
10. 动态柱状图
有时,我们可能需要展示随时间变化的数据。以下是一个创建简单动态柱状图的示例:
import pandas as pd
import matplotlib.pyplot as plt
from matplotlib.animation import FuncAnimation

# 准备数据
data = {
    'Product': ['A', 'B', 'C', 'D'],
    'Sales_2021': [100, 150, 80, 200],
    'Sales_2022': [120, 180, 90, 220],
    'Sales_2023': [140, 200, 110, 250]
}
df = pd.DataFrame(data)

# 设置图形
fig, ax = plt.subplots(figsize=(12, 6))

# 初始化柱状图
bars = ax.bar(df['Product'], df['Sales_2021'])

# 设置坐标轴
ax.set_ylim(0, 300)
ax.set_xlabel('Product')
ax.set_ylabel('Sales')
ax.set_title('Dynamic Sales Chart - how2matplotlib.com')

# 更新函数
def update(frame):
    year = 2021 + frame
    data = df[f'Sales_{year}']
    for bar, height in zip(bars, data):
        bar.set_height(height)
    ax.set_title(f'Sales in {year} - how2matplotlib.com')

    # 更新数据标签
    for bar in bars:
        height = bar.get_height()
        ax.text(bar.get_x() + bar.get_width()/2., height,
                f'{height}', ha='center', va='bottom')

    return bars

# 创建动画
anim = FuncAnimation(fig, update, frames=3, interval=1000, repeat=True)

plt.tight_layout()
plt.show()
Output:
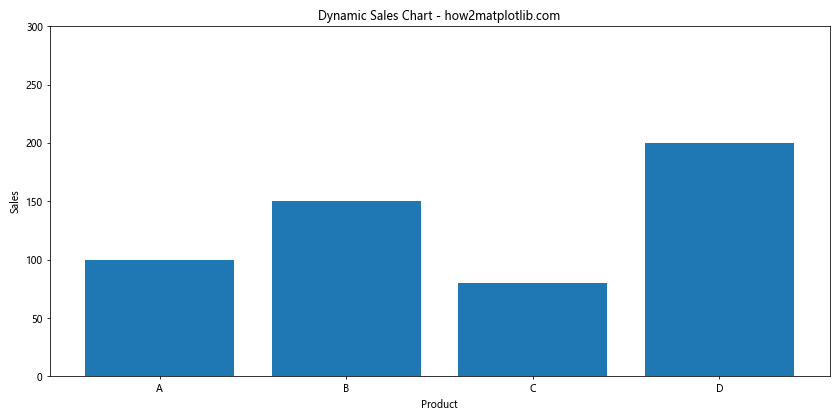
在这个示例中,我们使用matplotlib.animation.FuncAnimation来创建一个动态柱状图,展示2021年到2023年的销售数据变化。动画每隔1秒更新一次,循环显示三年的数据。
11. 分面柱状图
当需要比较多个类别和子类别时,分面柱状图可以提供清晰的视觉比较。以下是创建分面柱状图的示例:
import pandas as pd
import matplotlib.pyplot as plt

# 准备数据
data = {
    'Product': ['A', 'B', 'C', 'D'] * 3,
    'Category': ['Electronics', 'Electronics', 'Electronics', 'Electronics',
                 'Clothing', 'Clothing', 'Clothing', 'Clothing',
                 'Food', 'Food', 'Food', 'Food'],
    'Sales_2021': [100, 150, 80, 200, 120, 90, 110, 130, 80, 70, 60, 100],
    'Sales_2022': [120, 180, 90, 220, 130, 100, 120, 140, 85, 75, 65, 110],
    'Sales_2023': [140, 200, 110, 250, 140, 110, 130, 150, 90, 80, 70, 120]
}
df = pd.DataFrame(data)

# 设置图形
fig, axes = plt.subplots(1, 3, figsize=(18, 6), sharey=True)
fig.suptitle('Sales by Category and Product - how2matplotlib.com', fontsize=16)

# 绘制分面柱状图
categories = df['Category'].unique()
for i, year in enumerate(['Sales_2021', 'Sales_2022', 'Sales_2023']):
    for j, category in enumerate(categories):
        category_data = df[df['Category'] == category]
        axes[i].bar(category_data['Product'], category_data[year], label=category)

    axes[i].set_title(f'Sales in {year[-4:]}')
    axes[i].set_xlabel('Product')
    if i == 0:
        axes[i].set_ylabel('Sales')
    axes[i].legend()

# 调整布局
plt.tight_layout()
plt.show()
Output:
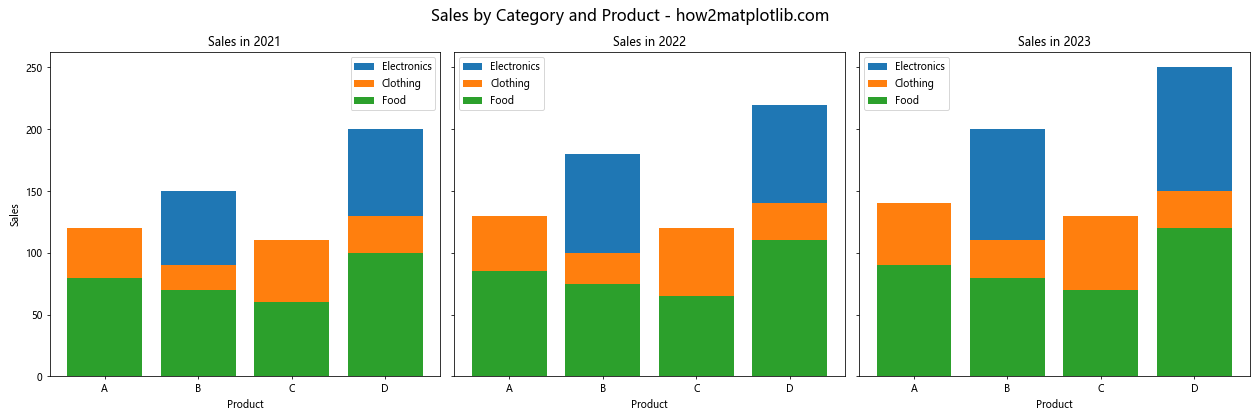
在这个示例中,我们创建了三个子图,每个子图代表一年的销售数据。在每个子图中,我们按产品类别绘制了柱状图,使用不同的颜色来区分类别。这种布局允许我们同时比较不同年份、不同类别和不同产品的销售情况。
12. 误差棒柱状图
当我们需要显示数据的不确定性或变异性时,误差棒柱状图非常有用。以下是创建带有误差棒的柱状图的示例:
import pandas as pd
import matplotlib.pyplot as plt
import numpy as np

# 准备数据
data = {
    'Product': ['A', 'B', 'C', 'D'],
    'Sales_2023': [140, 200, 110, 250],
    'Error': [10, 15, 8, 20]
}
df = pd.DataFrame(data)

# 设置图形大小
plt.figure(figsize=(12, 6))

# 绘制带误差棒的柱状图
plt.bar(df['Product'], df['Sales_2023'], yerr=df['Error'], capsize=5,
        color='#4C72B0', alpha=0.7, ecolor='black', label='Sales 2023')

# 添加标签和标题
plt.xlabel('Product')
plt.ylabel('Sales')
plt.title('Sales in 2023 with Error Bars - how2matplotlib.com')

# 添加数据标签
for i, v in enumerate(df['Sales_2023']):
    plt.text(i, v + df['Error'][i], f'{v}±{df["Error"][i]}', ha='center', va='bottom')

# 添加图例
plt.legend()

# 显示图形
plt.tight_layout()
plt.show()
Output:
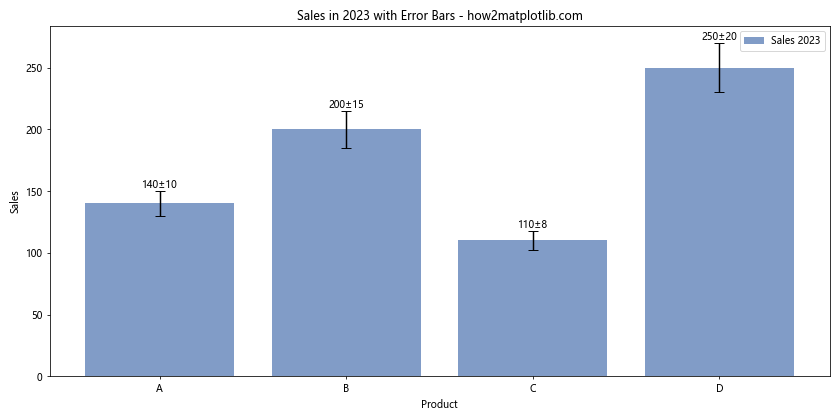
在这个示例中,我们使用yerr参数来添加误差棒,capsize参数控制误差棒顶端横线的长度。误差棒显示了每个数据点的不确定性范围。
13. 组合图表
有时,我们可能需要在同一图表中组合不同类型的图表,以便更全面地展示数据。以下是创建柱状图和折线图组合的示例:
import pandas as pd
import matplotlib.pyplot as plt

# 准备数据
data = {
    'Product': ['A', 'B', 'C', 'D'],
    'Sales_2023': [140, 200, 110, 250],
    'Market_Share': [0.20, 0.35, 0.15, 0.30]
}
df = pd.DataFrame(data)

# 设置图形大小
fig, ax1 = plt.subplots(figsize=(12, 6))

# 绘制柱状图
bars = ax1.bar(df['Product'], df['Sales_2023'], color='#4C72B0', alpha=0.7, label='Sales 2023')
ax1.set_xlabel('Product')
ax1.set_ylabel('Sales', color='#4C72B0')
ax1.tick_params(axis='y', labelcolor='#4C72B0')

# 创建第二个y轴
ax2 = ax1.twinx()

# 绘制折线图
line = ax2.plot(df['Product'], df['Market_Share'], color='#C44E52', marker='o', linewidth=2, label='Market Share')
ax2.set_ylabel('Market Share', color='#C44E52')
ax2.tick_params(axis='y', labelcolor='#C44E52')

# 设置y轴格式为百分比
ax2.yaxis.set_major_formatter(plt.FuncFormatter(lambda y, _: '{:.0%}'.format(y)))

# 添加标题
plt.title('Sales and Market Share Comparison - how2matplotlib.com', fontsize=16)

# 合并图例
lines1, labels1 = ax1.get_legend_handles_labels()
lines2, labels2 = ax2.get_legend_handles_labels()
ax1.legend(lines1 + lines2, labels1 + labels2, loc='upper left')

# 添加数据标签
for bar in bars:
    height = bar.get_height()
    ax1.text(bar.get_x() + bar.get_width()/2., height,
             f'{height}', ha='center', va='bottom')

for i, v in enumerate(df['Market_Share']):
    ax2.text(i, v, f'{v:.1%}', ha='center', va='bottom')

# 显示图形
plt.tight_layout()
plt.show()
Output:
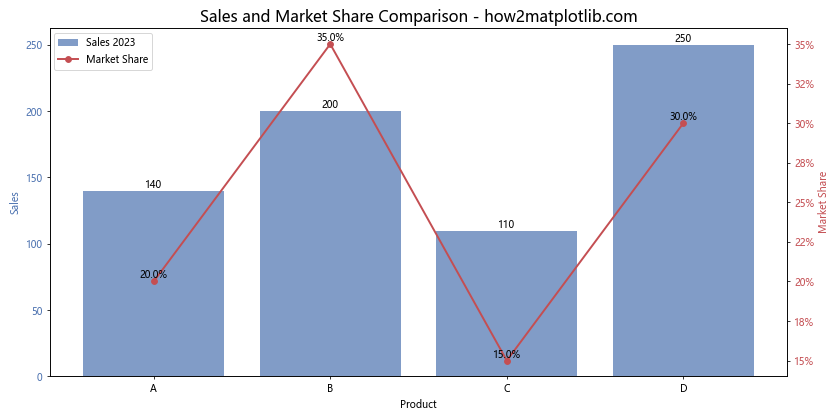
这个示例展示了如何在同一图表中结合柱状图和折线图。柱状图表示销售额,而折线图表示市场份额。这种组合可以帮助我们同时观察两个相关但不同单位的指标。
14. 3D柱状图
对于某些数据集,3D柱状图可以提供更直观的视觉效果。以下是创建3D柱状图的示例:
import pandas as pd
import matplotlib.pyplot as plt
import numpy as np
from mpl_toolkits.mplot3d import Axes3D

# 准备数据
data = {
    'Product': ['A', 'B', 'C', 'D'],
    'Sales_2021': [100, 150, 80, 200],
    'Sales_2022': [120, 180, 90, 220],
    'Sales_2023': [140, 200, 110, 250]
}
df = pd.DataFrame(data)

# 设置图形
fig = plt.figure(figsize=(12, 8))
ax = fig.add_subplot(111, projection='3d')

# 设置x, y坐标
x = np.arange(len(df['Product']))
y = np.arange(3)
X, Y = np.meshgrid(x, y)

# 准备z数据
Z = df[['Sales_2021', 'Sales_2022', 'Sales_2023']].values.T

# 绘制3D柱状图
dx = dy = 0.5
dz = Z
colors = ['#4C72B0', '#55A868', '#C44E52']

for i in range(3):
    ax.bar3d(X[i], Y[i], np.zeros_like(dz[i]), dx, dy, dz[i], color=colors[i], alpha=0.8)

# 设置坐标轴标签
ax.set_xticks(x)
ax.set_xticklabels(df['Product'])
ax.set_yticks(y)
ax.set_yticklabels(['2021', '2022', '2023'])
ax.set_xlabel('Product')
ax.set_ylabel('Year')
ax.set_zlabel('Sales')

# 添加标题
plt.title('3D Sales Comparison - how2matplotlib.com', fontsize=16)

# 调整视角
ax.view_init(elev=20, azim=45)

# 显示图形
plt.tight_layout()
plt.show()
Output:
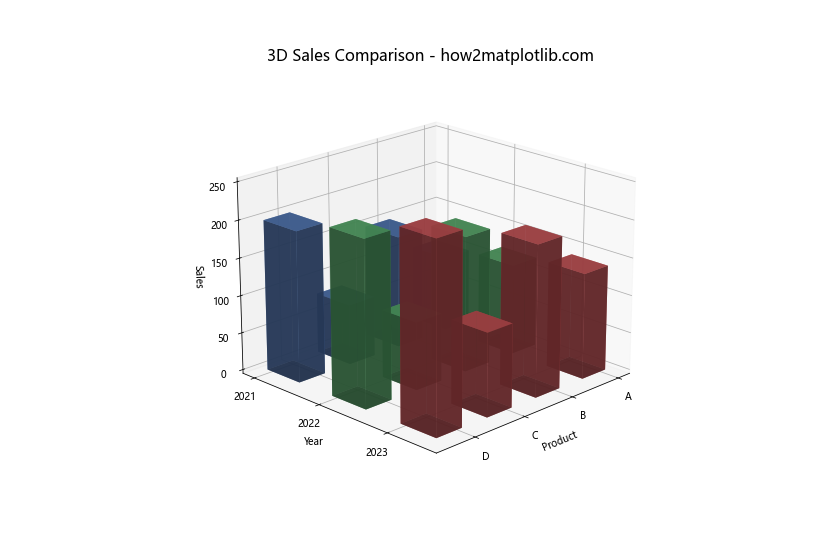
这个3D柱状图允许我们同时比较不同产品在不同年份的销售情况。通过调整视角(使用view_init函数),我们可以从不同角度观察数据。
15. 极坐标柱状图
极坐标柱状图可以用于展示周期性数据或比较不同类别的数据。以下是创建极坐标柱状图的示例:
import pandas as pd
import matplotlib.pyplot as plt
import numpy as np

# 准备数据
data = {
    'Product': ['A', 'B', 'C', 'D', 'E', 'F', 'G', 'H'],
    'Sales': [140, 200, 110, 250, 180, 220, 190, 170]
}
df = pd.DataFrame(data)

# 设置图形
fig = plt.figure(figsize=(10, 10))
ax = fig.add_subplot(111, projection='polar')

# 计算角度和绘制极坐标柱状图
theta = np.linspace(0, 2*np.pi, len(df), endpoint=False)
radii = df['Sales']
width = 2*np.pi / len(df)
bars = ax.bar(theta, radii, width=width, bottom=0.0)

# 自定义颜色
colors = plt.cm.viridis(radii / max(radii))
for bar, color in zip(bars, colors):
    bar.set_facecolor(color)
    bar.set_alpha(0.8)

# 设置刻度标签
ax.set_xticks(theta)
ax.set_xticklabels(df['Product'])

# 添加标题
plt.title('Sales Distribution in Polar Coordinates - how2matplotlib.com', y=1.1)

# 添加数据标签
for angle, radius in zip(theta, radii):
    ax.text(angle, radius, f'{radius}', ha='center', va='center')

# 显示图形
plt.tight_layout()
plt.show()
Output:
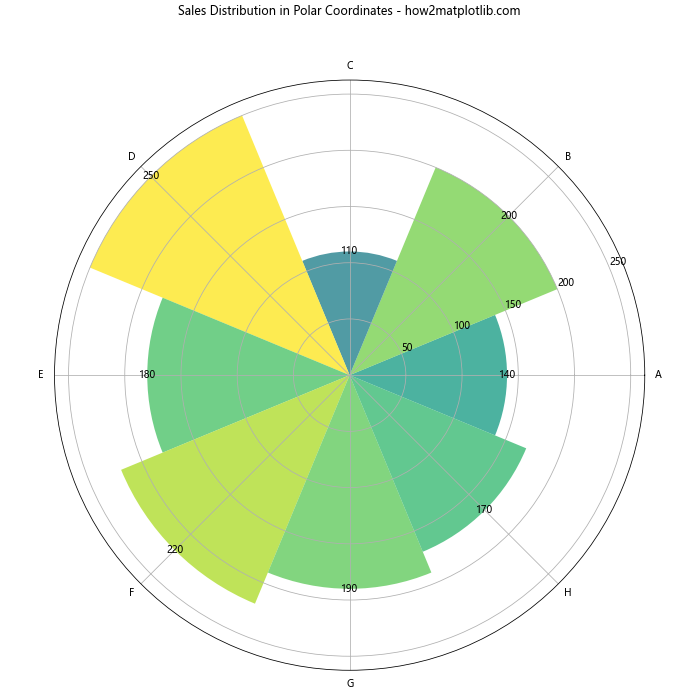
这个极坐标柱状图将每个产品的销售数据表示为一个扇形区域。颜色的深浅表示销售额的大小,使得数据比较更加直观。
16. 瀑布图
瀑布图是一种特殊类型的柱状图,用于显示一系列正值和负值如何累积到最终总和。以下是创建瀑布图的示例:
import pandas as pd
import matplotlib.pyplot as plt

# 准备数据
data = {
    'Item': ['Start', 'Income', 'Expenses', 'Taxes', 'End'],
    'Amount': [1000, 500, -300, -100, 1100]
}
df = pd.DataFrame(data)

# 计算累计和
df['Cumulative'] = df['Amount'].cumsum()

# 设置图形大小
plt.figure(figsize=(12, 6))

# 绘制瀑布图
for i, row in df.iterrows():
    if i == 0 or i == len(df) - 1:
        plt.bar(row['Item'], row['Cumulative'], bottom=0, color='#4C72B0', alpha=0.8)
    else:
        plt.bar(row['Item'], row['Amount'], bottom=df.loc[i-1, 'Cumulative'],
                color='#55A868' if row['Amount'] > 0 else '#C44E52', alpha=0.8)

# 添加连接线
plt.plot(df['Item'], df['Cumulative'], color='black', linewidth=0.5)

# 添加标签和标题
plt.xlabel('Item')
plt.ylabel('Amount')
plt.title('Financial Waterfall Chart - how2matplotlib.com')

# 添加数据标签
for i, row in df.iterrows():
    if i == 0 or i == len(df) - 1:
        plt.text(i, row['Cumulative'], f'{row["Cumulative"]}', ha='center', va='bottom')
    else:
        plt.text(i, row['Cumulative'], f'{row["Amount"]}', ha='center', va='bottom' if row['Amount'] > 0 else 'top')

# 显示图形
plt.tight_layout()
plt.show()
Output:
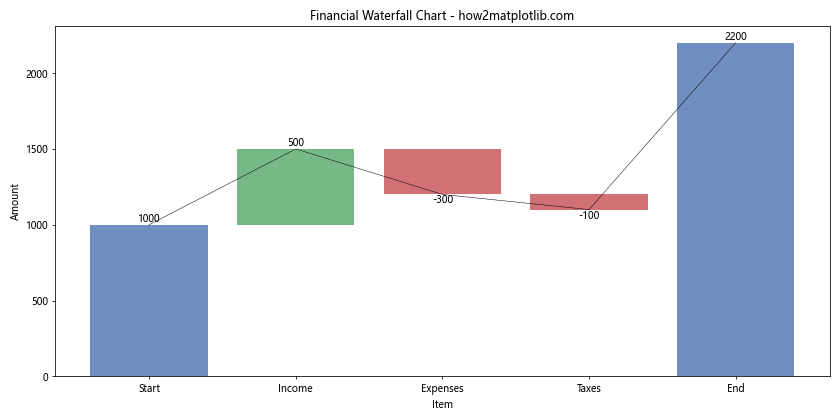
这个瀑布图展示了从起始金额开始,经过收入、支出和税收后的最终金额变化。正值用绿色表示,负值用红色表示,起始和结束值用蓝色表示。
17. 堆叠面积图
堆叠面积图是柱状图的一种变体,它可以很好地展示整体趋势以及各部分的相对贡献。以下是创建堆叠面积图的示例:
import pandas as pd
import matplotlib.pyplot as plt

# 准备数据
data = {
    'Year': [2019, 2020, 2021, 2022, 2023],
    'Product A': [100, 120, 140, 160, 180],
    'Product B': [80, 100, 110, 130, 150],
    'Product C': [60, 70, 90, 100, 120]
}
df = pd.DataFrame(data)

# 设置图形大小
plt.figure(figsize=(12, 6))

# 绘制堆叠面积图
plt.stackplot(df['Year'], df['Product A'], df['Product B'], df['Product C'],
              labels=['Product A', 'Product B', 'Product C'],
              colors=['#4C72B0', '#55A868', '#C44E52'], alpha=0.8)

# 添加标签和标题
plt.xlabel('Year')
plt.ylabel('Sales')
plt.title('Sales Trend by Product - how2matplotlib.com')

# 添加图例
plt.legend(loc='upper left')

# 添加网格线
plt.grid(True, linestyle='--', alpha=0.7)

# 显示图形
plt.tight_layout()
plt.show()
Output:
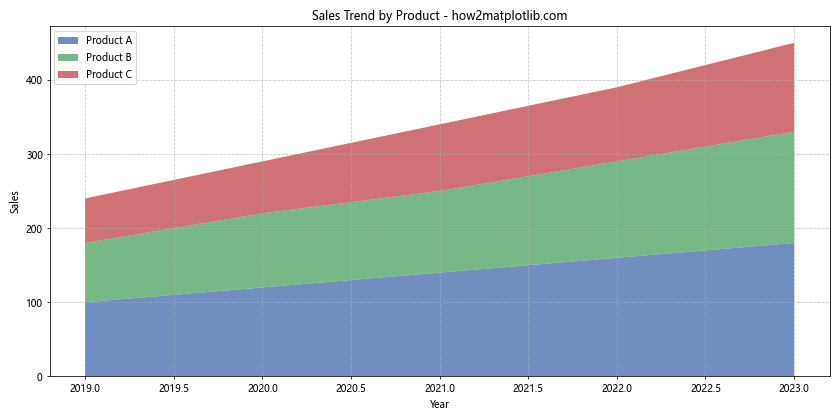
这个堆叠面积图展示了三种产品在五年间的销售趋势。每种颜色代表一种产品,面积的高度表示销售额。这种图表可以清楚地显示总体销售趋势以及每种产品的相对贡献。
结论
本文详细介绍了如何使用Matplotlib绘制Pandas数据框中多列数据的柱状图,涵盖了从基础的并排柱状图到高级的3D和极坐标柱状图等多种类型。我们还探讨了如何自定义图表样式、添加数据标签、处理多轴图表等技巧。这些技能对于数据分析和可视化至关重要,可以帮助我们更好地理解和展示复杂的数据集。
在实际应用中,选择合适的图表类型和样式对于有效传达数据信息至关重要。根据数据的特性和你想要强调的方面,可以灵活运用这些技巧来创建最适合你需求的可视化效果。记住,好的数据可视化不仅要准确呈现数据,还要让观众能够轻松理解和解释数据。
通过掌握这些Matplotlib和Pandas的高级技巧,你将能够创建更加丰富、专业的数据可视化,为你的数据分析工作增添价值。继续练习和探索,你会发现还有更多令人兴奋的可视化方法等待你去发现和应用。
 极客教程
极客教程