Matplotlib.pyplot.semilogy()函数:绘制半对数图的强大工具
参考:matplotlib.pyplot.semilogy() function in Python
Matplotlib是Python中最流行的数据可视化库之一,它提供了丰富的绘图功能。在众多函数中,matplotlib.pyplot.semilogy()是一个非常有用的工具,专门用于绘制半对数图(semi-logarithmic plot)。本文将深入探讨这个函数的用法、特点和应用场景,帮助读者充分掌握这一强大的可视化工具。
1. 什么是半对数图?
在开始介绍semilogy()函数之前,我们需要先了解什么是半对数图。半对数图是一种特殊的二维图表,其中一个轴(通常是y轴)使用对数刻度,而另一个轴(通常是x轴)使用线性刻度。这种图表在处理跨越多个数量级的数据时特别有用,因为它可以在一个图表中同时显示大小差异很大的数值。
半对数图在科学、工程和金融等领域广泛应用,特别适合展示指数增长或衰减的数据,如人口增长、放射性衰变、声音强度等。
2. semilogy()函数的基本用法
matplotlib.pyplot.semilogy()函数是Matplotlib库中专门用于创建y轴为对数刻度的半对数图的函数。它的基本语法如下:
import matplotlib.pyplot as plt
import numpy as np

x = np.linspace(0, 10, 100)
y = np.exp(x)

plt.semilogy(x, y)
plt.title('How2matplotlib.com - Basic Semilogy Plot')
plt.xlabel('X-axis (Linear)')
plt.ylabel('Y-axis (Log)')
plt.show()
Output:
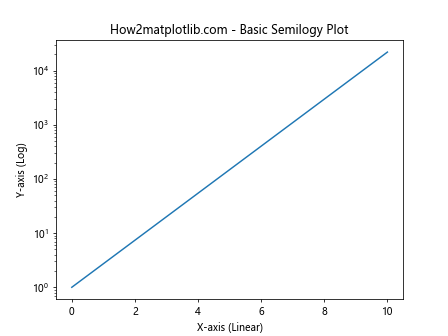
在这个例子中,我们创建了一个简单的半对数图。x轴是线性的,范围从0到10,而y轴是对数刻度的,显示了e^x的值。这个图清晰地展示了指数函数的快速增长特性。
3. 自定义semilogy()图表
semilogy()函数提供了多种自定义选项,让我们能够根据需求调整图表的外观。以下是一些常用的自定义方法:
3.1 设置线条样式和颜色
import matplotlib.pyplot as plt
import numpy as np

x = np.linspace(0, 5, 100)
y1 = np.exp(x)
y2 = np.exp(x/2)

plt.semilogy(x, y1, 'r--', label='how2matplotlib.com - exp(x)')
plt.semilogy(x, y2, 'b-.', label='how2matplotlib.com - exp(x/2)')
plt.legend()
plt.title('Custom Line Styles in Semilogy Plot')
plt.xlabel('X-axis')
plt.ylabel('Y-axis (Log)')
plt.show()
Output:
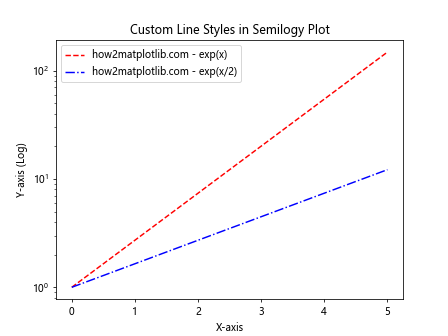
在这个例子中,我们绘制了两条曲线,分别使用红色虚线和蓝色点划线。通过设置不同的线条样式和颜色,我们可以轻松区分不同的数据系列。
3.2 添加网格线
import matplotlib.pyplot as plt
import numpy as np

x = np.linspace(0, 5, 100)
y = np.exp(x)

plt.semilogy(x, y)
plt.grid(True, which="both", ls="-", color='0.65')
plt.title('How2matplotlib.com - Semilogy Plot with Grid')
plt.xlabel('X-axis')
plt.ylabel('Y-axis (Log)')
plt.show()
Output:

这个例子展示了如何在半对数图中添加网格线。网格线可以帮助读者更准确地读取数据点的值。
3.3 设置y轴的范围
import matplotlib.pyplot as plt
import numpy as np

x = np.linspace(0, 5, 100)
y = np.exp(x)

plt.semilogy(x, y)
plt.ylim(1, 1000)
plt.title('How2matplotlib.com - Semilogy Plot with Y-axis Limits')
plt.xlabel('X-axis')
plt.ylabel('Y-axis (Log)')
plt.show()
Output:
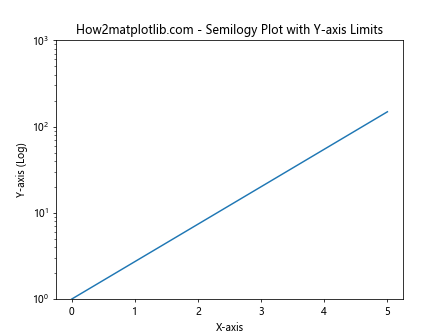
通过使用plt.ylim()函数,我们可以设置y轴的显示范围。这在需要关注特定范围的数据时非常有用。
4. 多数据系列的比较
semilogy()函数非常适合比较多个数据系列,特别是当这些数据系列的值跨越多个数量级时。
import matplotlib.pyplot as plt
import numpy as np

x = np.linspace(0, 10, 100)
y1 = np.exp(x)
y2 = x**2
y3 = x

plt.semilogy(x, y1, label='how2matplotlib.com - exp(x)')
plt.semilogy(x, y2, label='how2matplotlib.com - x^2')
plt.semilogy(x, y3, label='how2matplotlib.com - x')
plt.legend()
plt.title('Comparison of Different Growth Rates')
plt.xlabel('X-axis')
plt.ylabel('Y-axis (Log)')
plt.show()
Output:
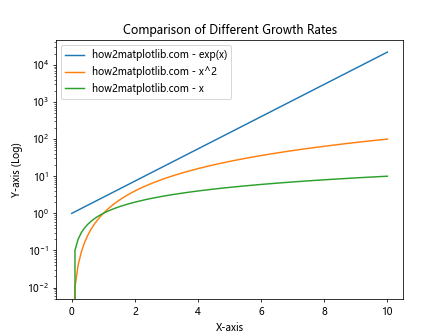
这个例子比较了指数增长、平方增长和线性增长。通过使用对数刻度的y轴,我们可以在同一个图表中清晰地看到这三种不同增长率的差异。
5. 处理负值和零值
在使用semilogy()函数时,需要特别注意处理负值和零值。由于对数函数在零和负数处没有定义,所以这些值会导致警告或错误。
5.1 处理零值
import matplotlib.pyplot as plt
import numpy as np

x = np.linspace(0, 5, 100)
y = np.exp(x) - 1  # 这会产生一些接近零的值

plt.semilogy(x, y)
plt.title('How2matplotlib.com - Handling Near-Zero Values')
plt.xlabel('X-axis')
plt.ylabel('Y-axis (Log)')
plt.show()
Output:
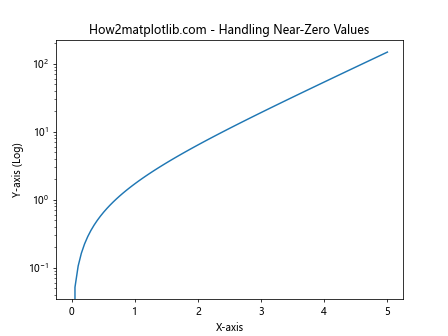
在这个例子中,我们生成了一些接近零的值。Matplotlib会自动处理这些值,但可能会显示一些警告信息。
5.2 使用掩码处理负值
import matplotlib.pyplot as plt
import numpy as np

x = np.linspace(-5, 5, 100)
y = x**2 - 10

mask = y > 0
plt.semilogy(x[mask], y[mask])
plt.title('How2matplotlib.com - Masking Negative Values')
plt.xlabel('X-axis')
plt.ylabel('Y-axis (Log)')
plt.show()
Output:
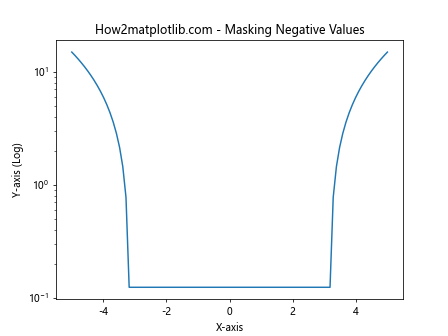
这个例子展示了如何使用掩码来处理负值。我们只绘制y值大于零的点,从而避免了负值的问题。
6. 结合其他Matplotlib功能
semilogy()函数可以与Matplotlib的其他功能结合使用,创建更复杂和信息丰富的图表。
6.1 添加次坐标轴
import matplotlib.pyplot as plt
import numpy as np

fig, ax1 = plt.subplots()

x = np.linspace(0, 5, 100)
y1 = np.exp(x)
y2 = x**2

ax1.semilogy(x, y1, 'b-', label='how2matplotlib.com - exp(x)')
ax1.set_xlabel('X-axis')
ax1.set_ylabel('Y-axis (Log)', color='b')
ax1.tick_params(axis='y', labelcolor='b')

ax2 = ax1.twinx()
ax2.plot(x, y2, 'r-', label='how2matplotlib.com - x^2')
ax2.set_ylabel('Secondary Y-axis', color='r')
ax2.tick_params(axis='y', labelcolor='r')

plt.title('Semilogy with Secondary Y-axis')
fig.tight_layout()
plt.show()
Output:
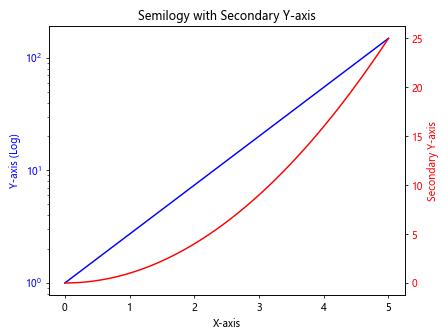
这个例子展示了如何在半对数图中添加一个线性刻度的次坐标轴。这种方法可以在同一个图表中比较不同类型的数据。
6.2 创建子图
import matplotlib.pyplot as plt
import numpy as np

x = np.linspace(0, 5, 100)
y1 = np.exp(x)
y2 = x**2

fig, (ax1, ax2) = plt.subplots(1, 2, figsize=(12, 5))

ax1.semilogy(x, y1)
ax1.set_title('How2matplotlib.com - Exponential Growth')
ax1.set_xlabel('X-axis')
ax1.set_ylabel('Y-axis (Log)')

ax2.plot(x, y2)
ax2.set_title('How2matplotlib.com - Quadratic Growth')
ax2.set_xlabel('X-axis')
ax2.set_ylabel('Y-axis')

plt.tight_layout()
plt.show()
Output:
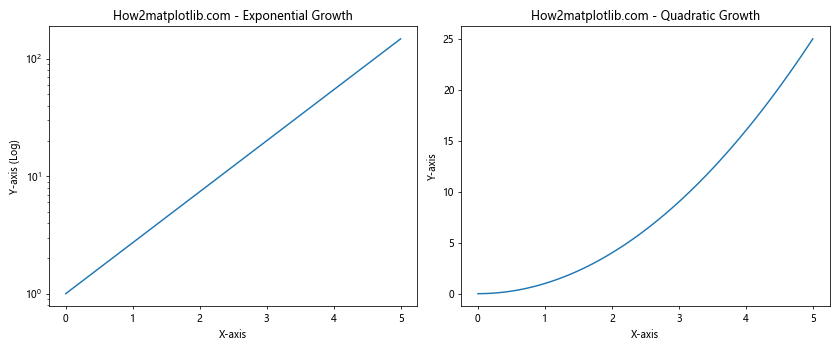
这个例子展示了如何创建包含半对数图和普通线性图的子图。这种方法可以帮助我们在同一个图形中比较不同类型的数据可视化。
7. 实际应用场景
semilogy()函数在许多实际应用场景中都非常有用。以下是一些常见的应用例子:
7.1 人口增长模型
import matplotlib.pyplot as plt
import numpy as np

years = np.arange(1900, 2100, 10)
population = 1.6 * (1.02 ** (years - 1900))  # 简化的人口增长模型

plt.semilogy(years, population, 'go-')
plt.title('How2matplotlib.com - World Population Growth Model')
plt.xlabel('Year')
plt.ylabel('Population (Log Scale)')
plt.grid(True)
plt.show()
Output:
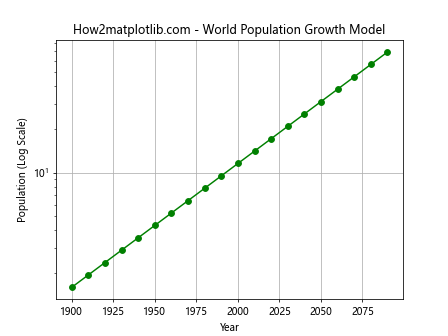
这个例子展示了一个简化的世界人口增长模型。使用半对数图可以清晰地展示人口的指数增长趋势。
7.2 声音强度级别
import matplotlib.pyplot as plt
import numpy as np

intensity = np.logspace(-12, 2, 15)
decibels = 10 * np.log10(intensity / 1e-12)

plt.semilogy(decibels, intensity, 'bo-')
plt.title('How2matplotlib.com - Sound Intensity Levels')
plt.xlabel('Sound Intensity Level (dB)')
plt.ylabel('Sound Intensity (W/m²)')
plt.grid(True)
plt.show()
Output:
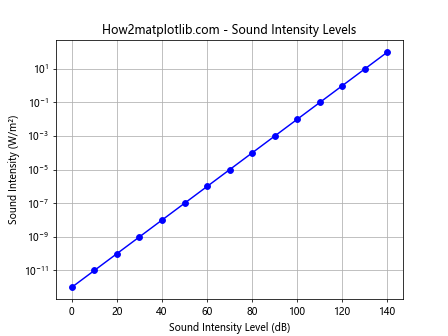
这个例子展示了声音强度和分贝之间的关系。使用半对数图可以直观地展示声音强度跨越多个数量级的变化。
7.3 放射性衰变
import matplotlib.pyplot as plt
import numpy as np

time = np.linspace(0, 5, 100)
initial_amount = 1000
half_life = 1
amount = initial_amount * 0.5 ** (time / half_life)

plt.semilogy(time, amount)
plt.title('How2matplotlib.com - Radioactive Decay')
plt.xlabel('Time (half-lives)')
plt.ylabel('Amount Remaining (Log Scale)')
plt.grid(True)
plt.show()
Output:
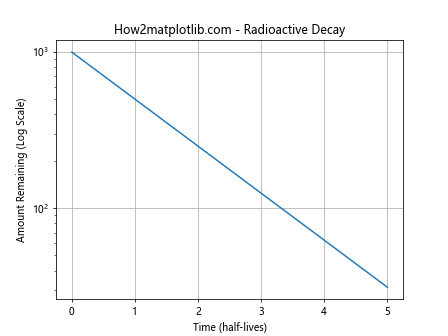
这个例子模拟了放射性物质的衰变过程。半对数图能够清晰地展示指数衰减的特性。
8. 高级技巧和注意事项
在使用semilogy()函数时,还有一些高级技巧和注意事项值得关注:
8.1 自定义刻度
import matplotlib.pyplot as plt
import numpy as np

x = np.linspace(0, 5, 100)
y = np.exp(x)

plt.semilogy(x, y)
plt.title('How2matplotlib.com - Custom Ticks in Semilogy Plot')
plt.xlabel('X-axis')
plt.ylabel('Y-axis (Log)')

plt.yticks([1, 10, 100, 1000], ['1', '10', '100', '1000'])
plt.show()
Output:
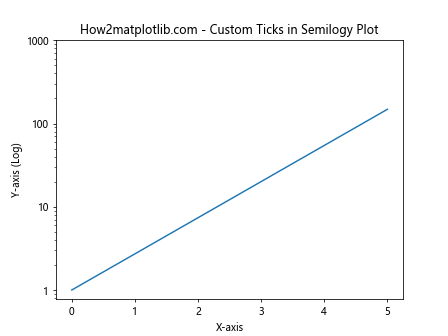
这个例子展示了如何自定义y轴的刻度标签。这在需要特定格式的刻度标签时非常有用。
8.2 处理大范围数据
import matplotlib.pyplot as plt
import numpy as np

x = np.linspace(0, 10, 100)
y = np.exp(x) * 1e-6  # 非常小的值

plt.semilogy(x, y)
plt.title('How2matplotlib.com - Handling Very Small Values')
plt.xlabel('X-axis')
plt.ylabel('Y-axis (Log)')
plt.gca().yaxis.set_major_formatter(plt.FuncFormatter(lambda x, p: f'{x:.0e}'))
plt.show()
Output:
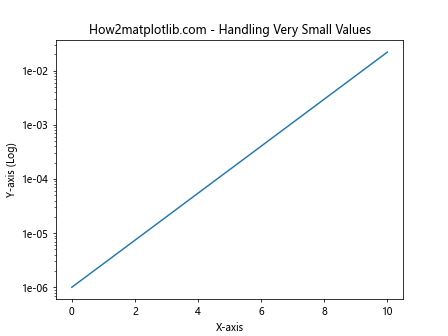
这个例子展示了如何处理非常小的值。我们使用科学记数法来表示y轴的刻度,使图表更易读。
8.3 结合填充区域
import matplotlib.pyplot as plt
import numpy as np

x = np.linspace(0, 5, 100)
y1 = np.exp(x)
y2 = np.exp(x/2)

plt.semilogy(x, y1, 'b-', label='how2matplotlib.com - exp(x)')
plt.semilogy(x, y2, 'r-', label='how2matplotlib.com - exp(x/2)')
plt.fill_between(x, y1, y2, alpha=0.3)
plt.legend()
plt.title('Semilogy Plot with Filled Area')
plt.xlabel('X-axis')
plt.ylabel('Y-axis (Log)')
plt.show()
Output:
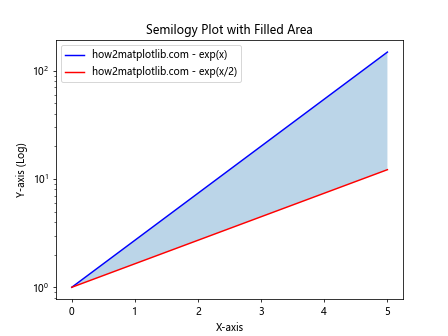
这个例子展示了如何在半对数图中添加填充区域。这种技术可以用来强调两条曲线之间的差异或表示数据的不确定性范围。
9. 性能考虑
在处理大量数据点时,semilogy()函数的性能可能会成为一个问题。以下是一些提高性能的技巧:
9.1 使用降采样
import matplotlib.pyplot as plt
import numpy as np

x = np.linspace(0, 100, 10000)
y = np.exp(x/10)

# 降采样
step = 100
plt.semilogy(x[::step], y[::step], 'b-')
plt.title('How2matplotlib.com - Downsampling for Performance')
plt.xlabel('X-axis')
plt.ylabel('Y-axis (Log)')
plt.show()
Output:
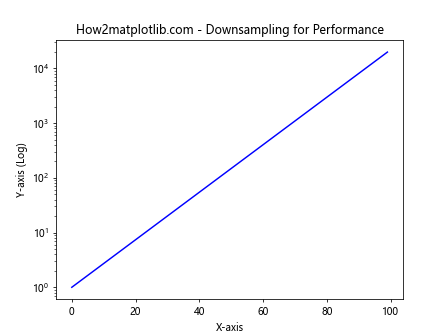
这个例子展示了如何通过降采样来减少数据点的数量,从而提高绘图性能。对于大型数据集,这种方法可以显著提高绘图速度,同时保持图形的整体形状。
9.2 使用线段集合
import matplotlib.pyplot as plt
import numpy as np
from matplotlib.collections import LineCollection

x = np.linspace(0, 10, 1000)
y = np.exp(x)

points = np.array([x, y]).T.reshape(-1, 1, 2)
segments = np.concatenate([points[:-1], points[1:]], axis=1)

lc = LineCollection(segments, cmap=plt.get_cmap('viridis'))
lc.set_array(x)

fig, ax = plt.subplots()
ax.add_collection(lc)
ax.set_yscale('log')
ax.set_xlim(x.min(), x.max())
ax.set_ylim(y.min(), y.max())
plt.colorbar(lc)
plt.title('How2matplotlib.com - Line Collection in Semilogy')
plt.xlabel('X-axis')
plt.ylabel('Y-axis (Log)')
plt.show()
Output:
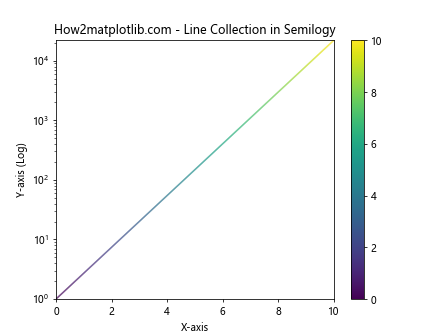
这个例子展示了如何使用线段集合(LineCollection)来绘制大量数据点。这种方法比传统的plot函数更高效,特别是在处理大型数据集时。
10. 常见问题和解决方案
在使用semilogy()函数时,用户可能会遇到一些常见问题。以下是一些问题及其解决方案:
10.1 处理警告信息
import matplotlib.pyplot as plt
import numpy as np
import warnings

warnings.filterwarnings("ignore")

x = np.linspace(0, 5, 100)
y = np.exp(x) - 1  # 这会产生一些非常接近零的值

plt.semilogy(x, y)
plt.title('How2matplotlib.com - Ignoring Warnings')
plt.xlabel('X-axis')
plt.ylabel('Y-axis (Log)')
plt.show()
Output:
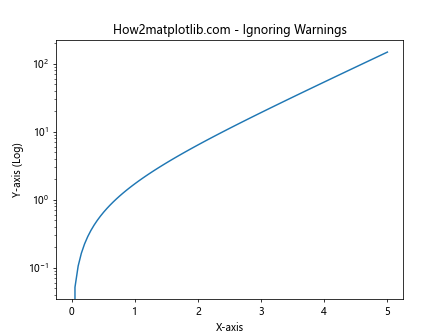
这个例子展示了如何处理由于数据中包含非常接近零的值而产生的警告。通过使用warnings.filterwarnings("ignore"),我们可以抑制这些警告。
10.2 处理无穷大值
import matplotlib.pyplot as plt
import numpy as np

x = np.linspace(0, 5, 100)
y = np.exp(x)
y[50] = np.inf  # 插入一个无穷大值

plt.semilogy(x, y)
plt.title('How2matplotlib.com - Handling Infinity')
plt.xlabel('X-axis')
plt.ylabel('Y-axis (Log)')
plt.ylim(1, 1e3)  # 限制y轴范围以排除无穷大值
plt.show()
Output:
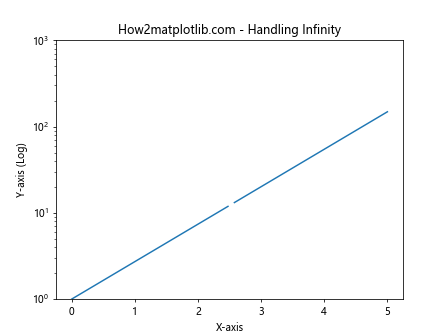
这个例子展示了如何处理数据中的无穷大值。通过设置y轴的限制,我们可以排除这些极端值,使图表更加可读。
11. 与其他对数图函数的比较
Matplotlib提供了几种不同类型的对数图函数。了解它们之间的区别可以帮助我们选择最适合的函数。
11.1 semilogx() vs semilogy()
import matplotlib.pyplot as plt
import numpy as np

x = np.logspace(0, 5, 100)
y = x**2

fig, (ax1, ax2) = plt.subplots(1, 2, figsize=(12, 5))

ax1.semilogx(x, y)
ax1.set_title('How2matplotlib.com - semilogx')
ax1.set_xlabel('X-axis (Log)')
ax1.set_ylabel('Y-axis')

ax2.semilogy(x, y)
ax2.set_title('How2matplotlib.com - semilogy')
ax2.set_xlabel('X-axis')
ax2.set_ylabel('Y-axis (Log)')

plt.tight_layout()
plt.show()
Output:
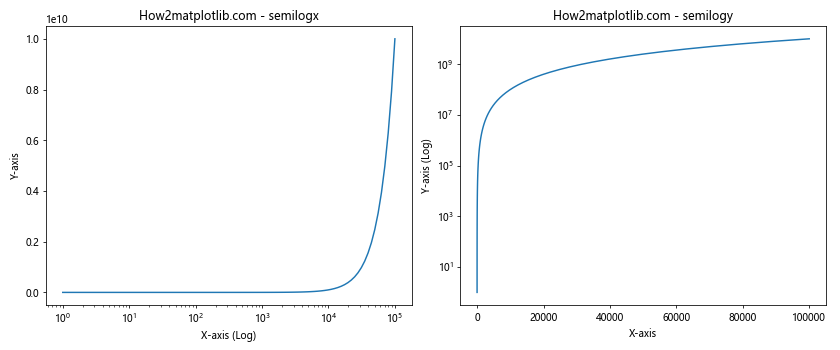
这个例子比较了semilogx()和semilogy()函数。semilogx()在x轴使用对数刻度,而semilogy()在y轴使用对数刻度。
11.2 loglog() 函数
import matplotlib.pyplot as plt
import numpy as np

x = np.logspace(0, 5, 100)
y = x**2

plt.loglog(x, y)
plt.title('How2matplotlib.com - loglog Plot')
plt.xlabel('X-axis (Log)')
plt.ylabel('Y-axis (Log)')
plt.grid(True)
plt.show()
Output:
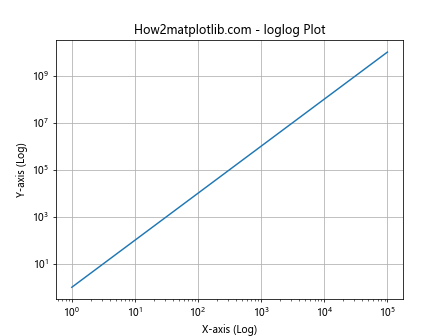
这个例子展示了loglog()函数,它在x轴和y轴都使用对数刻度。这种图表适合展示遵循幂律的数据。
12. 结合其他数据分析库
semilogy()函数可以与其他Python数据分析库结合使用,如Pandas和NumPy,以创建更复杂的数据可视化。
12.1 使用Pandas数据
import matplotlib.pyplot as plt
import pandas as pd
import numpy as np

# 创建示例数据
dates = pd.date_range('20210101', periods=100)
df = pd.DataFrame({'date': dates, 'value': np.exp(np.linspace(0, 5, 100))})

plt.figure(figsize=(10, 6))
plt.semilogy(df['date'], df['value'])
plt.title('How2matplotlib.com - Semilogy with Pandas Data')
plt.xlabel('Date')
plt.ylabel('Value (Log Scale)')
plt.xticks(rotation=45)
plt.grid(True)
plt.tight_layout()
plt.show()
Output:
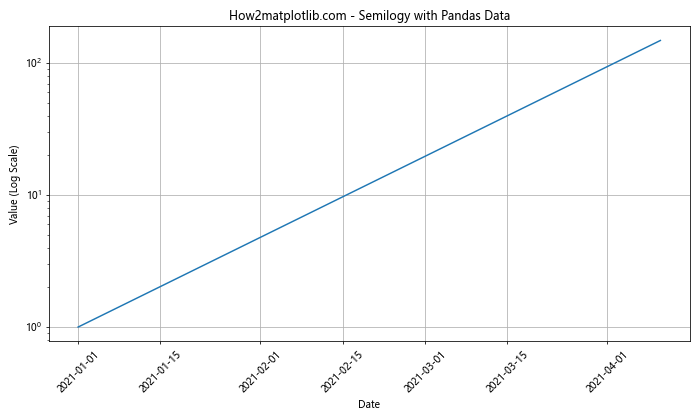
这个例子展示了如何使用Pandas DataFrame的数据创建半对数图。这种方法特别适合处理时间序列数据。
12.2 结合NumPy的高级函数
import matplotlib.pyplot as plt
import numpy as np

x = np.linspace(0, 10, 100)
y1 = np.exp(x)
y2 = np.exp(x) + np.random.normal(0, np.exp(x/2), 100)

plt.semilogy(x, y1, 'b-', label='how2matplotlib.com - Trend')
plt.semilogy(x, y2, 'r.', alpha=0.5, label='how2matplotlib.com - Data with Noise')

# 使用NumPy的多项式拟合
z = np.polyfit(x, np.log(y2), 1)
p = np.poly1d(z)
plt.semilogy(x, np.exp(p(x)), 'g--', label='how2matplotlib.com - Fitted Line')

plt.legend()
plt.title('Semilogy with NumPy Polynomial Fit')
plt.xlabel('X-axis')
plt.ylabel('Y-axis (Log)')
plt.show()
Output:
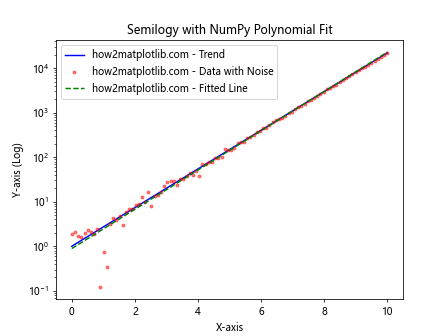
这个例子展示了如何结合NumPy的多项式拟合功能来分析半对数图中的数据趋势。
13. 总结
matplotlib.pyplot.semilogy()函数是一个强大的工具,用于创建y轴为对数刻度的图表。它在处理跨越多个数量级的数据时特别有用,能够清晰地展示指数增长或衰减的趋势。通过本文的详细介绍和丰富的示例,读者应该能够掌握如何使用这个函数来创建各种类型的半对数图,并了解如何处理常见的问题和优化性能。
半对数图在科学研究、工程分析和金融建模等领域有广泛的应用。掌握semilogy()函数不仅能帮助我们更好地理解和展示数据,还能为数据分析和决策提供有力的支持。随着数据可视化在各个领域的重要性日益增加,熟练使用这类专业的绘图工具将成为数据科学家和分析师的重要技能。
最后,建议读者在实际应用中多加练习,尝试将semilogy()函数与其他Matplotlib功能结合使用,以创建更加丰富和信息量大的可视化图表。同时,也要注意在使用过程中可能遇到的各种问题,如处理负值、零值和极端值等,并学会如何有效地解决这些问题。通过不断的实践和探索,相信读者一定能够充分发挥semilogy()函数的潜力,创造出既美观又富有洞察力的数据可视化作品。
 极客教程
极客教程