Matplotlib.pyplot.figlegend()函数:轻松创建图例的完整指南
参考:Matplotlib.pyplot.figlegend() function in Python
Matplotlib是Python中最流行的数据可视化库之一,而pyplot是Matplotlib中的一个子模块,提供了类似MATLAB的绘图接口。在数据可视化中,图例(legend)是一个非常重要的元素,它可以帮助读者理解图表中不同数据系列的含义。本文将详细介绍Matplotlib.pyplot中的figlegend()函数,这是一个用于创建图例的强大工具。
1. figlegend()函数简介
figlegend()函数是Matplotlib.pyplot模块中的一个函数,用于在整个图形(Figure)上创建一个图例,而不是在单个子图(Subplot)上。这个函数特别适用于包含多个子图的复杂图形,可以为所有子图创建一个统一的图例。
基本语法如下:
matplotlib.pyplot.figlegend(*args, **kwargs)
其中,*args和**kwargs是可变参数,允许你传入各种参数来自定义图例的外观和行为。
2. 基本用法
让我们从一个简单的例子开始,了解figlegend()的基本用法:
import matplotlib.pyplot as plt
import numpy as np

x = np.linspace(0, 10, 100)
fig, (ax1, ax2) = plt.subplots(2, 1, figsize=(8, 8))

ax1.plot(x, np.sin(x), label='Sin')
ax2.plot(x, np.cos(x), label='Cos')

plt.figlegend(loc='upper right', bbox_to_anchor=(1, 1), bbox_transform=fig.transFigure)

plt.suptitle('How to use figlegend() - how2matplotlib.com', fontsize=16)
plt.tight_layout()
plt.show()
Output:
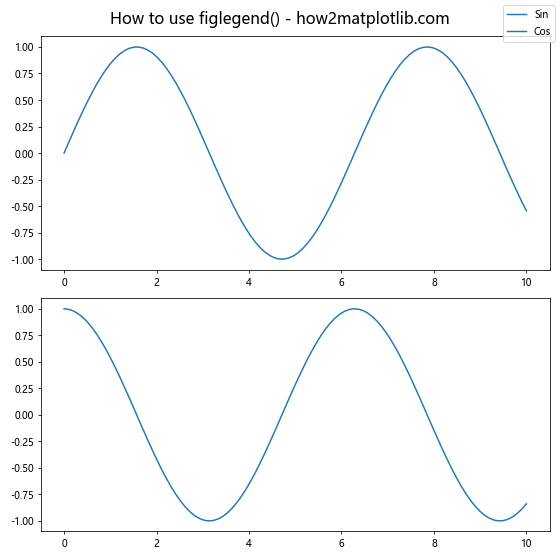
在这个例子中,我们创建了两个子图,分别绘制了正弦和余弦函数。然后使用figlegend()在整个图形的右上角创建了一个图例。loc参数指定了图例的位置,bbox_to_anchor和bbox_transform参数用于精确定位图例。
3. 自定义图例样式
figlegend()函数提供了多种参数来自定义图例的样式。以下是一些常用的样式设置:
import matplotlib.pyplot as plt
import numpy as np

x = np.linspace(0, 10, 100)
fig, ax = plt.subplots(figsize=(8, 6))

ax.plot(x, np.sin(x), label='Sin')
ax.plot(x, np.cos(x), label='Cos')

plt.figlegend(loc='upper right',
              fontsize=12,
              frameon=True,
              fancybox=True,
              shadow=True,
              facecolor='lightblue',
              edgecolor='darkblue',
              title='Functions')

plt.title('Custom Legend Style - how2matplotlib.com', fontsize=16)
plt.tight_layout()
plt.show()
Output:
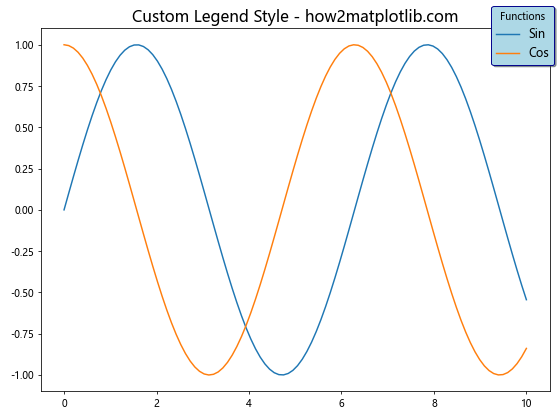
在这个例子中,我们设置了图例的字体大小、边框、阴影、背景色和边框颜色,并添加了一个标题。这些设置可以让图例更加美观和醒目。
4. 图例位置
figlegend()函数允许你精确控制图例的位置。你可以使用loc参数来指定预定义的位置,或者使用bbox_to_anchor参数来自定义位置:
import matplotlib.pyplot as plt
import numpy as np

x = np.linspace(0, 10, 100)
fig, (ax1, ax2) = plt.subplots(1, 2, figsize=(12, 5))

ax1.plot(x, np.sin(x), label='Sin')
ax2.plot(x, np.cos(x), label='Cos')

# 使用预定义位置
plt.figlegend(loc='lower center', ncol=2)

plt.suptitle('Legend Position - how2matplotlib.com', fontsize=16)
plt.tight_layout()
plt.show()
Output:
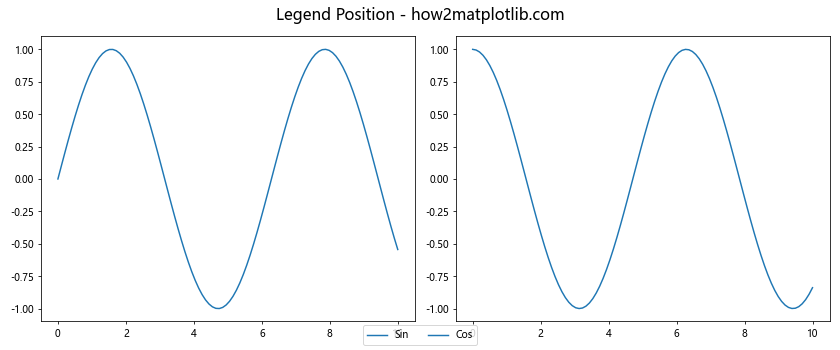
在这个例子中,我们将图例放置在图形的底部中央,并使用ncol参数将图例项排列成两列。
5. 多列图例
对于包含多个数据系列的图表,可以使用ncol参数创建多列图例:
import matplotlib.pyplot as plt
import numpy as np

x = np.linspace(0, 10, 100)
fig, ax = plt.subplots(figsize=(10, 6))

for i in range(5):
    ax.plot(x, np.sin(x + i), label=f'Sin {i}')

plt.figlegend(loc='upper center', ncol=3, bbox_to_anchor=(0.5, 1.15))

plt.title('Multi-column Legend - how2matplotlib.com', fontsize=16)
plt.tight_layout()
plt.show()
Output:
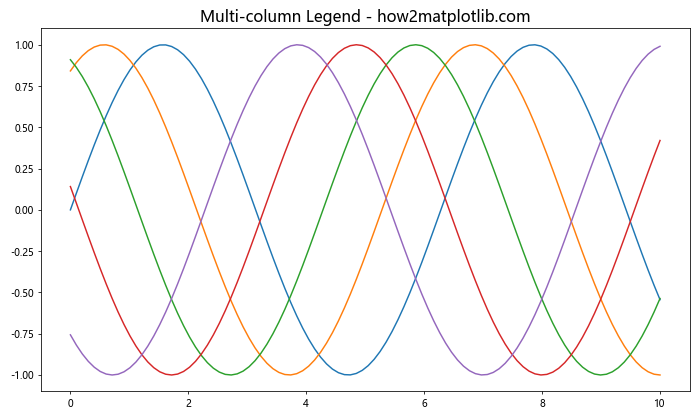
这个例子创建了5个正弦函数的图表,并使用3列的图例来显示所有的数据系列。
6. 自定义图例标记
你可以自定义图例中的标记样式,使其与实际绘图不同:
import matplotlib.pyplot as plt
import numpy as np

x = np.linspace(0, 10, 100)
fig, ax = plt.subplots(figsize=(8, 6))

line, = ax.plot(x, np.sin(x), 'r-')
plt.figlegend((line,), ('Custom Sin',), loc='upper right',
              numpoints=1, marker='o', markersize=10, markerfacecolor='blue')

plt.title('Custom Legend Markers - how2matplotlib.com', fontsize=16)
plt.tight_layout()
plt.show()
在这个例子中,我们为正弦函数线条创建了一个自定义的图例标记,使用蓝色圆点代替实际的红色线条。
7. 图例中添加额外信息
你可以在图例中添加额外的信息,比如数据的统计信息:
import matplotlib.pyplot as plt
import numpy as np

x = np.linspace(0, 10, 100)
y1 = np.sin(x)
y2 = np.cos(x)

fig, ax = plt.subplots(figsize=(8, 6))
ax.plot(x, y1, label=f'Sin (mean={y1.mean():.2f})')
ax.plot(x, y2, label=f'Cos (mean={y2.mean():.2f})')

plt.figlegend(loc='upper right', title='Functions with Statistics')

plt.title('Legend with Extra Information - how2matplotlib.com', fontsize=16)
plt.tight_layout()
plt.show()
Output:
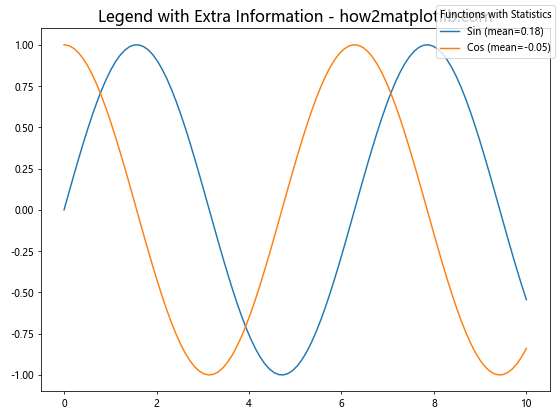
这个例子在图例标签中包含了每个数据系列的平均值,为读者提供了额外的统计信息。
8. 图例分组
对于复杂的图表,你可能需要将图例项分组。这可以通过创建多个图例或使用分隔符来实现:
import matplotlib.pyplot as plt
import numpy as np

x = np.linspace(0, 10, 100)
fig, ax = plt.subplots(figsize=(10, 6))

lines = []
labels = []

for i in range(3):
    line, = ax.plot(x, np.sin(x + i), label=f'Sin {i}')
    lines.append(line)
    labels.append(f'Sin {i}')

for i in range(3):
    line, = ax.plot(x, np.cos(x + i), label=f'Cos {i}')
    lines.append(line)
    labels.append(f'Cos {i}')

first_legend = plt.figlegend(lines[:3], labels[:3], loc='upper left', title='Sine Functions')
ax.add_artist(first_legend)
plt.figlegend(lines[3:], labels[3:], loc='upper right', title='Cosine Functions')

plt.title('Grouped Legend - how2matplotlib.com', fontsize=16)
plt.tight_layout()
plt.show()
Output:
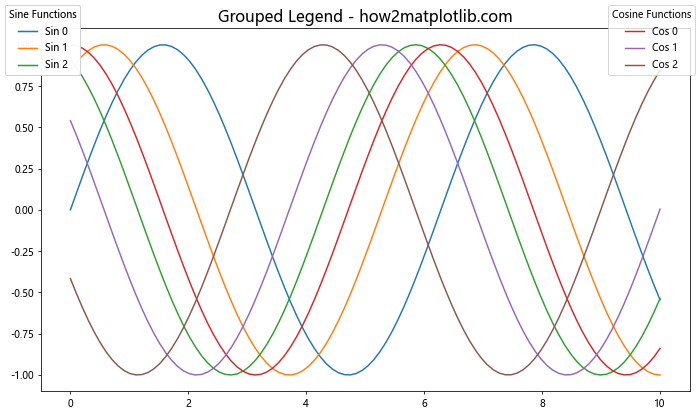
这个例子创建了两个分组的图例,一个用于正弦函数,另一个用于余弦函数。
9. 图例透明度
有时,你可能希望图例半透明,以便不完全遮挡底层的图表内容:
import matplotlib.pyplot as plt
import numpy as np

x = np.linspace(0, 10, 100)
fig, ax = plt.subplots(figsize=(8, 6))

ax.plot(x, np.sin(x), label='Sin')
ax.plot(x, np.cos(x), label='Cos')

plt.figlegend(loc='center', framealpha=0.5)

plt.title('Semi-transparent Legend - how2matplotlib.com', fontsize=16)
plt.tight_layout()
plt.show()
Output:
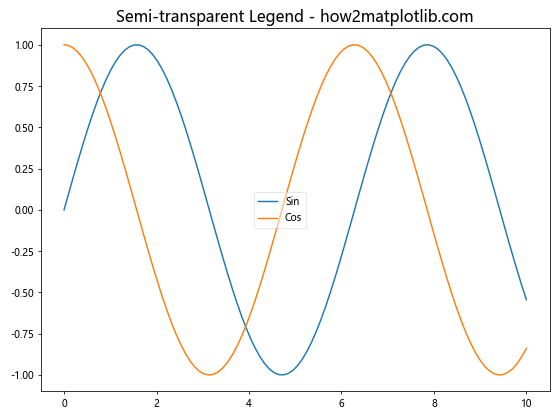
在这个例子中,我们使用framealpha参数设置图例的透明度为0.5,使其半透明。
10. 图例边框样式
你可以自定义图例的边框样式,包括线型、颜色和宽度:
import matplotlib.pyplot as plt
import numpy as np

x = np.linspace(0, 10, 100)
fig, ax = plt.subplots(figsize=(8, 6))

ax.plot(x, np.sin(x), label='Sin')
ax.plot(x, np.cos(x), label='Cos')

plt.figlegend(loc='upper right',
              edgecolor='red',
              linewidth=2,
              linestyle='--')

plt.title('Custom Legend Border - how2matplotlib.com', fontsize=16)
plt.tight_layout()
plt.show()
这个例子创建了一个红色虚线边框的图例。
11. 图例中的数学公式
Matplotlib支持在图例中使用LaTeX格式的数学公式:
import matplotlib.pyplot as plt
import numpy as np

x = np.linspace(0, 10, 100)
fig, ax = plt.subplots(figsize=(8, 6))

ax.plot(x, np.sin(x), label='\sin(x)')
ax.plot(x, np.cos(x), label='\cos(x)')

plt.figlegend(loc='upper right')

plt.title('Legend with Math Formulas - how2matplotlib.com', fontsize=16)
plt.tight_layout()
plt.show()
Output:
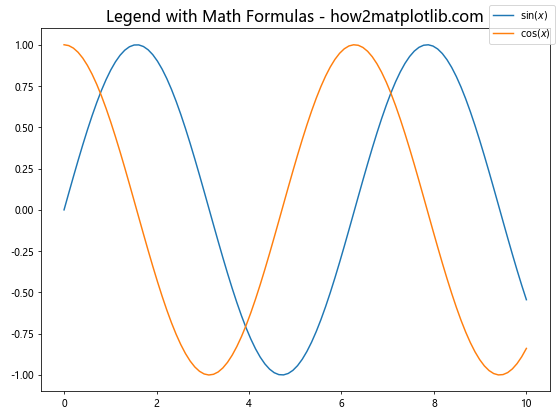
在这个例子中,我们在图例标签中使用了LaTeX格式的数学公式来表示正弦和余弦函数。
12. 自定义图例顺序
有时,你可能想要自定义图例项的顺序,而不是按照绘图顺序排列:
import matplotlib.pyplot as plt
import numpy as np

x = np.linspace(0, 10, 100)
fig, ax = plt.subplots(figsize=(8, 6))

line1, = ax.plot(x, np.sin(x), label='Sin')
line2, = ax.plot(x, np.cos(x), label='Cos')
line3, = ax.plot(x, np.tan(x), label='Tan')

plt.figlegend([line3, line1, line2], ['Tan', 'Sin', 'Cos'], loc='upper right')

plt.title('Custom Legend Order - how2matplotlib.com', fontsize=16)
plt.tight_layout()
plt.show()
Output:
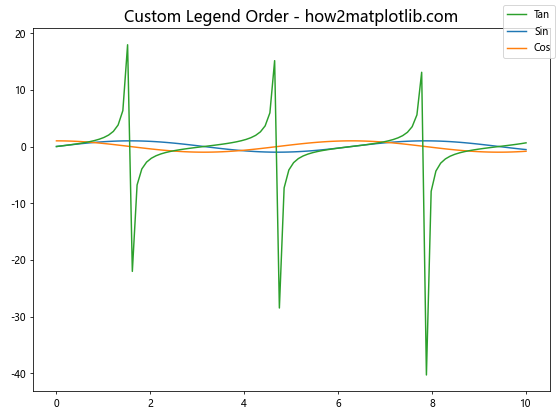
在这个例子中,我们手动指定了图例项的顺序,将正切函数放在最前面。
13. 图例中的颜色条
对于使用颜色映射的图表,你可能需要在图例中包含颜色条:
import matplotlib.pyplot as plt
import numpy as np
from matplotlib.cm import ScalarMappable
from matplotlib.colors import Normalize

x = np.linspace(0, 10, 100)
y = np.linspace(0, 10, 100)
X, Y = np.meshgrid(x, y)
Z = np.sin(X) * np.cos(Y)

fig, ax = plt.subplots(figsize=(8, 6))
im = ax.imshow(Z, cmap='viridis')

cbar = plt.colorbar(im)
cbar.set_label('Value')

plt.figlegend([ScalarMappable(norm=Normalize(vmin=-1, vmax=1), cmap='viridis')],
              ['sin(x) * cos(y)'],
              loc='upper right',
              bbox_to_anchor=(1.2, 1))

plt.title('Legend with Colorbar - how2matplotlib.com', fontsize=16)
plt.tight_layout()
plt.show()
Output:
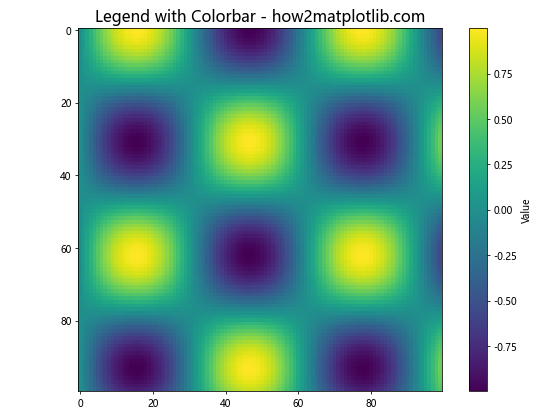
这个例子创建了一个热图,并在图例中包含了一个颜色条来解释颜色映射。
14. 动态更新图例
在某些情况下,你可能需要动态更新图例的内容:
import matplotlib.pyplot as plt
import numpy as np

x = np.linspace(0, 10, 100)
fig, ax = plt.subplots(figsize=(8, 6))

line, = ax.plot(x, np.sin(x), label='Sin')
legend = plt.figlegend(loc='upper right')

for i in range(5):
    line.set_ydata(np.sin(x + i))
    line.set_label(f'Sin(x + {i})')
    legend.remove()
    legend = plt.figlegend(loc='upper right')
    plt.pause(1)

plt.title('Dynamic Legend Update - how2matplotlib.com', fontsize=16)
plt.show()
这个例子演示了如何在循环中动态更新图例的内容。请注意,这个示例需要在交互式环境中运行才能看到动画效果。
15. 图例中的图像
你甚至可以在图例中包含小图像:
import matplotlib.pyplot as plt
import numpy as np

x = np.linspace(0, 10, 100)
fig, ax = plt.subplots(figsize=(8, 6))

ax.plot(x, np.sin(x), label='Sin')
ax.plot(x, np.cos(x), label='Cos')

# 创建一个小图像
image = np.random.rand(20, 20)
img_plot = ax.imshow(image, extent=(0, 0, 0, 0))

plt.figlegend([img_plot], ['Image'], loc='upper right')

plt.title('Legend with Image - how2matplotlib.com', fontsize=16)
plt.tight_layout()
plt.show()
Output:
这个例子在图例中包含了一个小的随机图像。这种技术可以用于在图例中显示缩略图或图标。
16. 自定义图例句柄
有时,你可能想要完全自定义图例中的句柄(handles):
import matplotlib.pyplot as plt
import matplotlib.patches as mpatches

fig, ax = plt.subplots(figsize=(8, 6))

red_patch = mpatches.Patch(color='red', label='Red')
blue_patch = mpatches.Patch(color='blue', label='Blue')
green_line = mpatches.Line2D([], [], color='green', marker='o', markersize=15, label='Green')

plt.figlegend(handles=[red_patch, blue_patch, green_line], loc='center')

plt.title('Custom Legend Handles - how2matplotlib.com', fontsize=16)
plt.tight_layout()
plt.show()
在这个例子中,我们创建了自定义的图例句柄,包括两个颜色块和一个带标记的线条。
17. 图例中的复杂布局
对于更复杂的图表,你可能需要在图例中创建复杂的布局:
import matplotlib.pyplot as plt
import numpy as np

x = np.linspace(0, 10, 100)
fig, (ax1, ax2) = plt.subplots(2, 1, figsize=(8, 10))

ax1.plot(x, np.sin(x), label='Sin')
ax1.plot(x, np.cos(x), label='Cos')

ax2.plot(x, np.tan(x), label='Tan')
ax2.plot(x, np.tanh(x), label='Tanh')

# 创建复杂的图例布局
legend1 = plt.figlegend(*ax1.get_legend_handles_labels(), loc='upper left', bbox_to_anchor=(0.1, 1), title='Trigonometric')
legend2 = plt.figlegend(*ax2.get_legend_handles_labels(), loc='upper right', bbox_to_anchor=(0.9, 1), title='Hyperbolic')

plt.suptitle('Complex Legend Layout - how2matplotlib.com', fontsize=16)
plt.tight_layout()
plt.show()
Output:
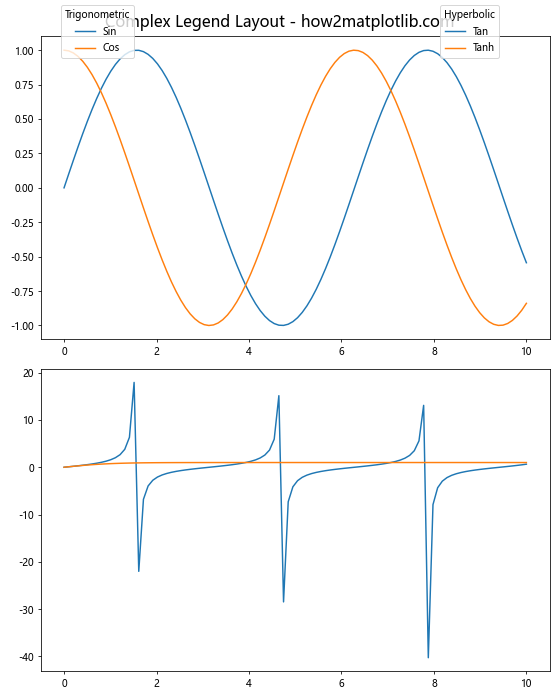
这个例子创建了两个子图,每个子图有自己的图例,并将它们放置在整个图形的不同位置。
18. 图例中的自定义标记
你可以在图例中使用自定义的标记:
import matplotlib.pyplot as plt
import numpy as np

x = np.linspace(0, 10, 100)
fig, ax = plt.subplots(figsize=(8, 6))

ax.plot(x, np.sin(x), 'ro', label='Sin')
ax.plot(x, np.cos(x), 'b^', label='Cos')

custom_lines = [plt.Line2D([0], [0], color='r', marker='o', linestyle=''),
                plt.Line2D([0], [0], color='b', marker='^', linestyle='')]

plt.figlegend(custom_lines, ['Custom Sin', 'Custom Cos'], loc='upper right')

plt.title('Custom Markers in Legend - how2matplotlib.com', fontsize=16)
plt.tight_layout()
plt.show()
Output:
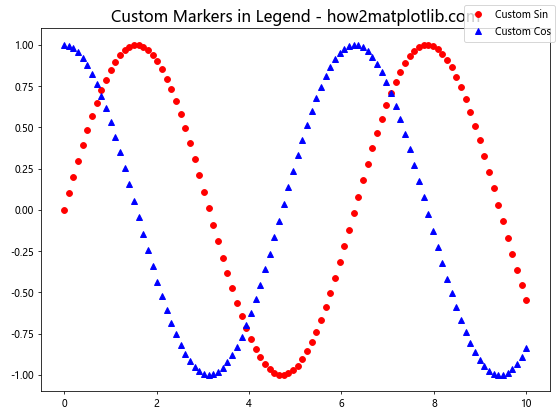
这个例子展示了如何在图例中使用自定义的标记样式。
19. 图例中的渐变色
对于使用渐变色的图表,你可以在图例中显示颜色渐变:
import matplotlib.pyplot as plt
import numpy as np
from matplotlib.colors import LinearSegmentedColormap

x = np.linspace(0, 10, 100)
y = np.sin(x)

fig, ax = plt.subplots(figsize=(8, 6))

cmap = LinearSegmentedColormap.from_list("", ["red", "yellow", "green"])
points = ax.scatter(x, y, c=y, cmap=cmap)

plt.figlegend((points,), ('Sin with gradient',), loc='upper right')
plt.colorbar(points)

plt.title('Gradient Color in Legend - how2matplotlib.com', fontsize=16)
plt.tight_layout()
plt.show()
Output:
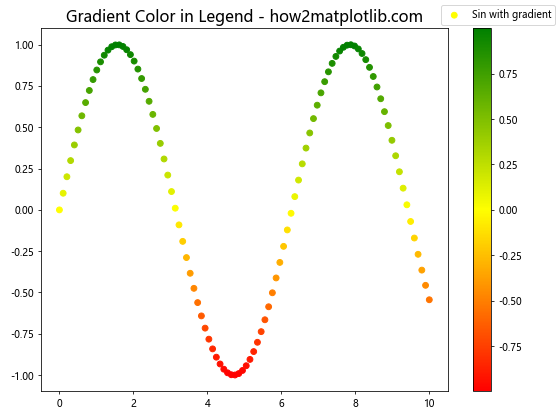
这个例子创建了一个使用渐变色的散点图,并在图例和颜色条中显示了这个渐变。
20. 图例中的多行文本
最后,让我们看看如何在图例中使用多行文本:
import matplotlib.pyplot as plt
import numpy as np

x = np.linspace(0, 10, 100)
fig, ax = plt.subplots(figsize=(8, 6))

ax.plot(x, np.sin(x), label='Sin\n(Sine Function)')
ax.plot(x, np.cos(x), label='Cos\n(Cosine Function)')

plt.figlegend(loc='upper right', title='Trigonometric Functions')

plt.title('Multi-line Text in Legend - how2matplotlib.com', fontsize=16)
plt.tight_layout()
plt.show()
Output:
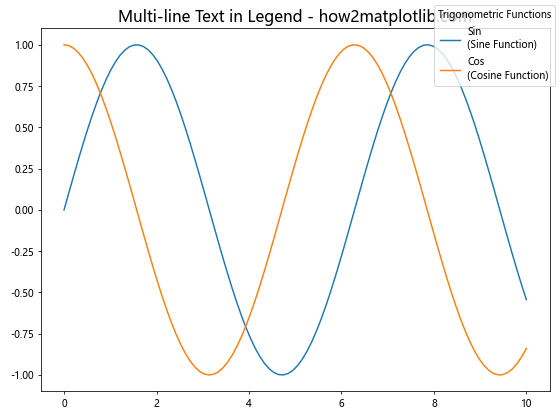
在这个例子中,我们在图例标签中使用了换行符来创建多行文本。
总结
Matplotlib.pyplot.figlegend()函数是一个强大而灵活的工具,可以帮助你创建清晰、信息丰富的图例。通过本文介绍的各种技巧和示例,你应该能够为各种复杂的图表创建出精美的图例。记住,好的图例不仅能增强图表的可读性,还能帮助读者更好地理解和解释数据。在实际应用中,你可能需要结合多种技巧来创建最适合你的数据和受众的图例。
 极客教程
极客教程