Matplotlib中使用axis.Tick.get_path_effects()方法详解
参考:Matplotlib.axis.Tick.get_path_effects() in Python
Matplotlib是Python中最流行的数据可视化库之一,它提供了丰富的绘图功能和自定义选项。在Matplotlib中,axis.Tick.get_path_effects()方法是一个强大的工具,用于获取刻度标签的路径效果。本文将深入探讨这个方法的使用,并通过多个示例来展示其功能和应用场景。
1. 什么是axis.Tick.get_path_effects()方法?
axis.Tick.get_path_effects()是Matplotlib库中axis.Tick类的一个方法。它用于获取应用于刻度标签的路径效果列表。路径效果是一种可以应用于文本或线条的视觉效果,例如阴影、描边等。这个方法允许我们检查当前应用于刻度标签的效果,从而更好地控制和自定义图表的外观。
2. 基本用法
要使用get_path_effects()方法,我们首先需要获取到轴对象的刻度实例。以下是一个基本的示例:
import matplotlib.pyplot as plt
import matplotlib.patheffects as path_effects

fig, ax = plt.subplots()
ax.set_title("how2matplotlib.com Example")
ax.plot([1, 2, 3, 4], [1, 4, 2, 3])

# 获取x轴的主刻度
xticks = ax.xaxis.get_major_ticks()

# 获取第一个刻度的路径效果
effects = xticks[0].get_path_effects()

print(effects)

plt.show()
Output:
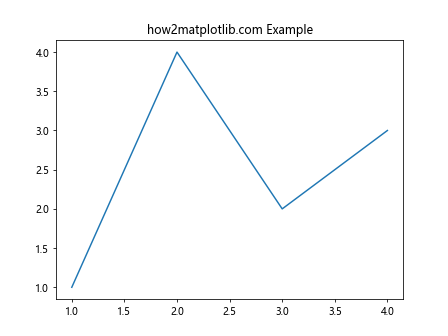
在这个例子中,我们创建了一个简单的线图,然后获取了x轴的主刻度。通过调用第一个刻度的get_path_effects()方法,我们可以查看应用于该刻度的路径效果。
3. 设置路径效果并获取
通常,我们会先设置路径效果,然后再获取它们。以下是一个设置路径效果并获取的示例:
import matplotlib.pyplot as plt
import matplotlib.patheffects as path_effects

fig, ax = plt.subplots()
ax.set_title("how2matplotlib.com Path Effects")
ax.plot([1, 2, 3, 4], [1, 4, 2, 3])

# 设置x轴刻度标签的路径效果
for tick in ax.xaxis.get_major_ticks():
    tick.label1.set_path_effects([path_effects.Stroke(linewidth=3, foreground='red'),
                                  path_effects.Normal()])

# 获取第一个刻度的路径效果
effects = ax.xaxis.get_major_ticks()[0].get_path_effects()

print(effects)

plt.show()
Output:
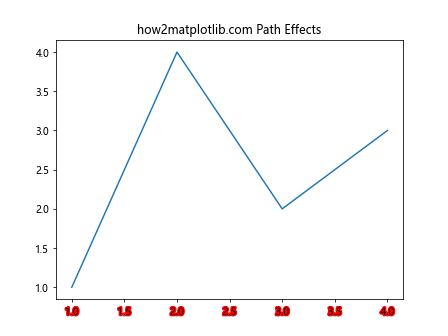
在这个例子中,我们为x轴的所有主刻度标签设置了一个红色描边效果。然后,我们使用get_path_effects()方法获取第一个刻度的路径效果。
4. 不同类型的路径效果
Matplotlib提供了多种路径效果,我们可以组合使用它们来创建独特的视觉效果。以下是一些常见的路径效果:
4.1 描边效果(Stroke)
描边效果可以为文本或线条添加轮廓。以下是一个使用描边效果的示例:
import matplotlib.pyplot as plt
import matplotlib.patheffects as path_effects

fig, ax = plt.subplots()
ax.set_title("how2matplotlib.com Stroke Effect")
ax.plot([1, 2, 3, 4], [1, 4, 2, 3])

# 设置x轴刻度标签的描边效果
for tick in ax.xaxis.get_major_ticks():
    tick.label1.set_path_effects([path_effects.Stroke(linewidth=3, foreground='blue'),
                                  path_effects.Normal()])

# 获取第一个刻度的路径效果
effects = ax.xaxis.get_major_ticks()[0].get_path_effects()

print(effects)

plt.show()
Output:
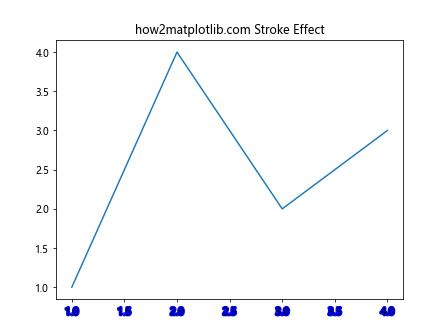
在这个例子中,我们为x轴的刻度标签添加了一个蓝色的描边效果。
4.2 阴影效果(Shadow)
阴影效果可以为文本或线条添加阴影,增加深度感。以下是一个使用阴影效果的示例:
import matplotlib.pyplot as plt
import matplotlib.patheffects as path_effects

fig, ax = plt.subplots()
ax.set_title("how2matplotlib.com Shadow Effect")
ax.plot([1, 2, 3, 4], [1, 4, 2, 3])

# 设置x轴刻度标签的阴影效果
for tick in ax.xaxis.get_major_ticks():
    tick.label1.set_path_effects([path_effects.withSimplePatchShadow()])

# 获取第一个刻度的路径效果
effects = ax.xaxis.get_major_ticks()[0].get_path_effects()

print(effects)

plt.show()
Output:
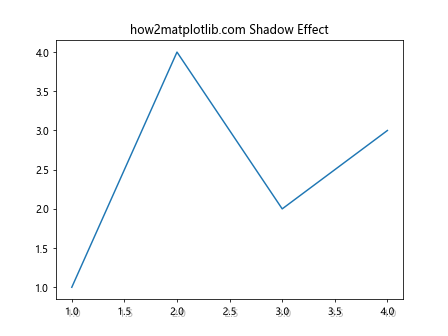
在这个例子中,我们为x轴的刻度标签添加了一个简单的阴影效果。
4.3 简单模糊效果(SimpleLineShadow)
简单模糊效果可以为线条添加模糊的阴影。以下是一个使用简单模糊效果的示例:
import matplotlib.pyplot as plt
import matplotlib.patheffects as path_effects

fig, ax = plt.subplots()
ax.set_title("how2matplotlib.com Simple Line Shadow")
line, = ax.plot([1, 2, 3, 4], [1, 4, 2, 3])

# 设置线条的简单模糊效果
line.set_path_effects([path_effects.SimpleLineShadow(), path_effects.Normal()])

# 获取线条的路径效果
effects = line.get_path_effects()

print(effects)

plt.show()
Output:
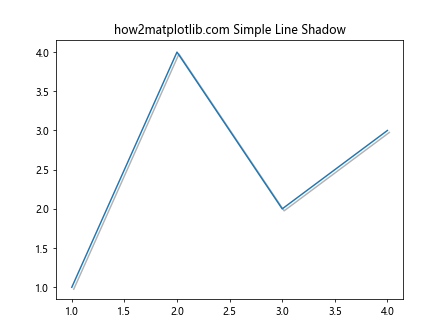
在这个例子中,我们为线条添加了一个简单的模糊阴影效果。
5. 组合多种路径效果
我们可以组合多种路径效果来创建更复杂的视觉效果。以下是一个组合描边和阴影效果的示例:
import matplotlib.pyplot as plt
import matplotlib.patheffects as path_effects

fig, ax = plt.subplots()
ax.set_title("how2matplotlib.com Combined Effects")
ax.plot([1, 2, 3, 4], [1, 4, 2, 3])

# 设置x轴刻度标签的组合效果
for tick in ax.xaxis.get_major_ticks():
    tick.label1.set_path_effects([
        path_effects.Stroke(linewidth=3, foreground='red'),
        path_effects.withSimplePatchShadow(shadow_rgbFace='blue', alpha=0.5),
        path_effects.Normal()
    ])

# 获取第一个刻度的路径效果
effects = ax.xaxis.get_major_ticks()[0].get_path_effects()

print(effects)

plt.show()
Output:
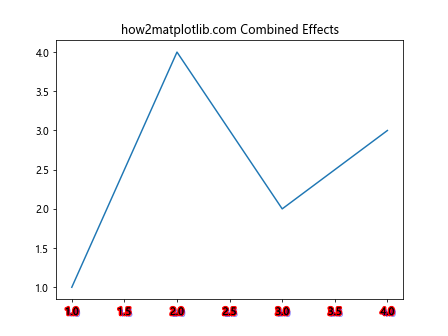
在这个例子中,我们为x轴的刻度标签添加了红色描边和蓝色阴影的组合效果。
6. 动态修改路径效果
我们可以在运行时动态修改路径效果。以下是一个动态修改路径效果的示例:
import matplotlib.pyplot as plt
import matplotlib.patheffects as path_effects

fig, ax = plt.subplots()
ax.set_title("how2matplotlib.com Dynamic Effects")
ax.plot([1, 2, 3, 4], [1, 4, 2, 3])

# 初始设置
for tick in ax.xaxis.get_major_ticks():
    tick.label1.set_path_effects([path_effects.Normal()])

# 获取初始路径效果
initial_effects = ax.xaxis.get_major_ticks()[0].get_path_effects()
print("Initial effects:", initial_effects)

# 动态修改路径效果
new_effects = [path_effects.Stroke(linewidth=2, foreground='green'), path_effects.Normal()]
for tick in ax.xaxis.get_major_ticks():
    tick.label1.set_path_effects(new_effects)

# 获取修改后的路径效果
modified_effects = ax.xaxis.get_major_ticks()[0].get_path_effects()
print("Modified effects:", modified_effects)

plt.show()
Output:
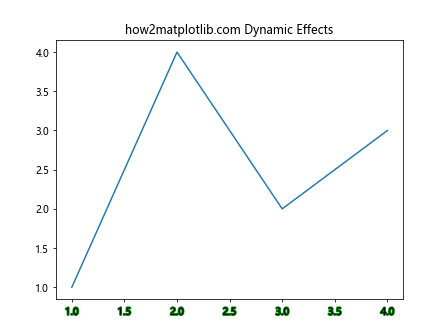
在这个例子中,我们首先设置了一个普通的路径效果,然后动态地将其修改为带有绿色描边的效果。
7. 应用路径效果到不同的图表元素
路径效果不仅可以应用于刻度标签,还可以应用于其他图表元素,如标题、图例等。以下是一个将路径效果应用到多个图表元素的示例:
import matplotlib.pyplot as plt
import matplotlib.patheffects as path_effects

fig, ax = plt.subplots()
ax.set_title("how2matplotlib.com Multiple Elements", path_effects=[path_effects.withSimplePatchShadow()])
line, = ax.plot([1, 2, 3, 4], [1, 4, 2, 3], label="Data")
ax.legend()

# 设置线条的路径效果
line.set_path_effects([path_effects.SimpleLineShadow(), path_effects.Normal()])

# 设置x轴刻度标签的路径效果
for tick in ax.xaxis.get_major_ticks():
    tick.label1.set_path_effects([path_effects.Stroke(linewidth=2, foreground='red'), path_effects.Normal()])

# 获取不同元素的路径效果
title_effects = ax.title.get_path_effects()
line_effects = line.get_path_effects()
tick_effects = ax.xaxis.get_major_ticks()[0].get_path_effects()

print("Title effects:", title_effects)
print("Line effects:", line_effects)
print("Tick effects:", tick_effects)

plt.show()
Output:
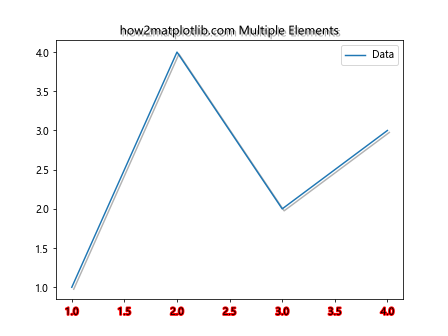
在这个例子中,我们为标题、线条和x轴刻度标签分别设置了不同的路径效果,并使用get_path_effects()方法获取它们的效果。
8. 自定义路径效果
除了使用Matplotlib提供的预定义路径效果,我们还可以创建自定义的路径效果。以下是一个创建自定义路径效果的示例:
import matplotlib.pyplot as plt
import matplotlib.patheffects as path_effects

class CustomEffect(path_effects.AbstractPathEffect):
    def __init__(self, offset=(1, -1), alpha=0.5):
        self._offset = offset
        self._alpha = alpha

    def draw_path(self, renderer, gc, tpath, affine, rgbFace):
        offset_path = affine.transform_path(tpath)
        offset_transform = affine + plt.transforms.Affine2D().translate(*self._offset)
        renderer.draw_path(gc, offset_path, offset_transform, rgbFace, alpha=self._alpha)

fig, ax = plt.subplots()
ax.set_title("how2matplotlib.com Custom Effect")
ax.plot([1, 2, 3, 4], [1, 4, 2, 3])

# 应用自定义路径效果
for tick in ax.xaxis.get_major_ticks():
    tick.label1.set_path_effects([CustomEffect(offset=(2, -2), alpha=0.7), path_effects.Normal()])

# 获取路径效果
effects = ax.xaxis.get_major_ticks()[0].get_path_effects()

print(effects)

plt.show()
在这个例子中,我们创建了一个自定义的路径效果,它可以为文本添加偏移和透明度。然后,我们将这个自定义效果应用到x轴的刻度标签上。
9. 路径效果的性能考虑
虽然路径效果可以大大增强图表的视觉吸引力,但它们也可能影响渲染性能,特别是在处理大量数据或复杂图表时。以下是一个展示如何在保持视觉效果的同时优化性能的示例:
import matplotlib.pyplot as plt
import matplotlib.patheffects as path_effects
import time

fig, (ax1, ax2) = plt.subplots(1, 2, figsize=(12, 5))
fig.suptitle("how2matplotlib.com Performance Comparison")

# 不使用路径效果
start_time = time.time()
ax1.set_title("Without Path Effects")
for i in range(100):
    ax1.plot([1, 2, 3, 4], [i, i+1, i+2, i+3])
end_time = time.time()
print(f"Time without path effects: {end_time - start_time:.4f} seconds")

# 使用路径效果,但仅应用于关键元素
start_time = time.time()
ax2.set_title("With Selective Path Effects")
for i in range(100):
    ax2.plot([1, 2, 3, 4], [i, i+1, i+2, i+3])

# 仅为标题和轴标签添加路径效果
ax2.title.set_path_effects([path_effects.withSimplePatchShadow()])
for label in ax2.get_xticklabels() + ax2.get_yticklabels():
    label.set_path_effects([path_effects.withSimplePatchShadow()])

end_time = time.time()
print(f"Time with selective path effects: {end_time - start_time:.4f} seconds")

# 获取路径效果
title_effects = ax2.title.get_path_effects()
label_effects = ax2.xaxis.get_major_ticks()[0].label1.get_path_effects()

print("Title effects:", title_effects)
print("Label effects:", label_effects)

plt.tight_layout()
plt.show()
Output:
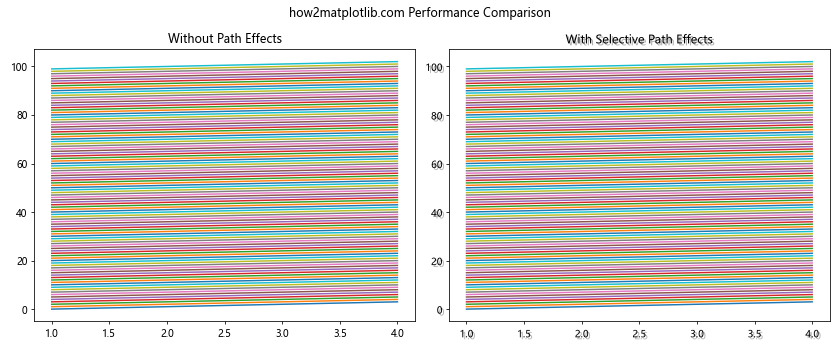
在这个例子中,我们比较了不使用路径效果和选择性使用路径效果的性能差异。我们只为标题和轴标签添加了路径效果,而不是为每条线都添加效果,从而在保持视觉吸引力的同时提高了性能。
10. 路径效果与动画
路径效果也可以与动画结合使用,创造出动态和引人注目的可视化效果。以下是一个使用路径效果创建简单动画的示例:
import matplotlib.pyplot as plt
import matplotlib.patheffects as path_effects
import matplotlib.animation as animation
import numpy as np

fig, ax = plt.subplots()
ax.set_title("how2matplotlib.com Animated Path Effects")
line, = ax.plot([], [], lw=2)
ax.set_xlim(0, 2*np.pi)
ax.set_ylim(-1, 1)

def init():
    line.set_data([], [])
    return line,

def animate(i):
    x = np.linspace(0, 2*np.pi, 100)
    y = np.sin(x + i/10.0)
    line.set_data(x, y)

    # 动态更改路径效果
    offset = (np.sin(i/10.0) * 2, np.cos(i/10.0) * 2)
    line.set_path_effects([path_effects.SimpleLineShadow(offset=offset), path_effects.Normal()])

    return line,

anim = animation.FuncAnimation(fig, animate, init_func=init, frames=200, interval=50, blit=True)

# 获取当前的路径效果
current_effects = line.get_path_effects()
print("Current effects:", current_effects)

plt.show()
Output:
在这个例子中,我们创建了一个正弦波动画,并动态地改变线条的阴影效果,使阴影随着波形的变化而移动。
11. 路径效果与3D图表
虽然路径效果主要用于2D图表,但它们也可以应用于3D图表的某些元素。以下是一个在3D图表中使用路径效果的示例:
import matplotlib.pyplot as plt
import matplotlib.patheffects as path_effects
import numpy as np

fig = plt.figure()
ax = fig.add_subplot(111, projection='3d')
ax.set_title("how2matplotlib.com 3D with Path Effects")

# 创建3D数据
x = np.linspace(-5, 5, 100)
y = np.linspace(-5, 5, 100)
X, Y = np.meshgrid(x, y)
Z = np.sin(np.sqrt(X**2 + Y**2))

# 绘制3D表面
surf = ax.plot_surface(X, Y, Z, cmap='viridis')

# 为轴标签添加路径效果
for axis in [ax.xaxis, ax.yaxis, ax.zaxis]:
    axis.label.set_path_effects([path_effects.Stroke(linewidth=3, foreground='white'),
                                 path_effects.Normal()])

# 为标题添加路径效果
ax.title.set_path_effects([path_effects.withSimplePatchShadow()])

# 获取路径效果
title_effects = ax.title.get_path_effects()
label_effects = ax.xaxis.label.get_path_effects()

print("Title effects:", title_effects)
print("Label effects:", label_effects)

plt.show()
Output:
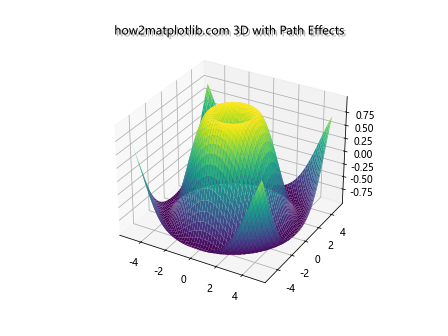
在这个例子中,我们创建了一个3D表面图,并为轴标签和标题添加了路径效果,使它们在复杂的3D环境中更加突出。
12. 路径效果与颜色映射
路径效果可以与颜色映射(colormap)结合使用,创造出更丰富的视觉效果。以下是一个将路径效果应用于颜色条(colorbar)的示例:
import matplotlib.pyplot as plt
import matplotlib.patheffects as path_effects
import numpy as np

fig, ax = plt.subplots()
ax.set_title("how2matplotlib.com Colormap with Path Effects")

# 创建一个简单的热图
data = np.random.rand(10, 10)
im = ax.imshow(data, cmap='viridis')

# 添加颜色条
cbar = fig.colorbar(im)

# 为颜色条标签添加路径效果
cbar.set_label("Values", path_effects=[path_effects.withSimplePatchShadow()])

# 为颜色条刻度标签添加路径效果
for label in cbar.ax.yaxis.get_ticklabels():
    label.set_path_effects([path_effects.withStroke(linewidth=2, foreground='white')])

# 获取路径效果
cbar_label_effects = cbar.ax.yaxis.label.get_path_effects()
cbar_tick_effects = cbar.ax.yaxis.get_ticklabels()[0].get_path_effects()

print("Colorbar label effects:", cbar_label_effects)
print("Colorbar tick effects:", cbar_tick_effects)

plt.show()
Output:
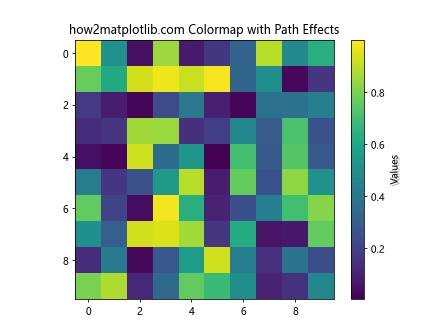
在这个例子中,我们创建了一个热图并添加了颜色条。然后,我们为颜色条的标签和刻度标签添加了路径效果,使它们更加醒目。
13. 路径效果与极坐标图
路径效果也可以应用于极坐标图,为这种特殊类型的图表增添视觉吸引力。以下是一个在极坐标图中使用路径效果的示例:
import matplotlib.pyplot as plt
import matplotlib.patheffects as path_effects
import numpy as np

fig, ax = plt.subplots(subplot_kw=dict(projection='polar'))
ax.set_title("how2matplotlib.com Polar Plot with Path Effects")

# 创建极坐标数据
r = np.linspace(0, 1, 100)
theta = 2 * np.pi * r

# 绘制极坐标图
line, = ax.plot(theta, r)
line.set_path_effects([path_effects.SimpleLineShadow(), path_effects.Normal()])

# 为径向标签添加路径效果
for label in ax.yaxis.get_ticklabels():
    label.set_path_effects([path_effects.withStroke(linewidth=2, foreground='white')])

# 为角度标签添加路径效果
for label in ax.xaxis.get_ticklabels():
    label.set_path_effects([path_effects.withSimplePatchShadow()])

# 获取路径效果
line_effects = line.get_path_effects()
radial_label_effects = ax.yaxis.get_ticklabels()[0].get_path_effects()
angular_label_effects = ax.xaxis.get_ticklabels()[0].get_path_effects()

print("Line effects:", line_effects)
print("Radial label effects:", radial_label_effects)
print("Angular label effects:", angular_label_effects)

plt.show()
Output:
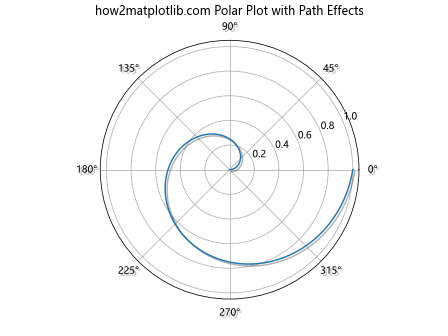
在这个例子中,我们创建了一个极坐标图,并为线条、径向标签和角度标签添加了不同的路径效果,增强了图表的视觉效果。
14. 路径效果与文本注释
路径效果可以很好地应用于文本注释,使注释在复杂的图表中更加突出。以下是一个在散点图中使用带路径效果的文本注释的示例:
import matplotlib.pyplot as plt
import matplotlib.patheffects as path_effects
import numpy as np

fig, ax = plt.subplots()
ax.set_title("how2matplotlib.com Annotations with Path Effects")

# 创建散点图数据
np.random.seed(42)
x = np.random.rand(50)
y = np.random.rand(50)

# 绘制散点图
ax.scatter(x, y)

# 添加带路径效果的文本注释
for i in range(5):
    text = ax.annotate(f"Point {i+1}", (x[i], y[i]), xytext=(5, 5), textcoords='offset points')
    text.set_path_effects([path_effects.withStroke(linewidth=3, foreground='white'),
                           path_effects.Normal()])

# 获取第一个注释的路径效果
annotation_effects = ax.texts[0].get_path_effects()
print("Annotation effects:", annotation_effects)

plt.show()
Output:
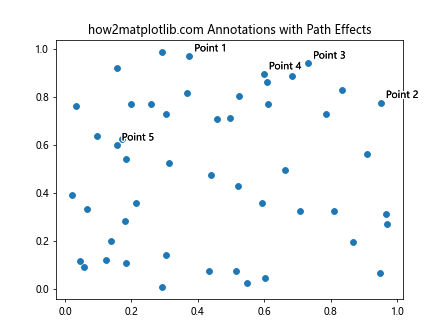
在这个例子中,我们创建了一个散点图,并为其中的几个点添加了带路径效果的文本注释。这些注释有白色的描边,使它们在背景中更加清晰可见。
15. 路径效果与自定义图例
路径效果还可以用来增强图例的视觉效果。以下是一个创建带有自定义路径效果的图例的示例:
import matplotlib.pyplot as plt
import matplotlib.patheffects as path_effects
import numpy as np

fig, ax = plt.subplots()
ax.set_title("how2matplotlib.com Custom Legend with Path Effects")

# 创建一些示例数据
x = np.linspace(0, 10, 100)
y1 = np.sin(x)
y2 = np.cos(x)

# 绘制线条
line1, = ax.plot(x, y1, label='Sin')
line2, = ax.plot(x, y2, label='Cos')

# 为线条添加路径效果
line1.set_path_effects([path_effects.SimpleLineShadow(), path_effects.Normal()])
line2.set_path_effects([path_effects.Stroke(linewidth=3, foreground='yellow'), path_effects.Normal()])

# 创建图例
legend = ax.legend()

# 为图例文本添加路径效果
for text in legend.get_texts():
    text.set_path_effects([path_effects.withSimplePatchShadow()])

# 获取路径效果
line1_effects = line1.get_path_effects()
line2_effects = line2.get_path_effects()
legend_text_effects = legend.get_texts()[0].get_path_effects()

print("Line 1 effects:", line1_effects)
print("Line 2 effects:", line2_effects)
print("Legend text effects:", legend_text_effects)

plt.show()
Output:
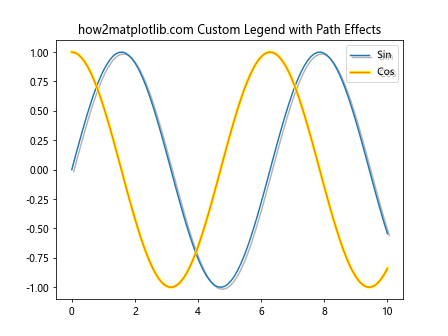
在这个例子中,我们为两条线添加了不同的路径效果,并为图例文本添加了阴影效果,使整个图表看起来更加生动和立体。
结论
通过本文的详细介绍和多个示例,我们深入探讨了Matplotlib中axis.Tick.get_path_effects()方法的使用及其在各种图表类型中的应用。路径效果是一个强大的工具,可以显著提升图表的视觉吸引力和可读性。从简单的描边和阴影效果,到复杂的自定义效果,路径效果为数据可视化提供了丰富的表现力。
在使用路径效果时,需要注意以下几点:
- 合理使用:过度使用路径效果可能会使图表变得杂乱,影响信息的传达。
- 性能考虑:在处理大量数据时,选择性地应用路径效果可以平衡视觉效果和性能。
- 一致性:在同一个图表或报告中,保持路径效果的一致性可以提高整体的美观度。
- 适配性:根据图表类型和数据特征选择合适的路径效果。
通过掌握get_path_effects()方法和相关的路径效果设置,您可以创建出更加专业、吸引人的数据可视化作品。无论是在科学研究、数据分析还是商业报告中,合理运用路径效果都能让您的图表脱颖而出,更有效地传达信息。
 极客教程
极客教程