Matplotlib中的axis.Axis.update_units()函数:轴单位更新详解
参考:Matplotlib.axis.Axis.update_units() function in Python
Matplotlib是Python中最流行的数据可视化库之一,它提供了丰富的绘图功能和灵活的自定义选项。在Matplotlib中,axis.Axis.update_units()函数是一个重要的方法,用于更新轴的单位。本文将深入探讨这个函数的用法、特性和应用场景,帮助读者更好地理解和使用它来优化图表的单位显示。
1. axis.Axis.update_units()函数简介
axis.Axis.update_units()是Matplotlib库中Axis类的一个方法,主要用于更新轴的单位。当我们需要改变轴的单位表示方式时,这个函数就派上用场了。它可以根据数据的性质和范围,自动调整轴的单位,使图表更加清晰易读。
1.1 基本语法
import matplotlib.pyplot as plt

fig, ax = plt.subplots()
ax.xaxis.update_units(new_units)
ax.yaxis.update_units(new_units)

plt.title("How2matplotlib.com - Basic update_units() Example")
plt.show()
在这个基本示例中,我们首先导入Matplotlib库,然后创建一个图表和轴对象。接着,我们可以分别对x轴和y轴调用update_units()方法来更新单位。new_units参数是一个新的单位对象,用于替换原有的单位。
2. 单位系统在Matplotlib中的重要性
在数据可视化中,正确表示数据的单位至关重要。合适的单位可以让读者更容易理解数据的规模和含义。Matplotlib提供了灵活的单位系统,允许用户自定义和更新轴的单位。
2.1 默认单位示例
import matplotlib.pyplot as plt
import numpy as np

x = np.linspace(0, 10, 100)
y = np.sin(x)

fig, ax = plt.subplots()
ax.plot(x, y)
ax.set_xlabel('X axis (How2matplotlib.com)')
ax.set_ylabel('Y axis (How2matplotlib.com)')
plt.title("Default Units Example")
plt.show()
Output:
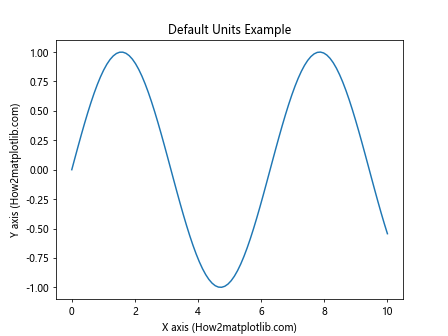
这个例子展示了Matplotlib的默认单位行为。x轴和y轴都使用默认的数值单位,没有特殊的单位标记。
3. 使用update_units()更新轴单位
现在,让我们深入了解如何使用update_units()函数来更新轴的单位。
3.1 更新到自定义单位
import matplotlib.pyplot as plt
import matplotlib.units as units
import numpy as np

class MyUnit:
    def __init__(self, value):
        self.value = value

    def __str__(self):
        return f"{self.value} How2matplotlib.com units"

def convert_my_unit(x, unit):
    return x * 2  # 假设我们的自定义单位是原始值的两倍

my_unit_converter = units.ConversionInterface()
my_unit_converter.convert = convert_my_unit

units.registry[MyUnit] = my_unit_converter

x = [MyUnit(i) for i in range(5)]
y = [i**2 for i in range(5)]

fig, ax = plt.subplots()
ax.plot(x, y)
ax.xaxis.update_units(MyUnit)

plt.title("Custom Units with update_units()")
plt.show()
在这个例子中,我们定义了一个自定义单位类MyUnit和相应的转换函数。然后,我们使用update_units()方法将x轴更新为使用这个自定义单位。
4. 自动单位推断
Matplotlib能够自动推断数据的单位,并相应地更新轴的显示。update_units()函数在这个过程中起着关键作用。
4.1 日期时间单位示例
import matplotlib.pyplot as plt
import matplotlib.dates as mdates
import datetime

dates = [datetime.datetime(2023, 1, 1) + datetime.timedelta(days=i) for i in range(10)]
values = [i**2 for i in range(10)]

fig, ax = plt.subplots()
ax.plot(dates, values)
ax.xaxis.update_units(mdates.DateConverter())

plt.title("How2matplotlib.com - Date Units Example")
plt.xlabel("Date")
plt.ylabel("Value")
plt.show()
Output:
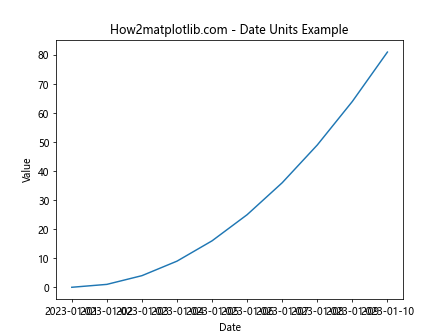
这个例子展示了如何使用update_units()函数来处理日期时间数据。Matplotlib会自动识别日期类型,并使用适当的格式显示。
5. 动态更新单位
update_units()函数不仅可以在初始化时使用,还可以在图表绘制后动态更新单位。
5.1 动态单位更新示例
import matplotlib.pyplot as plt
import numpy as np

class DynamicUnit:
    def __init__(self, scale=1):
        self.scale = scale

    def __call__(self, x, pos):
        return f"{x*self.scale:.2f} How2matplotlib.com"

x = np.linspace(0, 10, 100)
y = np.sin(x)

fig, ax = plt.subplots()
line, = ax.plot(x, y)

def update_scale(scale):
    ax.xaxis.set_major_formatter(DynamicUnit(scale))
    ax.xaxis.update_units(DynamicUnit(scale))
    fig.canvas.draw()

update_scale(1)
plt.title("Dynamic Unit Update")
plt.show()

# 模拟动态更新
update_scale(2)
Output:
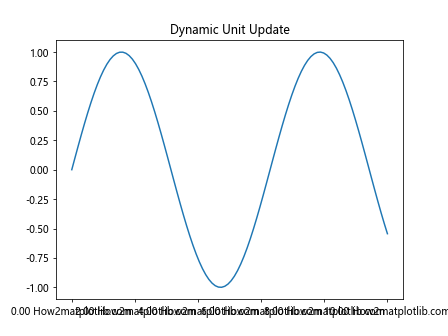
这个例子演示了如何创建一个动态单位类,并使用update_units()函数来实时更新轴的单位。
6. 处理不同数量级的数据
当处理跨越多个数量级的数据时,update_units()函数可以帮助我们自动选择合适的单位。
6.1 科学记数法示例
import matplotlib.pyplot as plt
import numpy as np

x = np.logspace(0, 10, 11)
y = x**2

fig, ax = plt.subplots()
ax.plot(x, y)
ax.set_xscale('log')
ax.set_yscale('log')

formatter = plt.ScalarFormatter(useMathText=True)
formatter.set_scientific(True)
formatter.set_powerlimits((-1,1))

ax.xaxis.set_major_formatter(formatter)
ax.yaxis.set_major_formatter(formatter)

ax.xaxis.update_units(formatter)
ax.yaxis.update_units(formatter)

plt.title("How2matplotlib.com - Scientific Notation Example")
plt.xlabel("X axis (log scale)")
plt.ylabel("Y axis (log scale)")
plt.show()
Output:
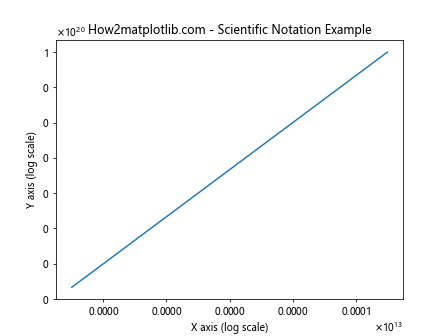
这个例子展示了如何使用update_units()函数来处理大范围的数据,并使用科学记数法来表示轴的单位。
7. 自定义单位转换
update_units()函数允许我们实现自定义的单位转换逻辑,这在处理特殊数据类型时非常有用。
7.1 温度单位转换示例
import matplotlib.pyplot as plt
import matplotlib.units as units
import numpy as np

class Temperature:
    def __init__(self, temp, unit='C'):
        self.temp = temp
        self.unit = unit

def convert_temperature(x, unit):
    if unit == 'F':
        return (x.temp - 32) * 5/9 if x.unit == 'F' else x.temp
    elif unit == 'C':
        return x.temp * 9/5 + 32 if x.unit == 'C' else x.temp
    else:
        return x.temp

temp_converter = units.ConversionInterface()
temp_converter.convert = convert_temperature
units.registry[Temperature] = temp_converter

temps_c = [Temperature(t, 'C') for t in range(0, 101, 10)]
temps_f = [Temperature(t, 'F') for t in range(32, 212, 20)]

fig, (ax1, ax2) = plt.subplots(1, 2, figsize=(12, 5))

ax1.plot(temps_c, [t.temp for t in temps_c], 'r-')
ax1.set_ylabel('Temperature (°C)')
ax1.xaxis.update_units(Temperature)

ax2.plot(temps_f, [t.temp for t in temps_f], 'b-')
ax2.set_ylabel('Temperature (°F)')
ax2.xaxis.update_units(Temperature)

plt.suptitle("How2matplotlib.com - Temperature Unit Conversion")
plt.show()
这个例子展示了如何创建一个自定义的温度单位类,并使用update_units()函数来实现摄氏度和华氏度之间的转换。
8. 处理复合单位
有时我们需要处理由多个基本单位组成的复合单位。update_units()函数也可以帮助我们处理这种情况。
8.1 速度单位示例
import matplotlib.pyplot as plt
import matplotlib.units as units
import numpy as np

class Speed:
    def __init__(self, value, unit='m/s'):
        self.value = value
        self.unit = unit

def convert_speed(x, unit):
    if unit == 'km/h':
        return x.value * 3.6 if x.unit == 'm/s' else x.value
    elif unit == 'm/s':
        return x.value / 3.6 if x.unit == 'km/h' else x.value
    else:
        return x.value

speed_converter = units.ConversionInterface()
speed_converter.convert = convert_speed
units.registry[Speed] = speed_converter

speeds_ms = [Speed(v) for v in range(0, 31, 5)]
speeds_kmh = [Speed(v, 'km/h') for v in range(0, 101, 10)]

fig, (ax1, ax2) = plt.subplots(1, 2, figsize=(12, 5))

ax1.plot([s.value for s in speeds_ms], speeds_ms, 'g-')
ax1.set_ylabel('Speed (m/s)')
ax1.yaxis.update_units(Speed)

ax2.plot([s.value for s in speeds_kmh], speeds_kmh, 'y-')
ax2.set_ylabel('Speed (km/h)')
ax2.yaxis.update_units(Speed)

plt.suptitle("How2matplotlib.com - Speed Unit Conversion")
plt.show()
这个例子展示了如何使用update_units()函数来处理速度这种复合单位,实现米/秒和千米/小时之间的转换。
9. 在3D图表中使用update_units()
update_units()函数不仅适用于2D图表,也可以在3D图表中使用。
9.1 3D图表单位更新示例
import matplotlib.pyplot as plt
import numpy as np
from mpl_toolkits.mplot3d import Axes3D

class CustomUnit:
    def __init__(self, value):
        self.value = value

    def __float__(self):
        return float(self.value)

    def __str__(self):
        return f"{self.value} How2matplotlib.com"

fig = plt.figure()
ax = fig.add_subplot(111, projection='3d')

x = [CustomUnit(i) for i in range(5)]
y = [CustomUnit(i) for i in range(5)]
z = [[i+j for j in range(5)] for i in range(5)]

ax.plot_surface(np.array([[float(i) for i in x]]*5),
                np.array([[float(i) for i in y]]*5).T,
                np.array(z))

ax.xaxis.update_units(CustomUnit)
ax.yaxis.update_units(CustomUnit)

ax.set_xlabel('X axis')
ax.set_ylabel('Y axis')
ax.set_zlabel('Z axis')

plt.title("3D Plot with Custom Units")
plt.show()
Output:
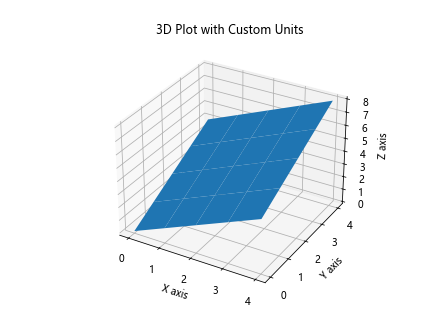
这个例子展示了如何在3D图表中使用update_units()函数来更新x轴和y轴的单位。
10. 处理极坐标系
update_units()函数也可以用于极坐标系图表,帮助我们更好地表示角度和半径的单位。
10.1 极坐标系单位更新示例
import matplotlib.pyplot as plt
import numpy as np

class AngleUnit:
    def __init__(self, value):
        self.value = value

    def __float__(self):
        return float(self.value)

    def __str__(self):
        return f"{self.value}° How2matplotlib.com"

fig, ax = plt.subplots(subplot_kw=dict(projection='polar'))

theta = np.linspace(0, 2*np.pi, 8, endpoint=False)
radius = np.array([AngleUnit(r) for r in range(8)])

ax.plot(theta, radius)
ax.set_rlabel_position(0)
ax.yaxis.update_units(AngleUnit)

plt.title("Polar Plot with Custom Angle Units")
plt.show()
Output:
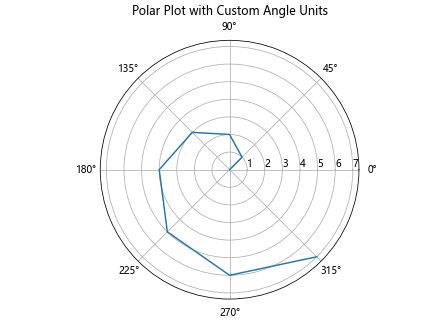
这个例子展示了如何在极坐标系图表中使用update_units()函数来更新角度单位。
11. 在动画中使用update_units()
update_units()函数也可以在动画中使用,实现单位的动态变化效果。
11.1 动画单位更新示例
import matplotlib.pyplot as plt
import matplotlib.animation as animation
import numpy as np

class DynamicUnit:
    def __init__(self, scale=1):
        self.scale = scale

    def __call__(self, x, pos):
        return f"{x*self.scale:.2f} How2matplotlib.com"

fig, ax = plt.subplots()
x = np.linspace(0, 2*np.pi, 100)
line, = ax.plot(x, np.sin(x))

def animate(i):
    line.set_ydata(np.sin(x + i/10))
    ax.xaxis.set_major_formatter(DynamicUnit(1 + i/10))
    ax.xaxis.update_units(DynamicUnit(1 + i/10))
    return line,

ani = animation.FuncAnimation(fig, animate, frames=100, interval=50, blit=True)
plt.title("How2matplotlib.com - Animated Unit Update")
plt.show()
Output:
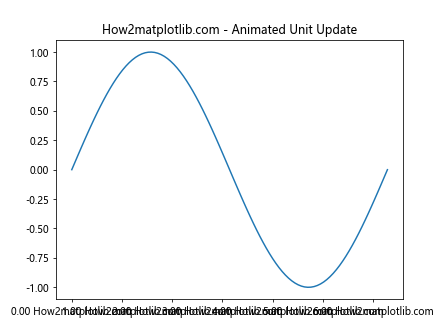
这个例子展示了如何在动画中使用update_units()函数来动态更新x轴的单位。随着动画的进行,x轴的单位会逐渐变化。
12. 处理不同数据类型的单位
update_units()函数可以处理各种不同类型的数据,包括字符串、日期时间等。
12.1 混合数据类型示例
import matplotlib.pyplot as plt
import matplotlib.dates as mdates
import datetime

class MixedUnit:
    def __init__(self, value):
        self.value = value

    def __str__(self):
        if isinstance(self.value, datetime.datetime):
            return self.value.strftime("%Y-%m-%d")
        elif isinstance(self.value, str):
            return f"{self.value} How2matplotlib.com"
        else:
            return str(self.value)

dates = [datetime.datetime(2023, 1, 1) + datetime.timedelta(days=i) for i in range(5)]
categories = ['A', 'B', 'C', 'D', 'E']
values = [10, 20, 15, 25, 30]

fig, (ax1, ax2) = plt.subplots(1, 2, figsize=(12, 5))

ax1.plot(dates, values, 'ro-')
ax1.xaxis.set_major_formatter(mdates.DateFormatter('%Y-%m-%d'))
ax1.xaxis.update_units(MixedUnit)

ax2.bar(categories, values)
ax2.xaxis.update_units(MixedUnit)

plt.suptitle("Mixed Data Types with update_units()")
plt.show()
Output:
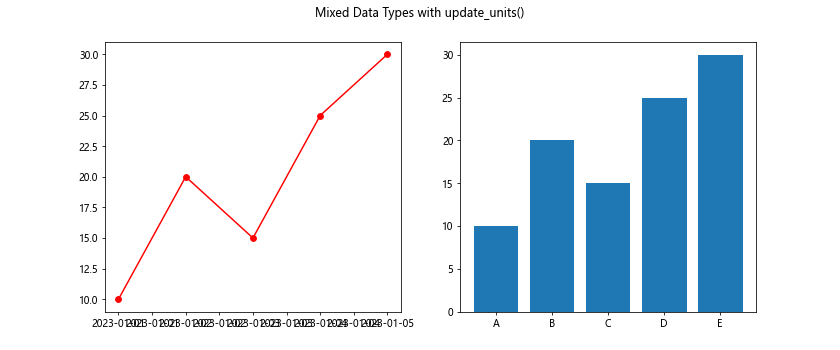
这个例子展示了如何使用update_units()函数来处理日期和字符串类型的数据。
13. 自定义刻度标签
update_units()函数可以与自定义刻度标签结合使用,以创建更具信息性的图表。
13.1 自定义刻度标签示例
import matplotlib.pyplot as plt
import numpy as np

class CustomLabel:
    def __init__(self, value, unit=''):
        self.value = value
        self.unit = unit

    def __str__(self):
        return f"{self.value}{self.unit} How2matplotlib.com"

x = np.linspace(0, 10, 11)
y = x**2

fig, ax = plt.subplots()
ax.plot(x, y)

custom_labels = [CustomLabel(i, 'km') for i in range(11)]
ax.set_xticks(x)
ax.set_xticklabels(custom_labels)
ax.xaxis.update_units(CustomLabel)

plt.title("Custom Tick Labels with update_units()")
plt.show()
Output:
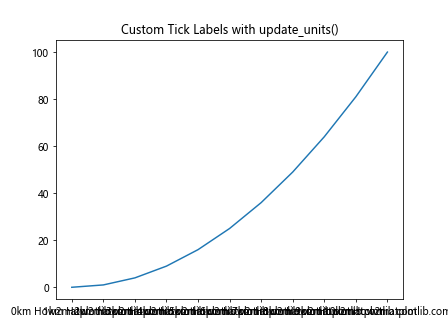
这个例子展示了如何创建自定义的刻度标签,并使用update_units()函数来更新x轴的单位显示。
14. 在子图中使用update_units()
当使用多个子图时,我们可以为每个子图单独设置单位。
14.1 多子图单位更新示例
import matplotlib.pyplot as plt
import numpy as np

class UnitA:
    def __init__(self, value):
        self.value = value

    def __str__(self):
        return f"{self.value}A How2matplotlib.com"

class UnitB:
    def __init__(self, value):
        self.value = value

    def __str__(self):
        return f"{self.value}B How2matplotlib.com"

x = np.linspace(0, 10, 100)
y1 = np.sin(x)
y2 = np.cos(x)

fig, (ax1, ax2) = plt.subplots(1, 2, figsize=(12, 5))

ax1.plot(x, y1)
ax1.xaxis.update_units(UnitA)
ax1.set_title("Subplot with Unit A")

ax2.plot(x, y2)
ax2.xaxis.update_units(UnitB)
ax2.set_title("Subplot with Unit B")

plt.suptitle("Multiple Subplots with Different Units")
plt.show()
Output:
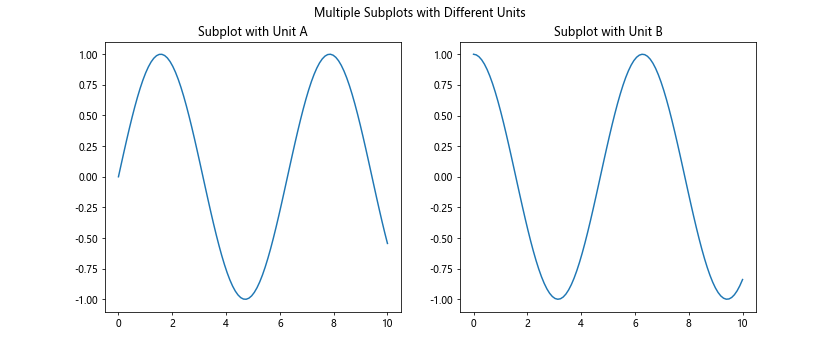
这个例子展示了如何在不同的子图中使用update_units()函数来设置不同的单位。
15. 处理对数刻度
update_units()函数也可以与对数刻度一起使用,以更好地表示跨越多个数量级的数据。
15.1 对数刻度单位更新示例
import matplotlib.pyplot as plt
import numpy as np

class LogUnit:
    def __init__(self, value):
        self.value = value

    def __str__(self):
        return f"10^{int(np.log10(self.value))} How2matplotlib.com"

x = np.logspace(0, 5, 6)
y = x**2

fig, ax = plt.subplots()
ax.plot(x, y)
ax.set_xscale('log')
ax.set_yscale('log')

ax.xaxis.update_units(LogUnit)
ax.yaxis.update_units(LogUnit)

plt.title("Log Scale with Custom Units")
plt.show()
Output:
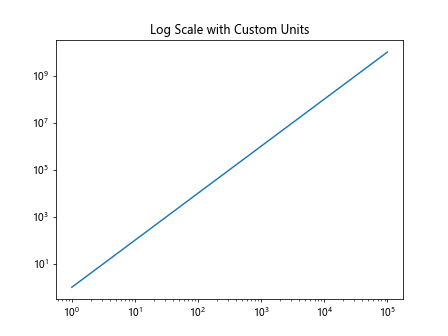
这个例子展示了如何在对数刻度图表中使用update_units()函数来自定义单位显示。
结论
axis.Axis.update_units()函数是Matplotlib库中一个强大而灵活的工具,它允许我们自定义和动态更新图表的单位显示。通过本文的详细介绍和丰富的示例,我们了解了如何在各种场景下使用这个函数,包括处理自定义单位、动态更新、处理不同数据类型、3D图表、极坐标系、动画等。
掌握update_units()函数的使用可以帮助我们创建更加清晰、信息丰富的数据可视化图表。无论是处理简单的数值数据,还是复杂的时间序列或科学数据,update_units()函数都能为我们提供灵活的单位管理解决方案。
在实际应用中,我们应该根据数据的特性和可视化的目的,合理地使用update_units()函数。通过适当的单位设置,我们可以使图表更易理解,更好地传达数据背后的信息。同时,结合Matplotlib的其他功能,如自定义格式化器、刻度定位器等,我们可以创建出既美观又专业的数据可视化作品。
总之,axis.Axis.update_units()函数是Matplotlib库中不可或缺的一部分,掌握它的使用将大大提升我们的数据可视化能力。
 极客教程
极客教程