Matplotlib中的Axis.format_cursor_data()函数:自定义光标数据格式化
参考:Matplotlib.axis.Axis.format_cursor_data() function in Python
Matplotlib是Python中最流行的数据可视化库之一,它提供了丰富的绘图功能和自定义选项。在Matplotlib中,Axis.format_cursor_data()函数是一个强大的工具,用于自定义光标悬停时显示的数据格式。本文将深入探讨这个函数的用法、特性和应用场景,帮助你更好地控制和优化数据可视化的交互体验。
1. Axis.format_cursor_data()函数简介
Axis.format_cursor_data()函数是Matplotlib库中axis.Axis类的一个方法。它的主要作用是自定义当鼠标悬停在图表上时,光标位置所对应的数据值的显示格式。通过使用这个函数,我们可以根据需要调整数据的显示精度、单位或其他格式化选项,从而提供更加直观和有意义的信息给用户。
让我们从一个简单的例子开始,了解这个函数的基本用法:
import matplotlib.pyplot as plt
import numpy as np

# 创建数据
x = np.linspace(0, 10, 100)
y = np.sin(x)

# 创建图表
fig, ax = plt.subplots()
ax.plot(x, y, label='sin(x)')

# 自定义光标数据格式
def format_coord(x, y):
    return f'x={x:.2f}, y={y:.2f} (how2matplotlib.com)'

ax.format_coord = format_coord

plt.title('Custom Cursor Data Format')
plt.legend()
plt.show()
Output:
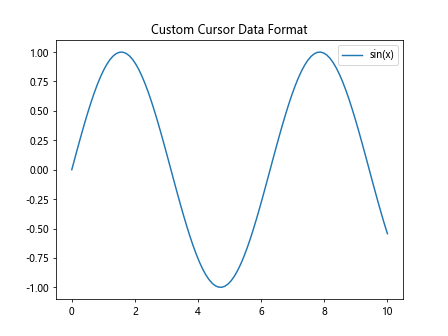
在这个例子中,我们定义了一个format_coord函数,它接受x和y坐标作为参数,并返回一个格式化的字符串。然后,我们将这个函数赋值给ax.format_coord,从而自定义了光标数据的显示格式。
2. 格式化数值精度
一个常见的需求是调整数值的显示精度。Axis.format_cursor_data()函数允许我们灵活地控制小数点后的位数。以下是一个展示不同精度的例子:
import matplotlib.pyplot as plt
import numpy as np

x = np.linspace(0, 2*np.pi, 100)
y = np.sin(x)

fig, (ax1, ax2) = plt.subplots(1, 2, figsize=(12, 5))

ax1.plot(x, y)
ax1.set_title('2 Decimal Places')
ax1.format_coord = lambda x, y: f'x={x:.2f}, y={y:.2f} (how2matplotlib.com)'

ax2.plot(x, y)
ax2.set_title('4 Decimal Places')
ax2.format_coord = lambda x, y: f'x={x:.4f}, y={y:.4f} (how2matplotlib.com)'

plt.tight_layout()
plt.show()
Output:
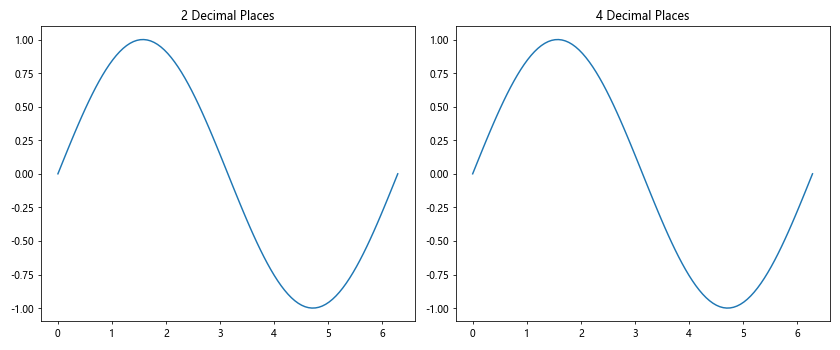
在这个例子中,我们创建了两个子图,分别显示2位和4位小数。通过使用lambda函数,我们可以简洁地定义格式化函数。
3. 添加单位和标签
在某些情况下,我们可能希望在光标数据中包含单位或其他描述性标签。Axis.format_cursor_data()函数使这变得非常简单:
import matplotlib.pyplot as plt
import numpy as np

t = np.linspace(0, 10, 100)
v = 10 * np.sin(t)

fig, ax = plt.subplots()
ax.plot(t, v)

def format_coord(x, y):
    return f'Time: {x:.2f} s, Velocity: {y:.2f} m/s (how2matplotlib.com)'

ax.format_coord = format_coord

plt.title('Velocity vs Time')
plt.xlabel('Time (s)')
plt.ylabel('Velocity (m/s)')
plt.show()
Output:
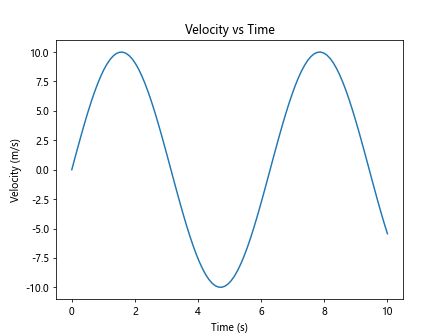
这个例子展示了如何在光标数据中添加时间和速度的单位,使得数据更加易于理解。
4. 条件格式化
有时,我们可能需要根据不同的条件来格式化数据。Axis.format_cursor_data()函数允许我们实现这种灵活的格式化:
import matplotlib.pyplot as plt
import numpy as np

x = np.linspace(0, 10, 100)
y1 = np.sin(x)
y2 = np.cos(x)

fig, ax = plt.subplots()
ax.plot(x, y1, label='sin(x)')
ax.plot(x, y2, label='cos(x)')

def format_coord(x, y):
    if abs(y) < 0.5:
        return f'x={x:.2f}, y={y:.2f} (Low amplitude) (how2matplotlib.com)'
    else:
        return f'x={x:.2f}, y={y:.2f} (High amplitude) (how2matplotlib.com)'

ax.format_coord = format_coord

plt.title('Conditional Formatting')
plt.legend()
plt.show()
Output:
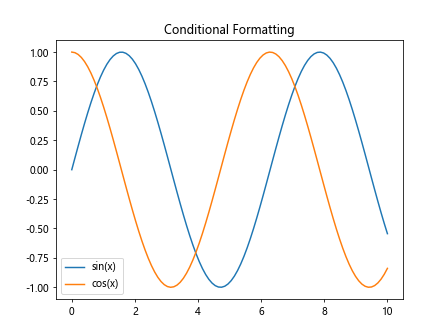
在这个例子中,我们根据y值的绝对值是否小于0.5来添加不同的描述。这种条件格式化可以帮助用户快速识别特定的数据特征。
5. 多曲线数据显示
当图表中包含多条曲线时,我们可能希望同时显示所有曲线在当前x坐标下的y值。以下是一个实现这一功能的例子:
import matplotlib.pyplot as plt
import numpy as np

x = np.linspace(0, 2*np.pi, 100)
y1 = np.sin(x)
y2 = np.cos(x)
y3 = np.tan(x)

fig, ax = plt.subplots()
line1, = ax.plot(x, y1, label='sin(x)')
line2, = ax.plot(x, y2, label='cos(x)')
line3, = ax.plot(x, y3, label='tan(x)')

def format_coord(x, y):
    x_val = np.argmin(np.abs(line1.get_xdata() - x))
    return (f'x={x:.2f}, '
            f'sin(x)={y1[x_val]:.2f}, '
            f'cos(x)={y2[x_val]:.2f}, '
            f'tan(x)={y3[x_val]:.2f} '
            f'(how2matplotlib.com)')

ax.format_coord = format_coord

plt.title('Multiple Curve Data Display')
plt.legend()
plt.show()
Output:
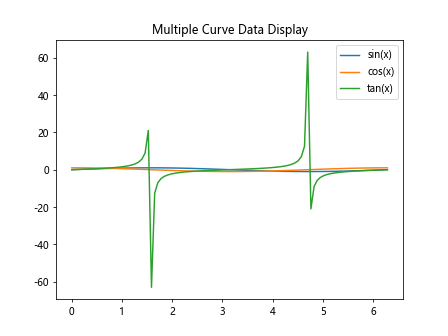
这个例子展示了如何在光标数据中同时显示三个不同函数的值,使得用户可以方便地比较不同曲线在同一x坐标下的值。
6. 日期时间格式化
对于时间序列数据,我们可能需要将x轴的数值转换为易读的日期时间格式。以下是一个使用Axis.format_cursor_data()函数来格式化日期时间的例子:
import matplotlib.pyplot as plt
import numpy as np
from datetime import datetime, timedelta

# 创建时间序列数据
start_date = datetime(2023, 1, 1)
dates = [start_date + timedelta(days=i) for i in range(100)]
values = np.cumsum(np.random.randn(100))

fig, ax = plt.subplots()
ax.plot(dates, values)

def format_coord(x, y):
    date = matplotlib.dates.num2date(x)
    return f'Date: {date:%Y-%m-%d}, Value: {y:.2f} (how2matplotlib.com)'

ax.format_coord = format_coord

plt.title('Time Series Data')
plt.xlabel('Date')
plt.ylabel('Value')
fig.autofmt_xdate()  # 自动格式化x轴日期标签
plt.show()
Output:
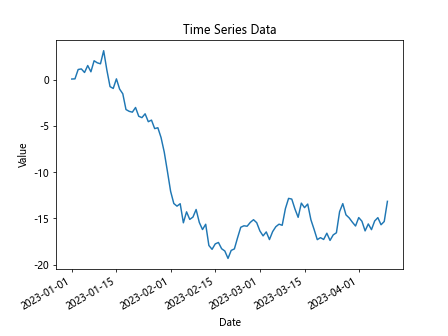
这个例子展示了如何将x轴的数值转换为易读的日期格式,使得用户可以直观地看到每个数据点对应的具体日期。
7. 极坐标系中的格式化
在极坐标系中,我们可能需要将笛卡尔坐标转换为极坐标来显示。以下是一个在极坐标系中使用Axis.format_cursor_data()函数的例子:
import matplotlib.pyplot as plt
import numpy as np

theta = np.linspace(0, 2*np.pi, 100)
r = 2 + np.sin(5*theta)

fig, ax = plt.subplots(subplot_kw=dict(projection='polar'))
ax.plot(theta, r)

def format_coord(theta, r):
    theta_deg = np.degrees(theta)
    return f'θ={theta_deg:.2f}°, r={r:.2f} (how2matplotlib.com)'

ax.format_coord = format_coord

plt.title('Polar Coordinate Formatting')
plt.show()
Output:
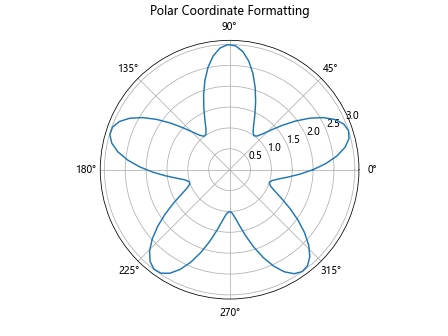
这个例子展示了如何在极坐标系中格式化光标数据,将弧度转换为角度,并显示半径值。
8. 对数刻度格式化
当使用对数刻度时,我们可能希望显示真实的数值而不是对数值。以下是一个在对数刻度上使用Axis.format_cursor_data()函数的例子:
import matplotlib.pyplot as plt
import numpy as np

x = np.logspace(0, 5, 100)
y = x**2

fig, ax = plt.subplots()
ax.loglog(x, y)

def format_coord(x, y):
    return f'x={10**x:.2e}, y={10**y:.2e} (how2matplotlib.com)'

ax.format_coord = format_coord

plt.title('Logarithmic Scale Formatting')
plt.xlabel('x')
plt.ylabel('y')
plt.show()
Output:
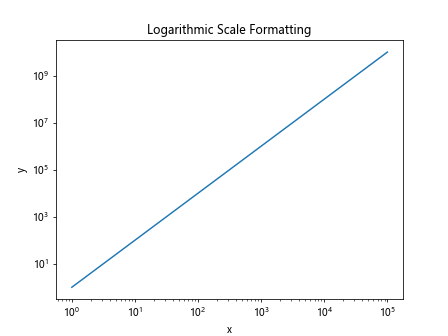
这个例子展示了如何在对数刻度上显示真实的数值,使用科学计数法来表示大数值。
9. 3D图表中的格式化
对于3D图表,我们需要格式化三个坐标值。以下是一个在3D图表中使用Axis.format_cursor_data()函数的例子:
import matplotlib.pyplot as plt
import numpy as np

fig = plt.figure()
ax = fig.add_subplot(111, projection='3d')

x = np.linspace(-5, 5, 100)
y = np.linspace(-5, 5, 100)
X, Y = np.meshgrid(x, y)
Z = np.sin(np.sqrt(X**2 + Y**2))

surf = ax.plot_surface(X, Y, Z, cmap='viridis')

def format_coord(x, y, z):
    return f'x={x:.2f}, y={y:.2f}, z={z:.2f} (how2matplotlib.com)'

ax.format_coord = format_coord

plt.title('3D Surface Plot Formatting')
plt.show()
Output:
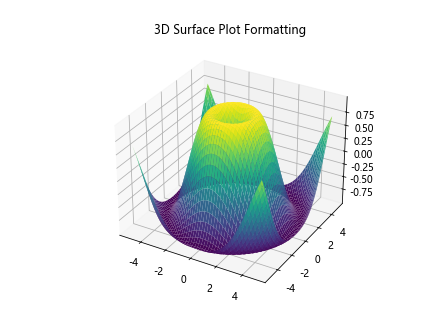
这个例子展示了如何在3D图表中格式化x、y和z三个坐标值,使得用户可以直观地了解3D空间中的数据点位置。
10. 自定义颜色映射格式化
当使用颜色映射(colormap)时,我们可能希望在光标数据中显示颜色值。以下是一个结合颜色映射使用Axis.format_cursor_data()函数的例子:
import matplotlib.pyplot as plt
import numpy as np

x = np.linspace(0, 10, 100)
y = np.linspace(0, 10, 100)
X, Y = np.meshgrid(x, y)
Z = np.sin(X) * np.cos(Y)

fig, ax = plt.subplots()
im = ax.imshow(Z, extent=[0, 10, 0, 10], origin='lower', cmap='viridis')
plt.colorbar(im)

def format_coord(x, y):
    if 0 <= x < 10 and 0 <= y < 10:
        z = Z[int(y*10), int(x*10)]
        return f'x={x:.2f}, y={y:.2f}, z={z:.2f}, color={plt.cm.viridis(z)} (how2matplotlib.com)'
    else:
        return 'x={:.2f}, y={:.2f} (how2matplotlib.com)'.format(x, y)

ax.format_coord = format_coord

plt.title('Colormap Formatting')
plt.show()
Output:
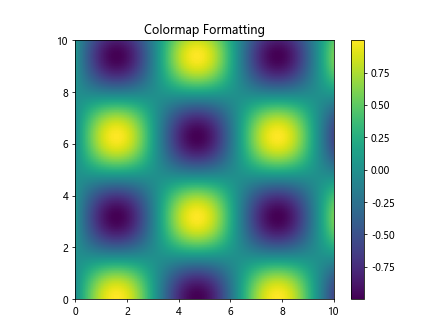
这个例子展示了如何在光标数据中包含颜色值信息,使得用户可以直观地了解每个数据点对应的颜色。
11. 多子图格式化
当我们有多个子图时,可能需要为每个子图设置不同的格式化函数。以下是一个包含多个子图并使用不同Axis.format_cursor_data()函数的例子:
import matplotlib.pyplot as plt
import numpy as np

fig, (ax1, ax2) = plt.subplots(1, 2, figsize=(12, 5))

x = np.linspace(0, 10, 100)
y1 = np.sin(x)
y2 = np.exp(x/10)

ax1.plot(x, y1)
ax2.plot(x, y2)

def format_coord1(x, y):
    return f'x={x:.2f}, sin(x)={y:.2f} (how2matplotlib.com)'

def format_coord2(x, y):
    return f'x={x:.2f}, exp(x/10)={y:.2e} (how2matplotlib.com)'

ax1.format_coord = format_coord1
ax2.format_coord = format_coord2

ax1.set_title('Sine Function')
ax2.set_title('Exponential Function')

plt.tight_layout()
plt.show()
Output:
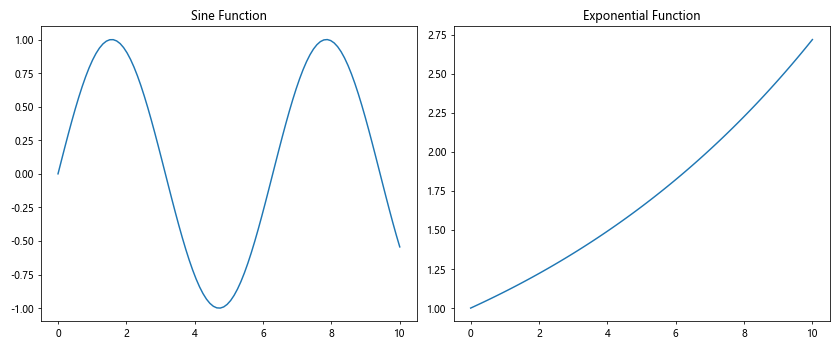
这个例子展示了如何为不同的子图设置不同的格式化函数,以适应不同类型的数据和显示需求。
12. 动态更新格式化
在某些情况下,我们可能需要根据用户的交互动态更新格式化函数。以下是一个展示如何动态更新格式化函数的例子:
import matplotlib.pyplot as plt
import numpy as np

x = np.linspace(0, 10, 100)
y = np.sin(x)

fig, ax = plt.subplots()
line, = ax.plot(x, y)

precision = 2

def format_coord(x, y):
    global precision
    return f'x={x:.{precision}f}, y={y:.{precision}f} (how2matplotlib.com)'

ax.format_coord = format_coord

def on_key(event):
    global precision
    if event.key == '+':
        precision += 1
    elif event.key == '-':
        precision = max(0, precision - 1)
    plt.title(f'Precision: {precision}')
    fig.canvas.draw()

fig.canvas.mpl_connect('key_press_event', on_key)

plt.title(f'Precision: {precision}')
plt.show()
Output:
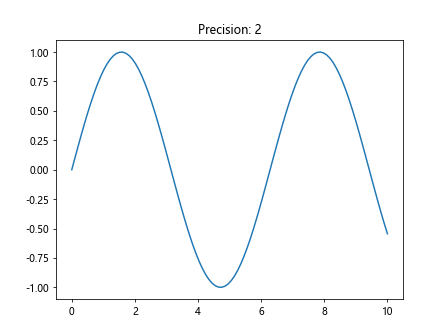
在这个例子中,我们可以通过按”+”和”-“键来动态调整显示精度。这种方法允许用户在查看数据时实时调整格式化选项。
13. 格式化离散数据
对于离散数据或分类数据,我们可能需要特殊的格式化方法。以下是一个处理离散数据的例子:
import matplotlib.pyplot as plt
import numpy as np

categories = ['A', 'B', 'C', 'D', 'E']
values = [3, 7, 2, 5, 8]

fig, ax = plt.subplots()
bars = ax.bar(categories, values)

def format_coord(x, y):
    index = int(x)
    if 0 <= index < len(categories):
        category = categories[index]
        value = values[index]
        return f'Category: {category}, Value: {value} (how2matplotlib.com)'
    return f'x={x:.2f}, y={y:.2f} (how2matplotlib.com)'

ax.format_coord = format_coord

plt.title('Discrete Data Formatting')
plt.show()
Output:
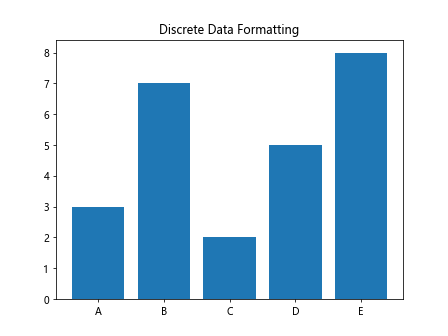
这个例子展示了如何为柱状图等离散数据类型创建自定义的格式化函数,显示类别名称和对应的值。
14. 格式化极值点
在某些情况下,我们可能希望突出显示数据中的极值点。以下是一个识别和格式化极值点的例子:
import matplotlib.pyplot as plt
import numpy as np

x = np.linspace(0, 4*np.pi, 1000)
y = np.sin(x)

fig, ax = plt.subplots()
ax.plot(x, y)

def format_coord(x, y):
    index = np.argmin(np.abs(x - ax.lines[0].get_xdata()))
    current_y = ax.lines[0].get_ydata()[index]
    if abs(current_y) > 0.99:
        return f'x={x:.2f}, y={current_y:.2f} (Extreme point!) (how2matplotlib.com)'
    return f'x={x:.2f}, y={current_y:.2f} (how2matplotlib.com)'

ax.format_coord = format_coord

plt.title('Extreme Point Formatting')
plt.show()
Output:
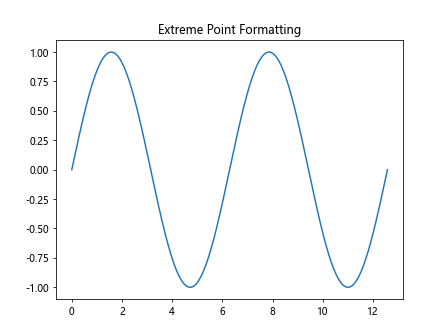
这个例子展示了如何识别正弦波的极值点(接近1或-1的点),并在光标数据中特别标注这些点。
15. 格式化复数数据
当处理复数数据时,我们可能需要同时显示实部和虚部。以下是一个处理复数数据的例子:
import matplotlib.pyplot as plt
import numpy as np

t = np.linspace(0, 10, 100)
z = np.exp(1j * t)

fig, ax = plt.subplots()
ax.plot(z.real, z.imag)

def format_coord(x, y):
    z = complex(x, y)
    return f'Re(z)={x:.2f}, Im(z)={y:.2f}, |z|={abs(z):.2f}, arg(z)={np.angle(z, deg=True):.2f}° (how2matplotlib.com)'

ax.format_coord = format_coord

plt.title('Complex Number Formatting')
plt.xlabel('Real Part')
plt.ylabel('Imaginary Part')
plt.show()
Output:
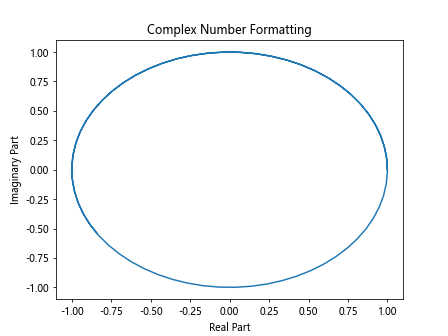
这个例子展示了如何格式化复平面上的点,显示复数的实部、虚部、模和辐角。
16. 格式化带误差线的数据
当数据包含误差线时,我们可能希望在光标数据中显示误差范围。以下是一个带误差线数据的格式化例子:
import matplotlib.pyplot as plt
import numpy as np

x = np.linspace(0, 10, 10)
y = np.sin(x)
yerr = 0.1 + 0.2 * np.random.rand(len(x))

fig, ax = plt.subplots()
ax.errorbar(x, y, yerr=yerr, fmt='o')

def format_coord(x, y):
    index = np.argmin(np.abs(x - ax.lines[0].get_xdata()))
    true_y = ax.lines[0].get_ydata()[index]
    error = yerr[index]
    return f'x={x:.2f}, y={true_y:.2f} ± {error:.2f} (how2matplotlib.com)'

ax.format_coord = format_coord

plt.title('Error Bar Formatting')
plt.show()
Output:
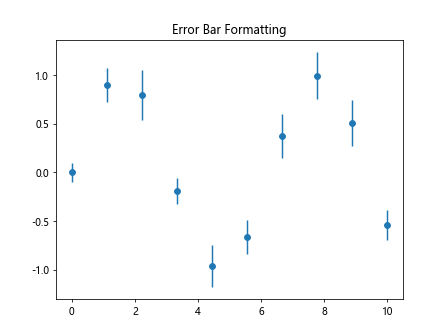
这个例子展示了如何在光标数据中包含误差信息,使用户能够同时看到数据点的值和其对应的误差范围。
17. 格式化热图数据
对于热图(heatmap)数据,我们可能需要显示具体的单元格值和颜色信息。以下是一个热图数据格式化的例子:
import matplotlib.pyplot as plt
import numpy as np

data = np.random.rand(10, 10)

fig, ax = plt.subplots()
im = ax.imshow(data, cmap='viridis')
plt.colorbar(im)

def format_coord(x, y):
    if 0 <= int(x) < data.shape[1] and 0 <= int(y) < data.shape[0]:
        z = data[int(y), int(x)]
        return f'x={int(x)}, y={int(y)}, value={z:.2f}, color={plt.cm.viridis(z)} (how2matplotlib.com)'
    return f'x={x:.2f}, y={y:.2f} (how2matplotlib.com)'

ax.format_coord = format_coord

plt.title('Heatmap Formatting')
plt.show()
Output:
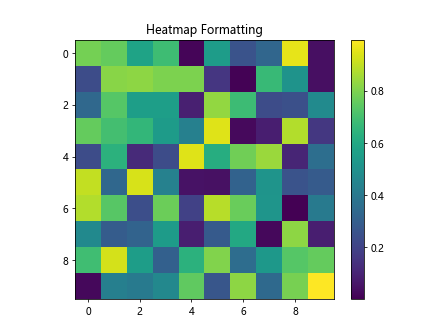
这个例子展示了如何在热图中格式化光标数据,显示具体的单元格坐标、值和对应的颜色信息。
18. 格式化极坐标系中的多条曲线
在极坐标系中绘制多条曲线时,我们可能需要同时显示多条曲线的数据。以下是一个在极坐标系中格式化多条曲线数据的例子:
import matplotlib.pyplot as plt
import numpy as np

theta = np.linspace(0, 2*np.pi, 100)
r1 = 2 + np.sin(2*theta)
r2 = 1 + np.cos(3*theta)

fig, ax = plt.subplots(subplot_kw=dict(projection='polar'))
line1, = ax.plot(theta, r1, label='Curve 1')
line2, = ax.plot(theta, r2, label='Curve 2')

def format_coord(theta, r):
    theta_deg = np.degrees(theta)
    index = np.argmin(np.abs(theta - line1.get_xdata()))
    r1_val = line1.get_ydata()[index]
    r2_val = line2.get_ydata()[index]
    return f'θ={theta_deg:.2f}°, r1={r1_val:.2f}, r2={r2_val:.2f} (how2matplotlib.com)'

ax.format_coord = format_coord

plt.title('Multiple Curves in Polar Coordinates')
plt.legend()
plt.show()
Output:
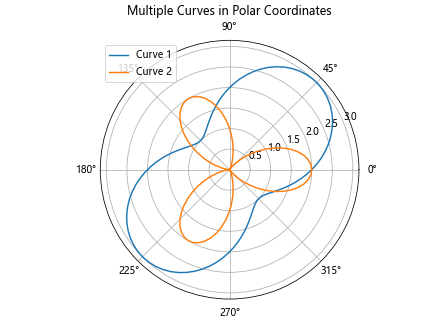
这个例子展示了如何在极坐标系中同时显示多条曲线的数据,使用户能够方便地比较不同曲线在相同角度下的半径值。
19. 格式化带有文本注释的数据
当图表中包含文本注释时,我们可能希望在光标悬停在注释附近时显示完整的注释内容。以下是一个带有文本注释的数据格式化例子:
import matplotlib.pyplot as plt
import numpy as np

x = np.linspace(0, 10, 100)
y = np.sin(x)

fig, ax = plt.subplots()
ax.plot(x, y)

annotations = [
    (2, np.sin(2), "Point A"),
    (5, np.sin(5), "Point B"),
    (8, np.sin(8), "Point C")
]

for x_pos, y_pos, text in annotations:
    ax.annotate(text, (x_pos, y_pos), xytext=(5, 5), textcoords='offset points')

def format_coord(x, y):
    for x_pos, y_pos, text in annotations:
        if abs(x - x_pos) < 0.1 and abs(y - y_pos) < 0.1:
            return f'x={x:.2f}, y={y:.2f}, Annotation: {text} (how2matplotlib.com)'
    return f'x={x:.2f}, y={y:.2f} (how2matplotlib.com)'

ax.format_coord = format_coord

plt.title('Formatting with Text Annotations')
plt.show()
Output:
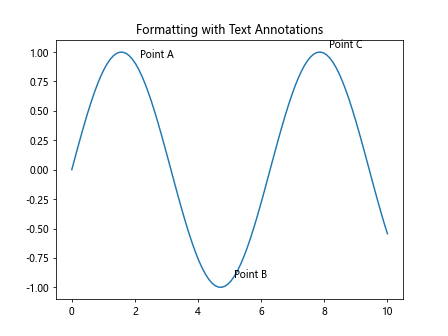
这个例子展示了如何在光标接近注释点时显示完整的注释内容,提供更丰富的上下文信息。
20. 格式化多Y轴数据
当图表包含多个Y轴时,我们可能需要同时显示不同Y轴上的数据。以下是一个格式化多Y轴数据的例子:
import matplotlib.pyplot as plt
import numpy as np

x = np.linspace(0, 10, 100)
y1 = np.sin(x)
y2 = np.exp(x/10)

fig, ax1 = plt.subplots()
ax2 = ax1.twinx()

line1, = ax1.plot(x, y1, 'b-', label='sin(x)')
line2, = ax2.plot(x, y2, 'r-', label='exp(x/10)')

def format_coord(x, y):
    index = np.argmin(np.abs(x - line1.get_xdata()))
    y1_val = line1.get_ydata()[index]
    y2_val = line2.get_ydata()[index]
    return f'x={x:.2f}, y1={y1_val:.2f}, y2={y2_val:.2f} (how2matplotlib.com)'

ax1.format_coord = format_coord

ax1.set_xlabel('x')
ax1.set_ylabel('sin(x)', color='b')
ax2.set_ylabel('exp(x/10)', color='r')

plt.title('Multiple Y-Axes Formatting')
plt.show()
Output:
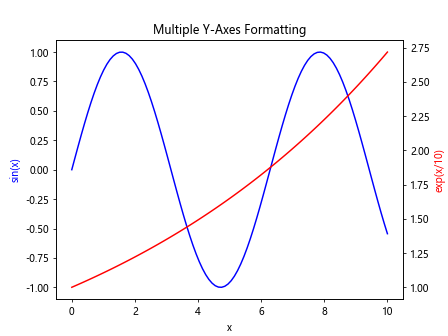
这个例子展示了如何在有多个Y轴的图表中同时显示不同Y轴上的数据值,使用户能够方便地比较不同尺度的数据。
总结:
通过本文的详细介绍和丰富的示例,我们深入探讨了Matplotlib中Axis.format_cursor_data()函数的多种用法和应用场景。这个强大的函数允许我们自定义光标数据的显示格式,从而大大提升了数据可视化的交互体验。
我们学习了如何调整数值精度、添加单位和标签、实现条件格式化、处理多曲线数据、格式化日期时间、处理极坐标和3D图表、自定义颜色映射格式化、处理多子图、动态更新格式化函数、处理离散数据和复数数据等多种情况。这些技巧和方法可以帮助我们创建更加信息丰富、用户友好的数据可视化图表。
通过灵活运用Axis.format_cursor_data()函数,我们可以为不同类型的数据和图表定制最适合的光标数据显示方式,从而使得用户能够更直观、更准确地理解和分析数据。这不仅提高了数据可视化的质量,也增强了用户与图表交互的体验。
在实际应用中,我们可以根据具体的数据特征和可视化需求,选择合适的格式化方法,或者将多种方法结合使用,以创建出最适合自己项目的自定义光标数据显示效果。通过这些技巧,我们可以充分发挥Matplotlib的强大功能,创造出更加专业和有吸引力的数据可视化作品。
 极客教程
极客教程