Matplotlib Tab Colors:轻松掌握预定义颜色方案
Matplotlib是Python中最流行的数据可视化库之一,它提供了丰富的绘图功能和自定义选项。在进行数据可视化时,选择合适的颜色方案对于创建美观且易于理解的图表至关重要。Matplotlib提供了一系列预定义的颜色方案,其中”Tab Colors”是一组特别设计的颜色,旨在提供清晰、易区分且视觉上令人愉悦的配色方案。本文将深入探讨Matplotlib的Tab Colors,介绍它们的特点、使用方法以及在不同类型图表中的应用。
什么是Tab Colors?
Tab Colors是Matplotlib中的一组预定义颜色,专门设计用于数据可视化。这组颜色包含了10种不同的颜色,每种颜色都有其独特的名称和RGB值。Tab Colors的设计理念是提供一组相互协调、易于区分且视觉上令人愉悦的颜色,适用于各种类型的图表和数据可视化场景。
以下是Tab Colors中包含的10种颜色及其对应的名称:
- tab:blue
- tab:orange
- tab:green
- tab:red
- tab:purple
- tab:brown
- tab:pink
- tab:gray
- tab:olive
- tab:cyan
这些颜色经过精心选择和调整,以确保它们在各种背景下都能保持良好的可读性和区分度。
如何使用Tab Colors
在Matplotlib中使用Tab Colors非常简单。你可以通过颜色名称直接引用这些颜色,也可以使用plt.cm.tab10颜色映射来访问它们。以下是一些基本的使用方法:
1. 直接使用颜色名称
你可以在绘图函数中直接使用Tab Colors的名称来指定颜色。
import matplotlib.pyplot as plt

plt.figure(figsize=(8, 6))
plt.plot([1, 2, 3, 4], [1, 4, 2, 3], color='tab:blue', label='Line 1')
plt.plot([1, 2, 3, 4], [2, 3, 4, 1], color='tab:orange', label='Line 2')
plt.title('How to use Tab Colors in Matplotlib - how2matplotlib.com')
plt.xlabel('X-axis')
plt.ylabel('Y-axis')
plt.legend()
plt.show()
Output:
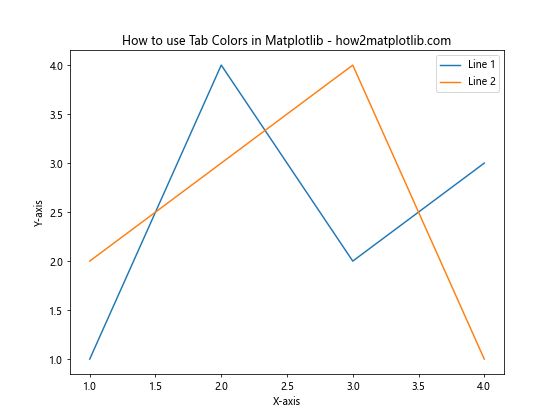
在这个例子中,我们使用tab:blue和tab:orange来为两条线设置不同的颜色。这种方法简单直接,适用于需要明确指定少量颜色的情况。
2. 使用plt.cm.tab10颜色映射
对于需要使用多种颜色的情况,可以使用plt.cm.tab10颜色映射来自动分配颜色。
import matplotlib.pyplot as plt
import numpy as np

plt.figure(figsize=(10, 6))
for i in range(10):
    plt.plot(np.arange(10), np.random.rand(10) + i,
             color=plt.cm.tab10(i),
             label=f'Line {i+1}')

plt.title('Using plt.cm.tab10 in Matplotlib - how2matplotlib.com')
plt.xlabel('X-axis')
plt.ylabel('Y-axis')
plt.legend()
plt.show()
Output:
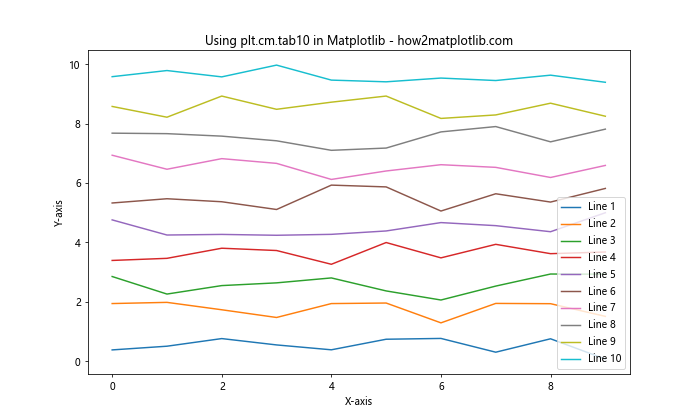
这个例子展示了如何使用plt.cm.tab10颜色映射来为10条线自动分配不同的颜色。这种方法特别适用于需要绘制多个数据系列的情况。
Tab Colors在不同类型图表中的应用
Tab Colors可以应用于Matplotlib支持的各种类型的图表中。以下是一些常见图表类型的示例:
1. 柱状图
柱状图是展示分类数据的理想选择,使用Tab Colors可以使不同类别更加醒目。
import matplotlib.pyplot as plt
import numpy as np

categories = ['A', 'B', 'C', 'D', 'E']
values = np.random.randint(10, 100, size=5)

plt.figure(figsize=(10, 6))
bars = plt.bar(categories, values, color=plt.cm.tab10(range(5)))

plt.title('Bar Chart with Tab Colors - how2matplotlib.com')
plt.xlabel('Categories')
plt.ylabel('Values')

for bar in bars:
    height = bar.get_height()
    plt.text(bar.get_x() + bar.get_width()/2., height,
             f'{height}',
             ha='center', va='bottom')

plt.show()
Output:
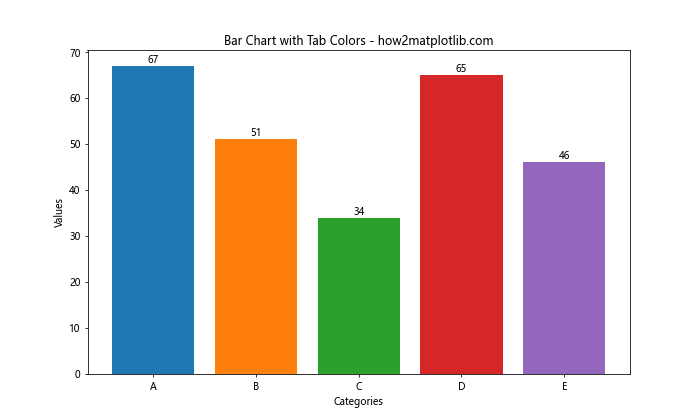
这个例子展示了如何在柱状图中使用Tab Colors。每个柱子都使用了不同的颜色,使得各个类别之间的区别更加明显。
2. 饼图
饼图是展示部分与整体关系的有效方式,Tab Colors可以帮助区分不同的扇区。
import matplotlib.pyplot as plt

sizes = [30, 25, 20, 15, 10]
labels = ['A', 'B', 'C', 'D', 'E']

plt.figure(figsize=(10, 8))
plt.pie(sizes, labels=labels, colors=plt.cm.tab10(range(5)),
        autopct='%1.1f%%', startangle=90)
plt.title('Pie Chart with Tab Colors - how2matplotlib.com')
plt.axis('equal')
plt.show()
Output:
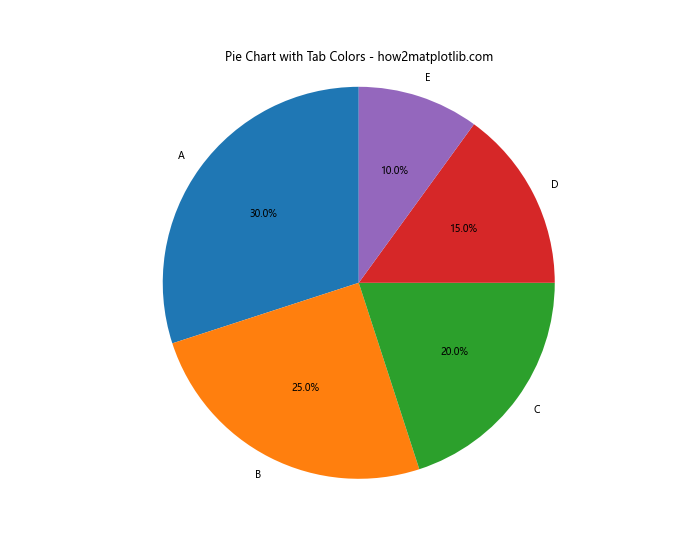
在这个饼图示例中,我们使用Tab Colors为不同的扇区着色,使得各个部分更加容易区分。
3. 散点图
散点图用于展示两个变量之间的关系,使用Tab Colors可以区分不同的数据组。
import matplotlib.pyplot as plt
import numpy as np

np.random.seed(42)
group1_x = np.random.rand(50)
group1_y = np.random.rand(50)
group2_x = np.random.rand(50) + 0.5
group2_y = np.random.rand(50) + 0.5

plt.figure(figsize=(10, 8))
plt.scatter(group1_x, group1_y, color='tab:blue', label='Group 1')
plt.scatter(group2_x, group2_y, color='tab:orange', label='Group 2')

plt.title('Scatter Plot with Tab Colors - how2matplotlib.com')
plt.xlabel('X-axis')
plt.ylabel('Y-axis')
plt.legend()
plt.show()
Output:
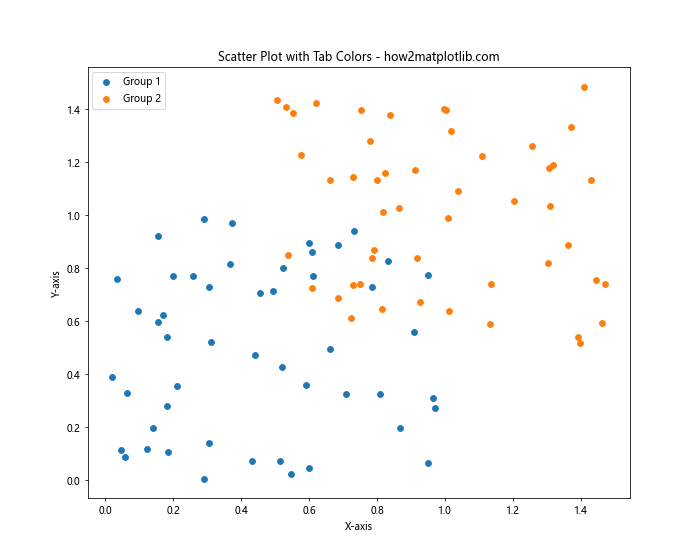
这个散点图示例展示了如何使用Tab Colors来区分两个不同的数据组。
4. 箱线图
箱线图用于显示数据分布的关键特征,Tab Colors可以帮助区分不同的数据集。
import matplotlib.pyplot as plt
import numpy as np

np.random.seed(42)
data1 = np.random.normal(100, 10, 200)
data2 = np.random.normal(90, 20, 200)
data3 = np.random.normal(110, 15, 200)

plt.figure(figsize=(10, 6))
box_plot = plt.boxplot([data1, data2, data3], patch_artist=True)

colors = ['tab:blue', 'tab:orange', 'tab:green']
for patch, color in zip(box_plot['boxes'], colors):
    patch.set_facecolor(color)

plt.title('Box Plot with Tab Colors - how2matplotlib.com')
plt.xlabel('Groups')
plt.ylabel('Values')
plt.xticks([1, 2, 3], ['Data 1', 'Data 2', 'Data 3'])
plt.show()
Output:
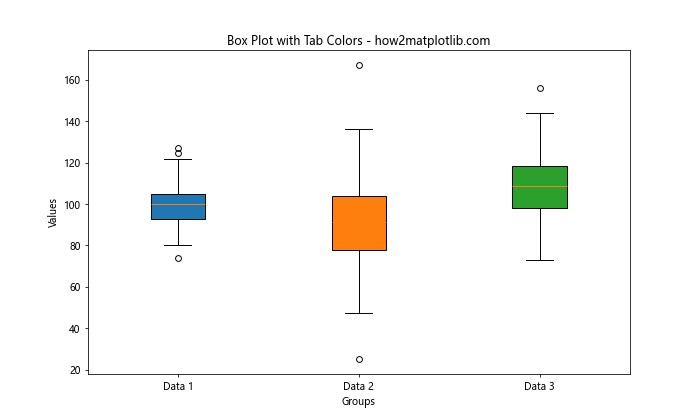
在这个箱线图示例中,我们使用Tab Colors为不同的数据集设置不同的颜色,使得各个数据集的分布特征更加清晰。
自定义Tab Colors
虽然Tab Colors提供了一组预定义的颜色,但有时你可能需要对这些颜色进行微调或创建自己的颜色方案。以下是一些自定义Tab Colors的方法:
1. 调整颜色透明度
你可以通过调整颜色的透明度来创建新的视觉效果。
import matplotlib.pyplot as plt
import numpy as np

x = np.linspace(0, 10, 100)
y1 = np.sin(x)
y2 = np.cos(x)

plt.figure(figsize=(10, 6))
plt.plot(x, y1, color='tab:blue', label='Sin')
plt.plot(x, y2, color='tab:orange', label='Cos')
plt.fill_between(x, y1, color='tab:blue', alpha=0.3)
plt.fill_between(x, y2, color='tab:orange', alpha=0.3)

plt.title('Customizing Tab Colors with Transparency - how2matplotlib.com')
plt.xlabel('X-axis')
plt.ylabel('Y-axis')
plt.legend()
plt.show()
Output:
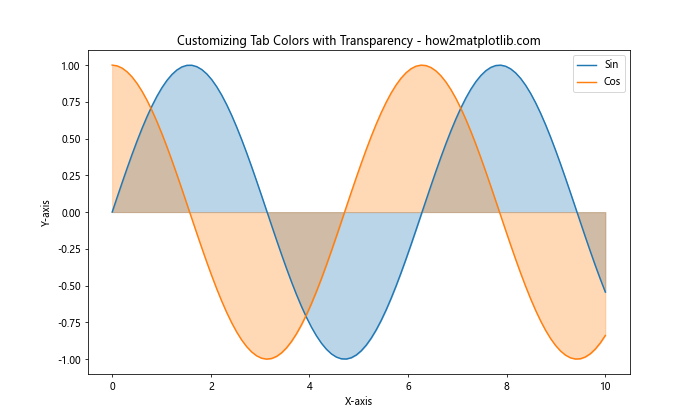
在这个例子中,我们使用alpha参数来调整填充区域的透明度,创造出半透明的效果。
2. 创建自定义颜色映射
你可以基于Tab Colors创建自己的颜色映射,以满足特定的需求。
import matplotlib.pyplot as plt
import matplotlib.colors as mcolors
import numpy as np

# 创建自定义颜色映射
custom_colors = ['tab:blue', 'tab:orange', 'tab:green', 'tab:red', 'tab:purple']
n_bins = 100
custom_cmap = mcolors.LinearSegmentedColormap.from_list('custom_cmap', custom_colors, N=n_bins)

# 生成数据
x = np.linspace(0, 10, 100)
y = np.linspace(0, 10, 100)
X, Y = np.meshgrid(x, y)
Z = np.sin(X) * np.cos(Y)

plt.figure(figsize=(10, 8))
plt.pcolormesh(X, Y, Z, cmap=custom_cmap, shading='auto')
plt.colorbar(label='Values')

plt.title('Custom Color Map Based on Tab Colors - how2matplotlib.com')
plt.xlabel('X-axis')
plt.ylabel('Y-axis')
plt.show()
Output:
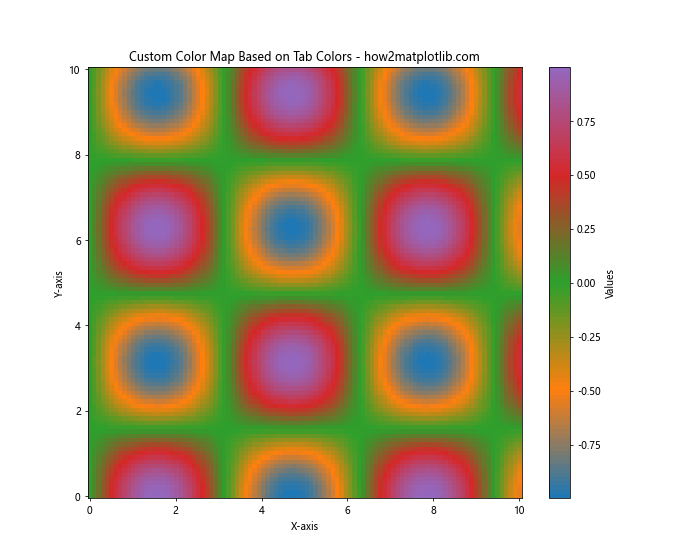
这个例子展示了如何基于Tab Colors创建自定义的颜色映射,并将其应用于热图中。
Tab Colors在多子图中的应用
当你需要在一个图形中展示多个子图时,Tab Colors可以帮助保持整体的视觉一致性。
import matplotlib.pyplot as plt
import numpy as np

fig, axs = plt.subplots(2, 2, figsize=(12, 10))
fig.suptitle('Tab Colors in Multiple Subplots - how2matplotlib.com', fontsize=16)

# 子图1:线图
x = np.linspace(0, 10, 100)
axs[0, 0].plot(x, np.sin(x), color='tab:blue', label='Sin')
axs[0, 0].plot(x, np.cos(x), color='tab:orange', label='Cos')
axs[0, 0].set_title('Line Plot')
axs[0, 0].legend()

# 子图2:散点图
np.random.seed(42)
axs[0, 1].scatter(np.random.rand(50), np.random.rand(50), color='tab:green', label='Group 1')
axs[0, 1].scatter(np.random.rand(50)+0.5, np.random.rand(50)+0.5, color='tab:red', label='Group 2')
axs[0, 1].set_title('Scatter Plot')
axs[0, 1].legend()

# 子图3:柱状图
categories = ['A', 'B', 'C', 'D']
values = np.random.randint(10, 100, size=4)
axs[1, 0].bar(categories, values, color=plt.cm.tab10(range(4)))
axs[1, 0].set_title('Bar Plot')

# 子图4:饼图
sizes = [30, 25, 20, 15, 10]
axs[1, 1].pie(sizes, labels=['A', 'B', 'C', 'D', 'E'], colors=plt.cm.tab10(range(5)), autopct='%1.1f%%')
axs[1, 1].set_title('Pie Chart')

plt.tight_layout()
plt.show()
Output:
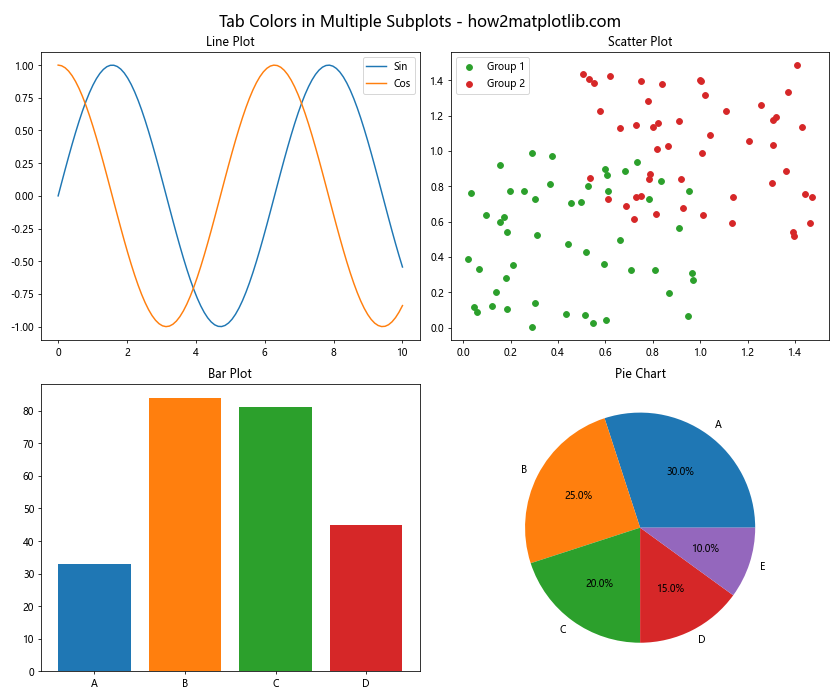
这个例子展示了如何在一个包含多个子图的图形中统一使用Tab Colors,创造出视觉上协调一致的效果。
Tab Colors与其他颜色方案的比较
虽然Tab Colors提供了一组优秀的预定义颜色,但Matplotlib还提供了其他颜色方案和颜色映射。了解这些选项可以帮助你在不同的场景下选择最合适的颜色方案。
import matplotlib.pyplot as plt
import numpy as np

# 准备数据
x = np.linspace(0, 10, 100)
y1 = np.sin(x)
y2 = np.cos(x)
y3 = np.tan(x)

# 创建图形
fig, (ax1, ax2, ax3) = plt.subplots(3, 1, figsize=(12, 15))
fig.suptitle('Comparison of Color Schemes - how2matplotlib.com', fontsize=16)

# Tab Colors
ax1.plot(x, y1, color='tab:blue', label='Sin')
ax1.plot(x, y2, color='tab:orange', label='Cos')
ax1.plot(x, y3, color='tab:green', label='Tan')
ax1.set_title('Tab Colors')
ax1.legend()

# 'Set1' color map
colors = plt.cm.Set1(np.linspace(0, 1, 3))
ax2.plot(x, y1, color=colors[0], label='Sin')
ax2.plot(x, y2, color=colors[1], label='Cos')
ax2.plot(x, y3, color=colors[2], label='Tan')
ax2.set_title('Set1 Color Map')
ax2.legend()

# 'viridis' color map
colors =plt.cm.viridis(np.linspace(0, 1, 3))
ax3.plot(x, y1, color=colors[0], label='Sin')
ax3.plot(x, y2, color=colors[1], label='Cos')
ax3.plot(x, y3, color=colors[2], label='Tan')
ax3.set_title('Viridis Color Map')
ax3.legend()

plt.tight_layout()
plt.show()
Output:
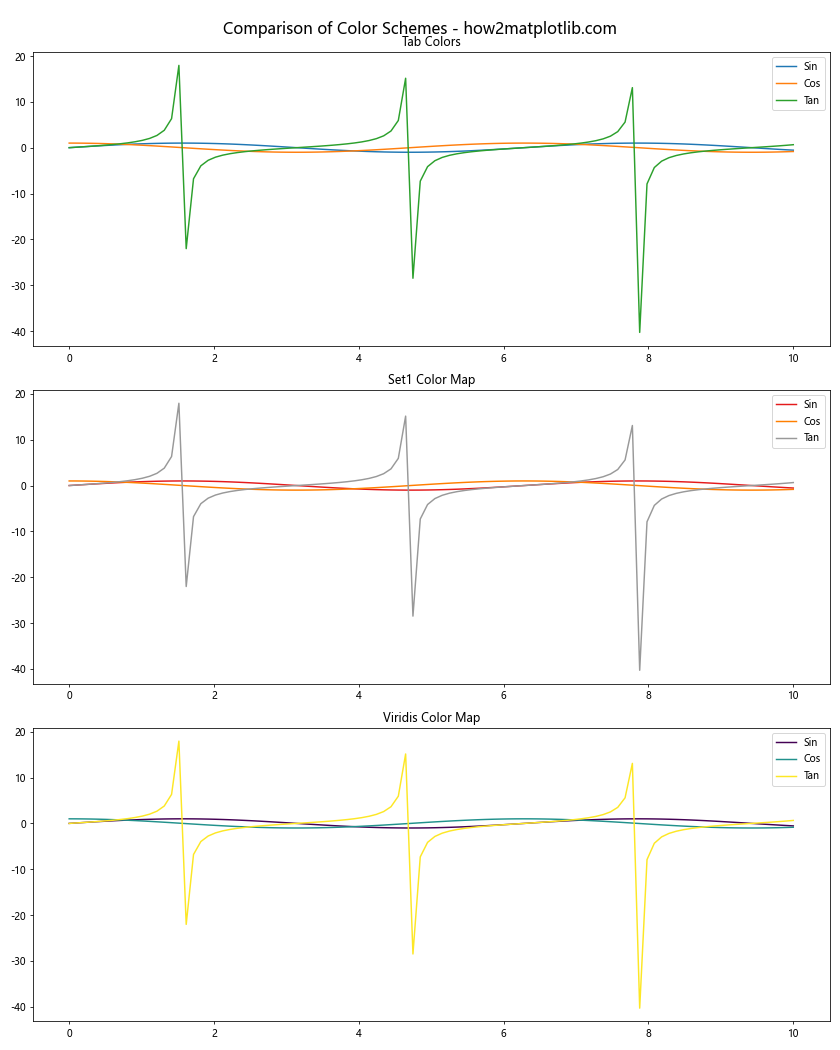
这个例子比较了Tab Colors、Set1颜色映射和Viridis颜色映射在同一组数据上的表现。每种颜色方案都有其特点:
- Tab Colors提供了清晰、易区分的颜色,适合大多数一般用途。
- Set1颜色映射提供了更鲜艳的颜色,适合需要高对比度的场景。
- Viridis颜色映射提供了平滑过渡的颜色,适合表示连续数据或热图。
Tab Colors在数据分析中的应用
在实际的数据分析工作中,Tab Colors可以帮助你更好地展示和解释数据。以下是一些实际应用的例子:
1. 时间序列数据可视化
import matplotlib.pyplot as plt
import pandas as pd
import numpy as np

# 创建示例时间序列数据
dates = pd.date_range(start='2023-01-01', end='2023-12-31', freq='D')
data1 = np.cumsum(np.random.randn(len(dates))) + 20
data2 = np.cumsum(np.random.randn(len(dates))) + 15

plt.figure(figsize=(12, 6))
plt.plot(dates, data1, color='tab:blue', label='Series 1')
plt.plot(dates, data2, color='tab:orange', label='Series 2')

plt.title('Time Series Data Visualization - how2matplotlib.com')
plt.xlabel('Date')
plt.ylabel('Value')
plt.legend()
plt.grid(True, linestyle='--', alpha=0.7)

plt.show()
Output:
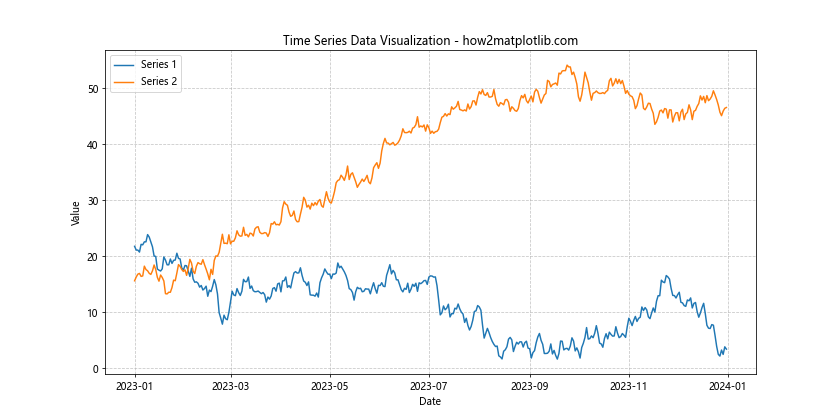
这个例子展示了如何使用Tab Colors来可视化两个时间序列数据。不同的颜色使得两个序列易于区分,而且视觉效果协调。
2. 多类别比较
import matplotlib.pyplot as plt
import numpy as np

categories = ['Category A', 'Category B', 'Category C', 'Category D', 'Category E']
values1 = np.random.randint(50, 100, size=5)
values2 = np.random.randint(50, 100, size=5)

x = np.arange(len(categories))
width = 0.35

fig, ax = plt.subplots(figsize=(12, 6))
rects1 = ax.bar(x - width/2, values1, width, label='Group 1', color='tab:blue')
rects2 = ax.bar(x + width/2, values2, width, label='Group 2', color='tab:orange')

ax.set_ylabel('Values')
ax.set_title('Multi-category Comparison - how2matplotlib.com')
ax.set_xticks(x)
ax.set_xticklabels(categories)
ax.legend()

ax.bar_label(rects1, padding=3)
ax.bar_label(rects2, padding=3)

fig.tight_layout()
plt.show()
Output:
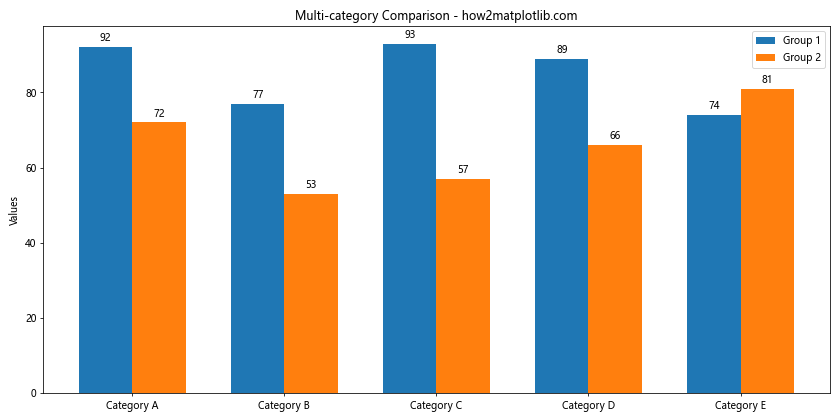
这个例子展示了如何使用Tab Colors来比较多个类别的两组数据。不同的颜色使得两组数据之间的差异一目了然。
3. 相关性热图
import matplotlib.pyplot as plt
import numpy as np
import seaborn as sns

# 生成示例相关性数据
np.random.seed(42)
data = np.random.rand(5, 5)
corr = np.corrcoef(data)

plt.figure(figsize=(10, 8))
sns.heatmap(corr, annot=True, cmap='tab10', vmin=-1, vmax=1, center=0)

plt.title('Correlation Heatmap using Tab Colors - how2matplotlib.com')
plt.show()
Output:
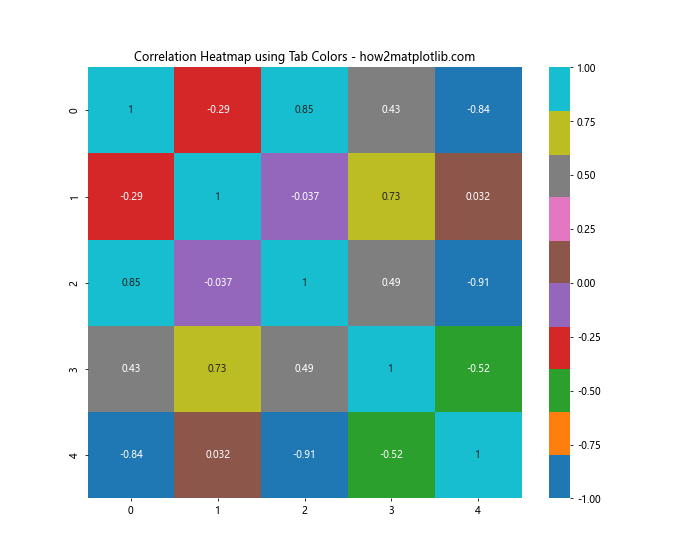
这个例子展示了如何使用Tab Colors创建相关性热图。Tab Colors的多样性使得不同程度的相关性更容易区分。
Tab Colors在不同主题下的表现
Matplotlib支持不同的绘图样式和主题,Tab Colors在不同的主题下可能会有不同的表现。以下是一些例子:
1. 默认主题
import matplotlib.pyplot as plt
import numpy as np

x = np.linspace(0, 10, 100)
y1 = np.sin(x)
y2 = np.cos(x)

plt.figure(figsize=(10, 6))
plt.plot(x, y1, color='tab:blue', label='Sin')
plt.plot(x, y2, color='tab:orange', label='Cos')

plt.title('Tab Colors in Default Theme - how2matplotlib.com')
plt.xlabel('X-axis')
plt.ylabel('Y-axis')
plt.legend()
plt.grid(True, linestyle='--', alpha=0.7)

plt.show()
Output:
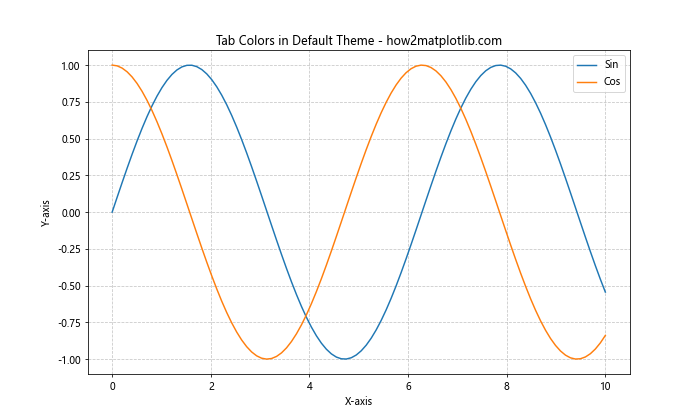
这是Tab Colors在默认主题下的表现,颜色鲜明且易于区分。
2. 暗色主题
import matplotlib.pyplot as plt
import numpy as np

plt.style.use('dark_background')

x = np.linspace(0, 10, 100)
y1 = np.sin(x)
y2 = np.cos(x)

plt.figure(figsize=(10, 6))
plt.plot(x, y1, color='tab:blue', label='Sin')
plt.plot(x, y2, color='tab:orange', label='Cos')

plt.title('Tab Colors in Dark Theme - how2matplotlib.com')
plt.xlabel('X-axis')
plt.ylabel('Y-axis')
plt.legend()
plt.grid(True, linestyle='--', alpha=0.3)

plt.show()
Output:
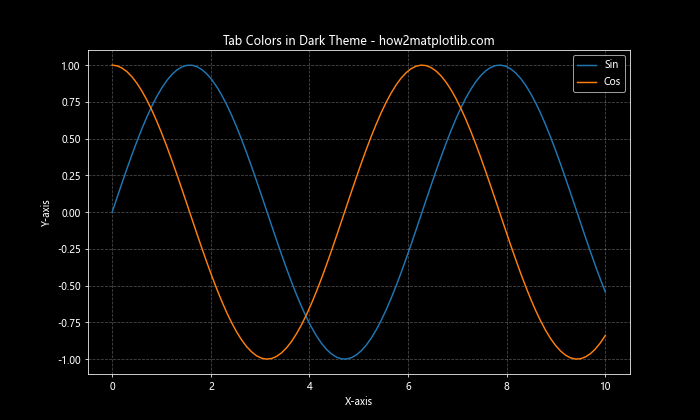
在暗色主题下,Tab Colors的表现依然出色,提供了良好的对比度。
3. Seaborn样式
import matplotlib.pyplot as plt
import seaborn as sns
import numpy as np

sns.set_style("whitegrid")

x = np.linspace(0, 10, 100)
y1 = np.sin(x)
y2 = np.cos(x)

plt.figure(figsize=(10, 6))
plt.plot(x, y1, color='tab:blue', label='Sin')
plt.plot(x, y2, color='tab:orange', label='Cos')

plt.title('Tab Colors with Seaborn Style - how2matplotlib.com')
plt.xlabel('X-axis')
plt.ylabel('Y-axis')
plt.legend()

plt.show()
Output:
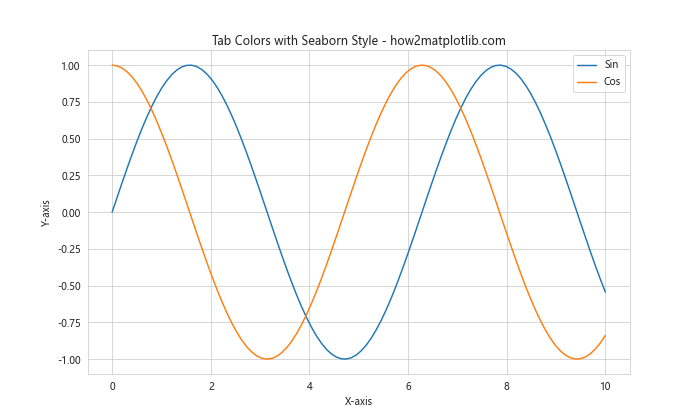
在Seaborn的样式下,Tab Colors与整体设计风格协调一致,提供了清晰的视觉效果。
Tab Colors的局限性和注意事项
尽管Tab Colors在多数情况下表现优秀,但也有一些局限性需要注意:
- 颜色数量限制:Tab Colors只提供10种颜色,对于需要更多颜色的复杂图表可能不够用。
-
色盲友好性:虽然Tab Colors在设计时考虑了色盲友好性,但在某些特殊情况下可能仍需要进行调整。
-
打印效果:在打印时,某些Tab Colors可能会失去区分度,需要进行测试和调整。
-
文化差异:不同文化背景的受众可能对颜色有不同的解读,在国际化项目中需要注意。
为了克服这些局限性,可以考虑以下建议:
import matplotlib.pyplot as plt
import numpy as np

# 使用标记和线型来增加区分度
x = np.linspace(0, 10, 100)
plt.figure(figsize=(12, 6))

for i in range(12):
    y = np.sin(x + i/2)
    color = plt.cm.tab10(i % 10)  # 循环使用Tab Colors
    plt.plot(x, y, color=color, label=f'Line {i+1}',
             linestyle=['-', '--', '-.', ':'][i % 4],
             marker=['o', 's', '^', 'D'][i % 4])

plt.title('Overcoming Tab Colors Limitations - how2matplotlib.com')
plt.xlabel('X-axis')
plt.ylabel('Y-axis')
plt.legend(bbox_to_anchor=(1.05, 1), loc='upper left')
plt.tight_layout()
plt.show()
Output:
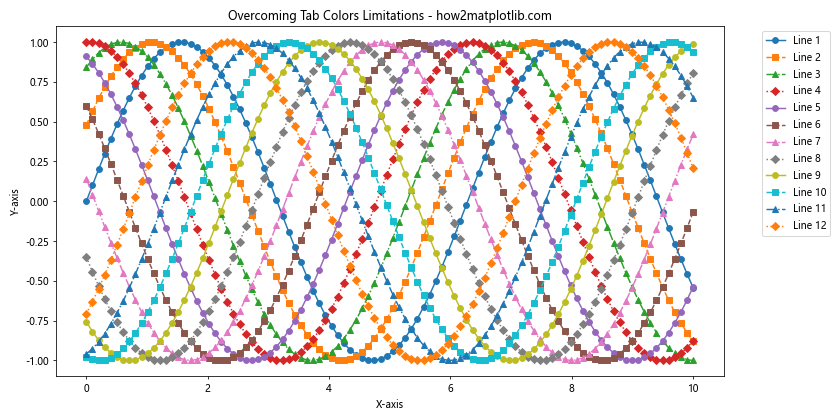
这个例子展示了如何通过组合使用颜色、线型和标记来增加图表的区分度,从而克服Tab Colors数量限制的问题。
结论
Matplotlib的Tab Colors提供了一组精心设计的预定义颜色,适用于各种数据可视化场景。它们易于使用、视觉效果出色,并且在不同的图表类型和主题下都表现良好。通过本文的详细介绍和丰富的示例,你应该已经掌握了如何在自己的数据可视化项目中有效地使用Tab Colors。
记住,颜色选择是数据可视化中的重要一环,但它只是众多因素中的一个。良好的数据可视化还需要考虑数据结构、受众需求、图表类型选择等多个方面。Tab Colors为你提供了一个优秀的起点,但真正的艺术在于如何将这些工具与你的创意和对数据的深入理解相结合,创造出既美观又有洞察力的可视化作品。
最后,我们鼓励你继续探索Matplotlib的其他功能,并将Tab Colors与其他可视化技巧结合使用,以创造出更加丰富和有意义的数据可视化作品。记住,实践是提高数据可视化技能的最佳方式,所以不要犹豫,开始使用Tab Colors来美化你的下一个数据可视化项目吧!
 极客教程
极客教程