Matplotlib散点图:数据可视化的强大工具
Matplotlib是Python中最流行的数据可视化库之一,而散点图(Scatter Plot)是其中一个非常实用的图表类型。本文将深入探讨Matplotlib中的散点图功能,从基础用法到高级技巧,帮助您掌握这一强大的数据可视化工具。
1. 散点图的基本概念
散点图是一种用于显示两个变量之间关系的图表类型。它通过在二维平面上绘制点来表示数据,每个点的位置由其x和y坐标决定。散点图常用于观察变量之间的相关性、识别数据模式或异常值。
1.1 散点图的应用场景
散点图在多个领域都有广泛应用,例如:
- 经济学:分析GDP与人均收入的关系
- 生物学:研究基因表达水平与蛋白质含量的关联
- 气象学:探索温度与湿度的相互影响
- 市场研究:调查产品价格与销量的关系
1.2 Matplotlib中的scatter函数
在Matplotlib中,我们主要使用pyplot.scatter()函数来创建散点图。这个函数非常灵活,可以控制点的大小、颜色、形状等属性。
让我们从一个简单的例子开始:
import matplotlib.pyplot as plt
import numpy as np

# 生成示例数据
x = np.random.rand(50)
y = np.random.rand(50)

# 创建散点图
plt.scatter(x, y)
plt.title('Basic Scatter Plot - how2matplotlib.com')
plt.xlabel('X-axis')
plt.ylabel('Y-axis')
plt.show()
Output:
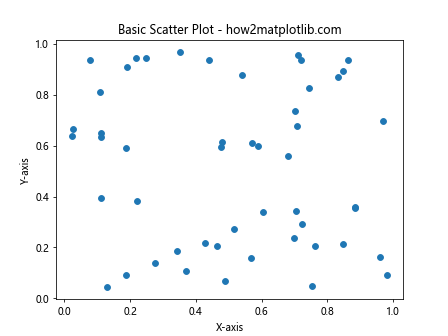
这个例子展示了最基本的散点图创建过程。我们使用NumPy生成随机数据,然后通过plt.scatter()函数绘制散点图。plt.title()、plt.xlabel()和plt.ylabel()函数用于添加标题和轴标签。
2. 自定义散点图外观
Matplotlib提供了丰富的选项来自定义散点图的外观,让我们逐一探讨。
2.1 调整点的大小
我们可以通过s参数来控制点的大小:
import matplotlib.pyplot as plt
import numpy as np

x = np.random.rand(50)
y = np.random.rand(50)
sizes = np.random.rand(50) * 1000  # 随机生成点的大小

plt.scatter(x, y, s=sizes, alpha=0.5)
plt.title('Scatter Plot with Variable Sizes - how2matplotlib.com')
plt.xlabel('X-axis')
plt.ylabel('Y-axis')
plt.show()
Output:
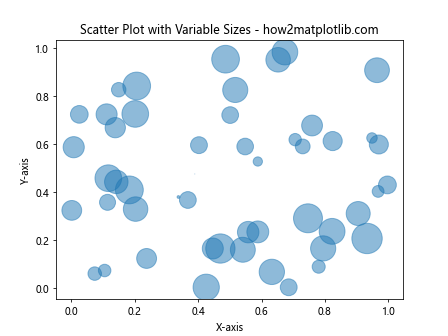
在这个例子中,我们使用sizes数组来指定每个点的大小。alpha参数用于设置点的透明度,使重叠的点更容易区分。
2.2 自定义颜色
c参数允许我们为散点图设置颜色:
import matplotlib.pyplot as plt
import numpy as np

x = np.random.rand(50)
y = np.random.rand(50)
colors = np.random.rand(50)

plt.scatter(x, y, c=colors, cmap='viridis')
plt.colorbar()
plt.title('Scatter Plot with Custom Colors - how2matplotlib.com')
plt.xlabel('X-axis')
plt.ylabel('Y-axis')
plt.show()
Output:
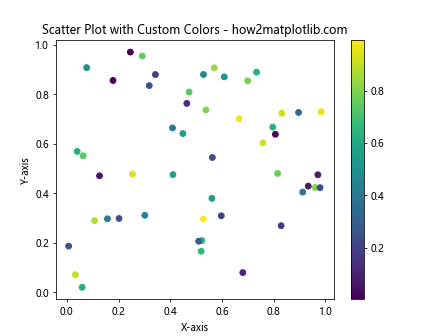
这个例子使用了一个颜色映射(colormap)来为每个点分配颜色。plt.colorbar()添加了一个颜色条,显示颜色与数值的对应关系。
2.3 使用不同的标记
Matplotlib提供了多种标记形状,可以通过marker参数设置:
import matplotlib.pyplot as plt
import numpy as np

x = np.random.rand(50)
y = np.random.rand(50)

markers = ['o', 's', '^', 'D', 'v']
for i, marker in enumerate(markers):
    plt.scatter(x[i::5], y[i::5], marker=marker, label=f'Marker {marker}')

plt.legend()
plt.title('Scatter Plot with Different Markers - how2matplotlib.com')
plt.xlabel('X-axis')
plt.ylabel('Y-axis')
plt.show()
Output:
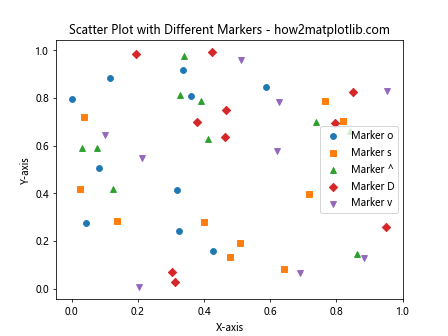
这个例子展示了如何在同一个图表中使用不同的标记形状。我们使用切片操作[i::5]来选择数据的子集,确保每种标记都有一些点。
3. 多数据集的散点图
在实际应用中,我们经常需要在同一个图表中比较多个数据集。Matplotlib使这一任务变得简单。
3.1 绘制多个数据集
import matplotlib.pyplot as plt
import numpy as np

x1 = np.random.rand(50)
y1 = np.random.rand(50)
x2 = np.random.rand(50) + 1
y2 = np.random.rand(50) + 1

plt.scatter(x1, y1, c='blue', label='Dataset 1')
plt.scatter(x2, y2, c='red', label='Dataset 2')
plt.legend()
plt.title('Multiple Datasets Scatter Plot - how2matplotlib.com')
plt.xlabel('X-axis')
plt.ylabel('Y-axis')
plt.show()
Output:
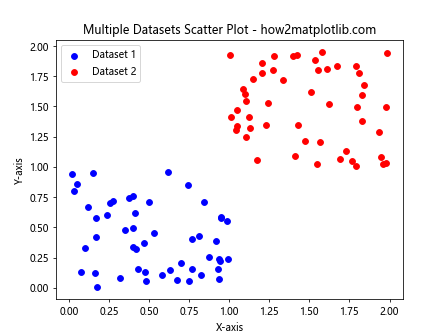
这个例子展示了如何在同一个图表中绘制两个不同的数据集,并使用不同的颜色和标签来区分它们。
3.2 使用子图
对于更复杂的比较,我们可以使用子图:
import matplotlib.pyplot as plt
import numpy as np

x = np.random.rand(100)
y1 = x + np.random.normal(0, 0.1, 100)
y2 = x**2 + np.random.normal(0, 0.1, 100)
y3 = np.sin(x*2*np.pi) + np.random.normal(0, 0.1, 100)

fig, (ax1, ax2, ax3) = plt.subplots(1, 3, figsize=(15, 5))

ax1.scatter(x, y1)
ax1.set_title('Linear - how2matplotlib.com')

ax2.scatter(x, y2)
ax2.set_title('Quadratic - how2matplotlib.com')

ax3.scatter(x, y3)
ax3.set_title('Sinusoidal - how2matplotlib.com')

plt.tight_layout()
plt.show()
Output:
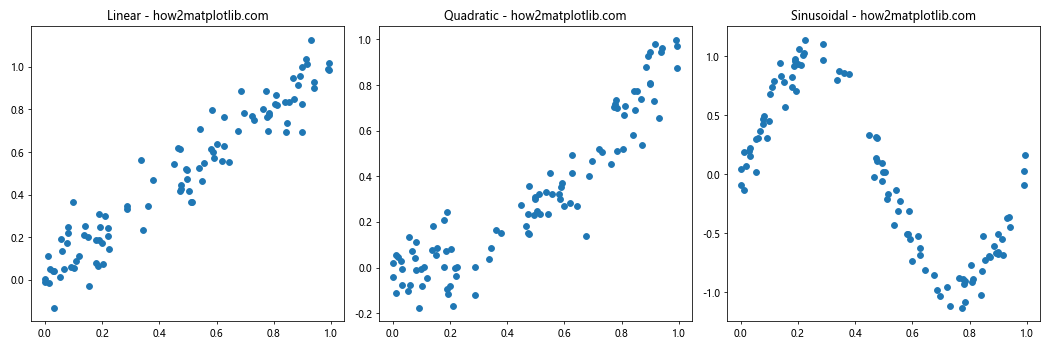
这个例子创建了三个子图,每个子图显示不同类型的关系:线性、二次和正弦。使用子图可以方便地比较不同的数据模式。
4. 高级散点图技巧
掌握了基础知识后,让我们探索一些更高级的散点图技巧。
4.1 添加趋势线
在散点图中添加趋势线可以帮助我们更好地理解数据的整体趋势:
import matplotlib.pyplot as plt
import numpy as np
from scipy import stats

x = np.random.rand(100)
y = 2*x + 1 + np.random.normal(0, 0.1, 100)

plt.scatter(x, y)

# 添加趋势线
slope, intercept, r_value, p_value, std_err = stats.linregress(x, y)
line = slope * x + intercept
plt.plot(x, line, color='red', label=f'y={slope:.2f}x+{intercept:.2f}')

plt.legend()
plt.title('Scatter Plot with Trend Line - how2matplotlib.com')
plt.xlabel('X-axis')
plt.ylabel('Y-axis')
plt.show()
Output:
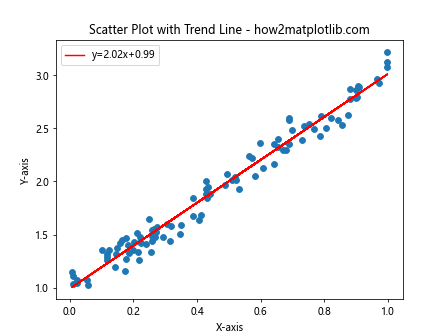
这个例子使用了SciPy的linregress函数来计算最佳拟合线,并将其添加到散点图中。
4.2 使用边界框
边界框可以帮助我们突出显示特定区域的数据点:
import matplotlib.pyplot as plt
import numpy as np

x = np.random.rand(100)
y = np.random.rand(100)

plt.scatter(x, y)

# 添加边界框
plt.axvline(x=0.3, color='r', linestyle='--')
plt.axvline(x=0.7, color='r', linestyle='--')
plt.axhline(y=0.3, color='r', linestyle='--')
plt.axhline(y=0.7, color='r', linestyle='--')

plt.title('Scatter Plot with Bounding Box - how2matplotlib.com')
plt.xlabel('X-axis')
plt.ylabel('Y-axis')
plt.show()
Output:
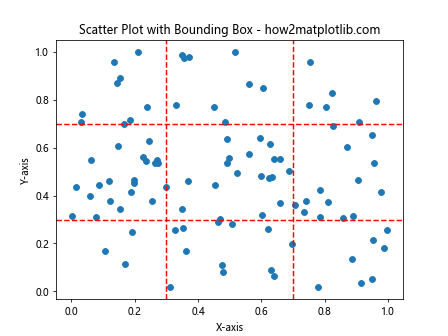
这个例子使用axvline和axhline函数来创建垂直和水平线,形成一个边界框。
4.3 使用颜色映射显示第三个变量
散点图不仅可以显示两个变量,还可以通过颜色来表示第三个变量:
import matplotlib.pyplot as plt
import numpy as np

x = np.random.rand(100)
y = np.random.rand(100)
z = np.random.rand(100)

plt.scatter(x, y, c=z, cmap='viridis')
plt.colorbar(label='Z-value')
plt.title('Scatter Plot with Color-coded Third Variable - how2matplotlib.com')
plt.xlabel('X-axis')
plt.ylabel('Y-axis')
plt.show()
Output:
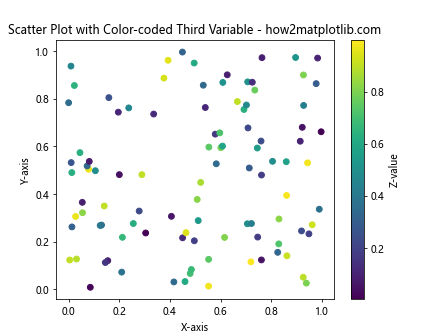
这个例子使用颜色来表示第三个变量z的值,使用viridis颜色映射。
5. 散点图的统计分析
散点图不仅可以用于可视化,还可以结合统计分析来提供更深入的洞察。
5.1 添加置信椭圆
置信椭圆可以帮助我们了解数据的分布和相关性:
import matplotlib.pyplot as plt
import numpy as np
from matplotlib.patches import Ellipse
import matplotlib.transforms as transforms

def confidence_ellipse(x, y, ax, n_std=3.0, facecolor='none', **kwargs):
    cov = np.cov(x, y)
    pearson = cov[0, 1]/np.sqrt(cov[0, 0] * cov[1, 1])
    ell_radius_x = np.sqrt(1 + pearson)
    ell_radius_y = np.sqrt(1 - pearson)
    ellipse = Ellipse((0, 0), width=ell_radius_x * 2, height=ell_radius_y * 2,
                      facecolor=facecolor, **kwargs)
    scale_x = np.sqrt(cov[0, 0]) * n_std
    scale_y = np.sqrt(cov[1, 1]) * n_std
    transf = transforms.Affine2D() \
        .rotate_deg(45) \
        .scale(scale_x, scale_y) \
        .translate(np.mean(x), np.mean(y))
    ellipse.set_transform(transf + ax.transData)
    return ax.add_patch(ellipse)

x = np.random.randn(100)
y = 0.8 * x + np.random.randn(100) * 0.2

fig, ax = plt.subplots()
ax.scatter(x, y)
confidence_ellipse(x, y, ax, edgecolor='red')

plt.title('Scatter Plot with Confidence Ellipse - how2matplotlib.com')
plt.xlabel('X-axis')
plt.ylabel('Y-axis')
plt.show()
Output:
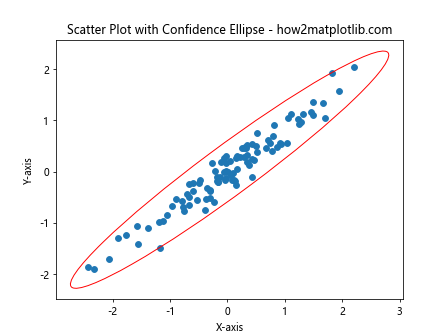
这个例子定义了一个函数来计算和绘制置信椭圆,然后将其应用到散点图上。
5.2 添加核密度估计
核密度估计可以帮助我们理解数据的分布:
import matplotlib.pyplot as plt
import numpy as np
from scipy import stats

x = np.random.randn(100)
y = 0.8 * x + np.random.randn(100) * 0.2

fig, ax = plt.subplots()

# 散点图
ax.scatter(x, y, alpha=0.5)

# 核密度估计
xy = np.vstack([x,y])
z = stats.gaussian_kde(xy)(xy)

ax.scatter(x, y, c=z, s=50, alpha=0.5)
plt.colorbar(label='Density')

plt.title('Scatter Plot with Kernel Density Estimation - how2matplotlib.com')
plt.xlabel('X-axis')
plt.ylabel('Y-axis')
plt.show()
这个例子使用SciPy的gaussian_kde函数来计算核密度估计,并将结果用颜色编码到散点图中。
6. 交互式散点图
虽然Matplotlib主要用于静态图表,但它也提供了一些基本的交互功能。
6.1 使用鼠标悬停显示数据点信息
import matplotlib.pyplot as plt
import numpy as np
from matplotlib.widgets import Cursor

x = np.random.rand(20)
y = np.random.rand(20)

fig, ax = plt.subplots()
scatter = ax.scatter(x, y)

cursor = Cursor(ax, useblit=True, color='red', linestyle='--')

annot = ax.annotate("", xy=(0,0), xytext=(20,20),textcoords="offset points",
                    bbox=dict(boxstyle="round", fc="w"),
                    arrowprops=dict(arrowstyle="->"))
annot.set_visible(False)

def hover(event):
    vis = annot.get_visible()
    if event.inaxes == ax:
        cont, ind = scatter.contains(event)
        if cont:
            pos = scatter.get_offsets()[ind["ind"][0]]
            annot.xy = pos
            text = f"x:{pos[0]:.2f}, y:{pos[1]:.2f}"
            annot.set_text(text)
            annot.set_visible(True)
            fig.canvas.draw_idle()
        else:
            if vis:
                annot.set_visible(False)
                fig.canvas.draw_idle()

fig.canvas.mpl_connect```python
fig.canvas.mpl_connect("motion_notify_event", hover)

plt.title('Interactive Scatter Plot - how2matplotlib.com')
plt.xlabel('X-axis')
plt.ylabel('Y-axis')
plt.show()
这个例子创建了一个交互式散点图,当鼠标悬停在数据点上时,会显示该点的坐标信息。
6.2 点击选择数据点
import matplotlib.pyplot as plt
import numpy as np

x = np.random.rand(20)
y = np.random.rand(20)

fig, ax = plt.subplots()
scatter = ax.scatter(x, y)

selected = []

def onpick(event):
    ind = event.ind
    selected.append(ind)
    print(f'Selected point: x={x[ind[0]]:.2f}, y={y[ind[0]]:.2f}')
    scatter.set_facecolors(['red' if i in selected else 'blue' for i in range(len(x))])
    fig.canvas.draw_idle()

scatter.set_picker(True)
fig.canvas.mpl_connect('pick_event', onpick)

plt.title('Click to Select Points - how2matplotlib.com')
plt.xlabel('X-axis')
plt.ylabel('Y-axis')
plt.show()
Output:
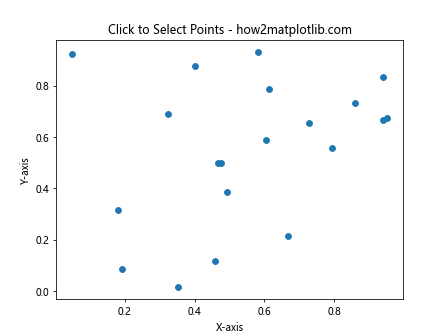
这个例子允许用户通过点击来选择数据点,选中的点会变成红色。
7. 散点图的性能优化
当处理大量数据点时,散点图的性能可能会成为一个问题。以下是一些优化技巧:
7.1 使用alpha通道
当数据点非常密集时,使用alpha通道可以帮助我们更好地理解数据分布:
import matplotlib.pyplot as plt
import numpy as np

x = np.random.randn(10000)
y = np.random.randn(10000)

plt.figure(figsize=(10, 5))

plt.subplot(121)
plt.scatter(x, y)
plt.title('Without Alpha - how2matplotlib.com')

plt.subplot(122)
plt.scatter(x, y, alpha=0.1)
plt.title('With Alpha - how2matplotlib.com')

plt.tight_layout()
plt.show()
Output:
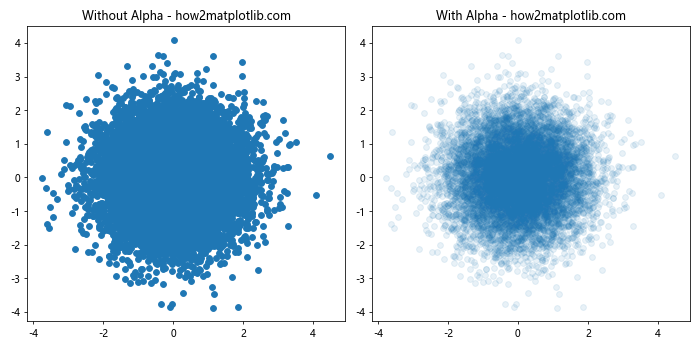
这个例子比较了使用和不使用alpha通道的效果,使用alpha通道可以更清晰地显示数据密度。
7.2 使用hexbin代替scatter
对于非常大的数据集,使用hexbin函数可能比scatter更有效:
import matplotlib.pyplot as plt
import numpy as np

x = np.random.randn(100000)
y = np.random.randn(100000)

plt.figure(figsize=(10, 5))

plt.subplot(121)
plt.scatter(x, y, alpha=0.1)
plt.title('Scatter - how2matplotlib.com')

plt.subplot(122)
plt.hexbin(x, y, gridsize=20, cmap='Blues')
plt.colorbar(label='Count in bin')
plt.title('Hexbin - how2matplotlib.com')

plt.tight_layout()
plt.show()
Output:
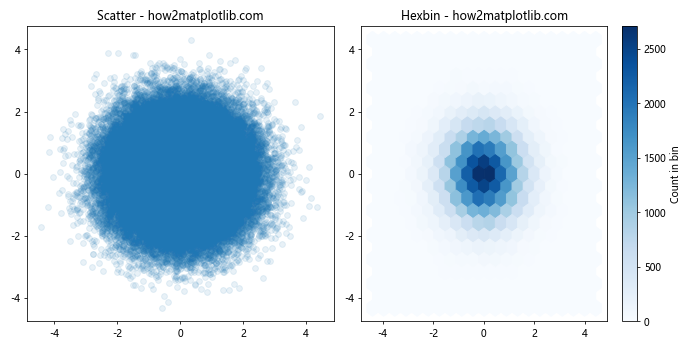
这个例子比较了scatter和hexbin的效果。hexbin通过将数据分组到六边形区域中,可以更有效地处理大量数据点。
8. 散点图的特殊应用
散点图不仅限于显示简单的x-y关系,还可以用于更复杂的数据可视化任务。
8.1 气泡图
气泡图是散点图的一种变体,使用点的大小来表示第三个变量:
import matplotlib.pyplot as plt
import numpy as np

x = np.random.rand(50)
y = np.random.rand(50)
sizes = np.random.rand(50) * 1000
colors = np.random.rand(50)

plt.scatter(x, y, s=sizes, c=colors, alpha=0.5, cmap='viridis')
plt.colorbar(label='Color Value')
plt.title('Bubble Chart - how2matplotlib.com')
plt.xlabel('X-axis')
plt.ylabel('Y-axis')
plt.show()
Output:
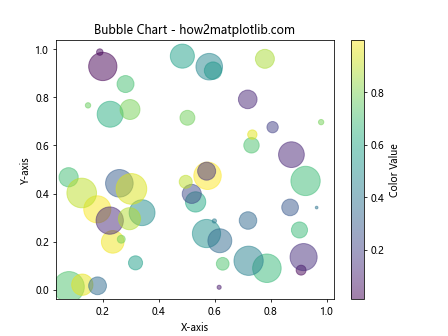
这个例子创建了一个气泡图,其中点的大小表示一个变量,颜色表示另一个变量。
8.2 散点图矩阵
散点图矩阵可以同时显示多个变量之间的关系:
import matplotlib.pyplot as plt
import numpy as np
import pandas as pd
import seaborn as sns

# 创建示例数据
data = {
    'A': np.random.randn(100),
    'B': np.random.randn(100),
    'C': np.random.randn(100),
    'D': np.random.randn(100)
}
df = pd.DataFrame(data)

# 使用seaborn创建散点图矩阵
sns.pairplot(df)
plt.suptitle('Scatter Plot Matrix - how2matplotlib.com', y=1.02)
plt.show()
Output:
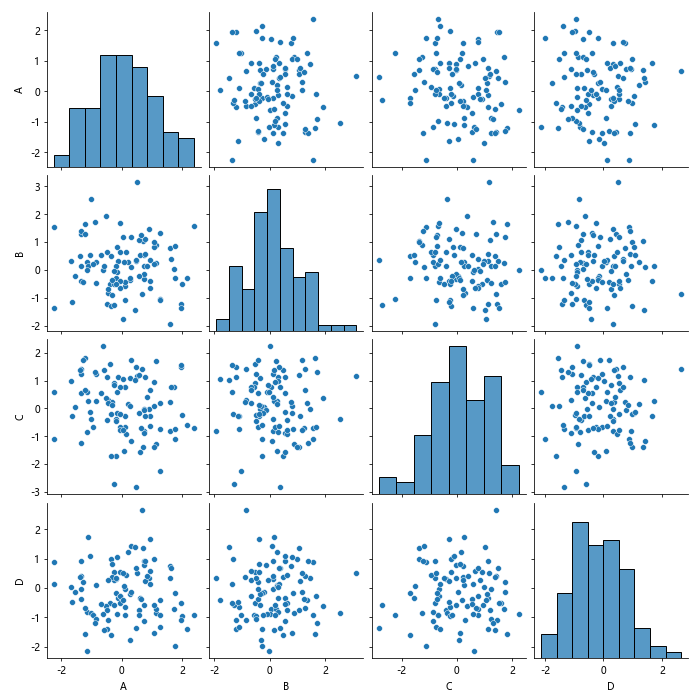
这个例子使用Seaborn库(基于Matplotlib)创建了一个散点图矩阵,显示了四个变量之间的所有可能组合。
9. 结合其他图表类型
散点图可以与其他类型的图表结合,提供更丰富的数据视图。
9.1 散点图与直方图结合
import matplotlib.pyplot as plt
import numpy as np

x = np.random.randn(1000)
y = x + np.random.randn(1000) * 0.5

fig, axs = plt.subplots(2, 2, figsize=(10, 10))

axs[0, 0].scatter(x, y)
axs[0, 0].set_title('Scatter Plot - how2matplotlib.com')

axs[0, 1].hist(x, bins=30)
axs[0, 1].set_title('X Histogram')

axs[1, 0].hist(y, bins=30, orientation='horizontal')
axs[1, 0].set_title('Y Histogram')

axs[1, 1].axis('off')

plt.tight_layout()
plt.show()
Output:
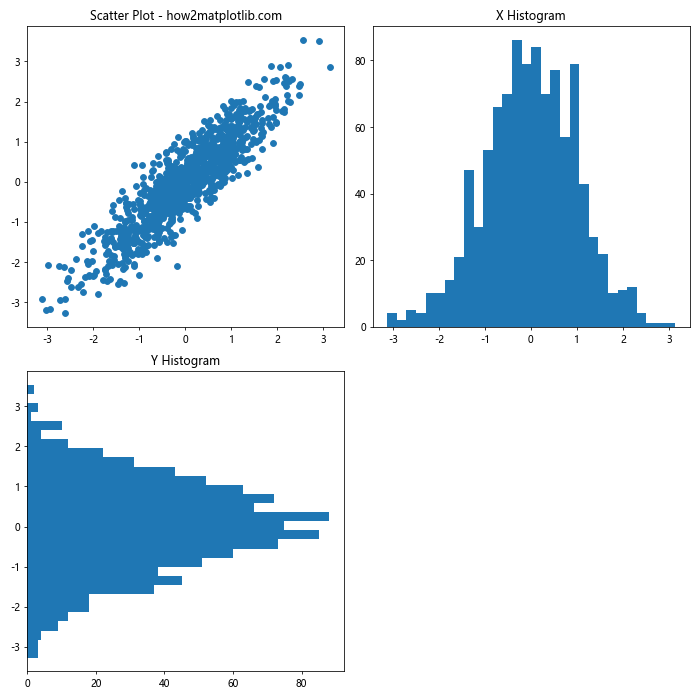
这个例子创建了一个组合图,包括散点图和两个直方图,分别显示x和y的分布。
9.2 散点图与箱线图结合
import matplotlib.pyplot as plt
import numpy as np

x = np.random.randn(100)
y = x + np.random.randn(100) * 0.5

fig, axs = plt.subplots(2, 2, figsize=(10, 10))

axs[0, 0].scatter(x, y)
axs[0, 0].set_title('Scatter Plot - how2matplotlib.com')

axs[0, 1].boxplot(x)
axs[0, 1].set_title('X Boxplot')

axs[1, 0].boxplot(y, vert=False)
axs[1, 0].set_title('Y Boxplot')

axs[1, 1].axis('off')

plt.tight_layout()
plt.show()
Output:
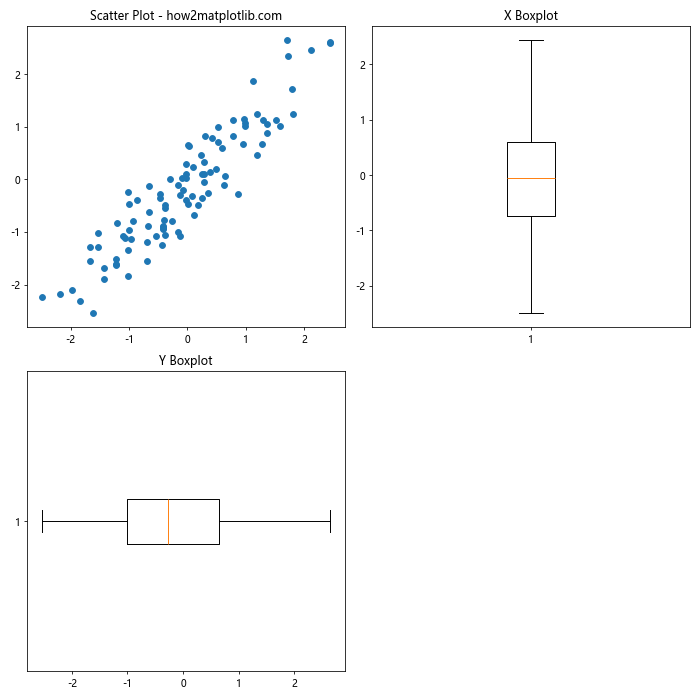
这个例子创建了一个组合图,包括散点图和两个箱线图,分别显示x和y的统计特征。
10. 总结
Matplotlib的散点图功能强大而灵活,可以满足各种数据可视化需求。从基本的点图到复杂的多变量可视化,散点图都能胜任。通过本文介绍的各种技巧和示例,您应该能够创建出富有洞察力的散点图,帮助您更好地理解和展示数据。
记住,好的数据可视化不仅仅是技术,还需要考虑数据的特性和您想要传达的信息。选择合适的图表类型、颜色方案和布局,可以大大提高您的数据故事的表现力。继续探索和实践,您会发现Matplotlib散点图还有更多有趣的应用等待您去发现。
 极客教程
极客教程