matplotlib markersize
在matplotlib中,markersize用于设置图表中散点的大小。通过调整markersize的数值,可以改变散点的大小,使得数据更加清晰地展示在图表中。
示例代码
import matplotlib.pyplot as plt

x = [1, 2, 3, 4, 5]
y = [2, 3, 5, 7, 11]

plt.scatter(x, y, s=50) # 设置scatter的markersize为50
plt.show()
Output:
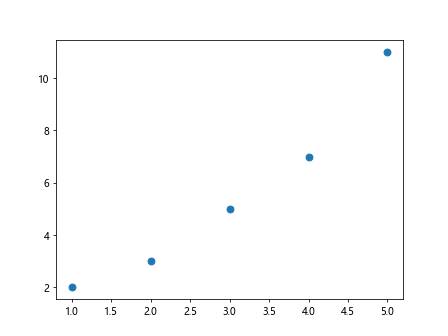
在上面的示例代码中,设置了scatter的markersize为50,即散点的大小为50。
设置固定大小
import matplotlib.pyplot as plt

x = [1, 2, 3, 4, 5]
y = [2, 3, 5, 7, 11]

plt.scatter(x, y, s=100) # 设置scatter的markersize为100
plt.show()
Output:
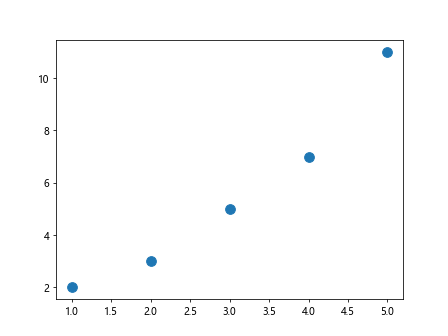
在上面的示例中,通过设置markersize为100,可以让散点的大小固定为100。
根据数据动态调整大小
import matplotlib.pyplot as plt

x = [1, 2, 3, 4, 5]
y = [2, 3, 5, 7, 11]
sizes = [20, 50, 80, 120, 150]

plt.scatter(x, y, s=sizes) # 设置scatter的markersize根据sizes的数值动态调整
plt.show()
Output:
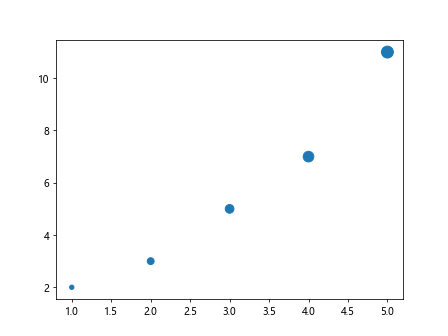
在上面的示例中,通过设置markersize为一个列表sizes,让散点的大小根据sizes的数值动态调整。
设置默认值
import matplotlib.pyplot as plt

x = [1, 2, 3, 4, 5]
y = [2, 3, 5, 7, 11]

plt.scatter(x, y, s=20) # 设置scatter的markersize为默认值20
plt.show()
Output:
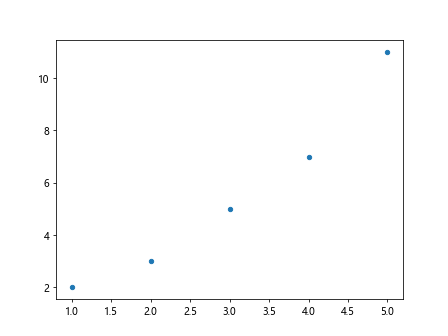
在上面的示例中,可以设置scatter的markersize为默认值20,即当不设置markersize时,默认大小为20。
组合使用
import matplotlib.pyplot as plt

x = [1, 2, 3, 4, 5]
y = [2, 3, 5, 7, 11]
sizes = [20, 50, 80, 120, 150]

plt.scatter(x, y, s=sizes, marker='o') # 设置scatter的markersize根据sizes的数值动态调整,并指定marker为圆形
plt.show()
Output:
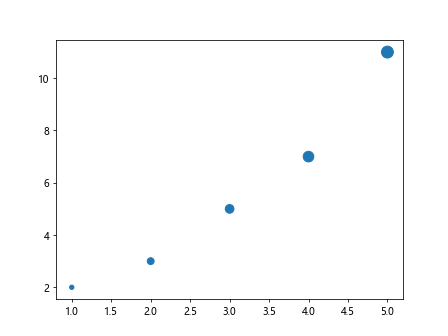
在上面的示例中,除了根据sizes的数值动态调整markersize外,还指定了marker为圆形。
设置为0
import matplotlib.pyplot as plt

x = [1, 2, 3, 4, 5]
y = [2, 3, 5, 7, 11]

plt.scatter(x, y, s=0) # 设置scatter的markersize为0
plt.show()
Output:
上述示例中,将scatter的markersize设置为0,导致散点消失。
小数值
import matplotlib.pyplot as plt

x = [1, 2, 3, 4, 5]
y = [2, 3, 5, 7, 11]

plt.scatter(x, y, s=0.5) # 设置scatter的markersize为0.5
plt.show()
Output:
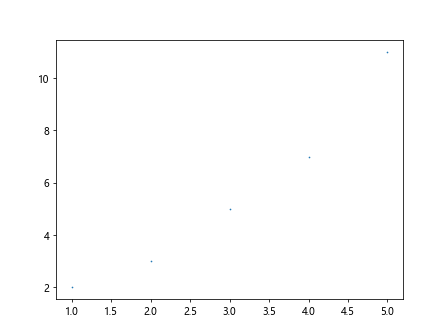
通过设置小数值,如0.5,可以调整散点的大小。
大数值
import matplotlib.pyplot as plt

x = [1, 2, 3, 4, 5]
y = [2, 3, 5, 7, 11]

plt.scatter(x, y, s=500) # 设置scatter的markersize为500
plt.show()
Output:
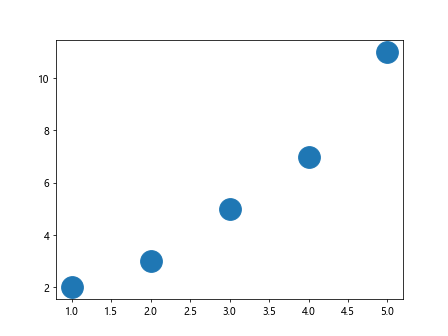
通过设置大数值,如500,可以让散点变得非常大。
不同大小的点
import matplotlib.pyplot as plt

x = [1, 2, 3, 4, 5]
y = [2, 3, 5, 7, 11]
sizes = [20, 50, 80, 120, 150]

plt.scatter(x, y, s=sizes) # 设置scatter的markersize根据sizes的数值动态调整
plt.show()
Output:
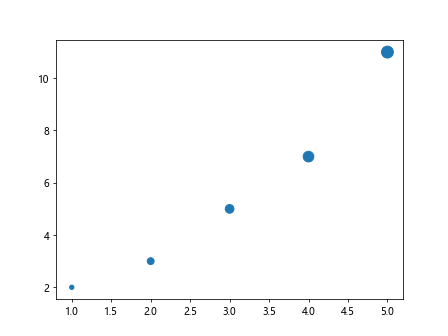
在上面的示例中,通过sizes列表中的不同数值,展示了不同大小的散点。
自定义大小范围
import matplotlib.pyplot as plt

x = [1, 2, 3, 4, 5]
y = [2, 3, 5, 7, 11]
sizes = [20, 50, 80, 120, 150]

plt.scatter(x, y, s=sizes, vmin=0, vmax=200) # 设置scatter的markersize根据sizes的数值动态调整,并指定大小范围
plt.show()
在上面的示例中,通过设置vmin和vmax参数,指定了markersize的大小范围为0到200。
设置散点大小的透明度
import matplotlib.pyplot as plt

x = [1, 2, 3, 4, 5]
y = [2, 3, 5, 7, 11]
sizes = [20, 50, 80, 120, 150]

plt.scatter(x, y, s=sizes, alpha=0.5) # 设置scatter的markersize根据sizes的数值动态调整,并设置透明度为0.5
plt.show()
Output:
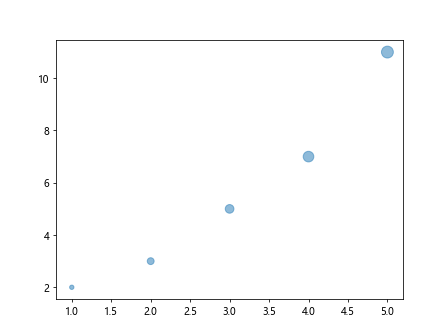
在上面的示例中,通过设置alpha参数为0.5,可以让散点变得半透明。
改变颜色
import matplotlib.pyplot as plt

x = [1, 2, 3, 4, 5]
y = [2, 3, 5, 7, 11]
sizes = [20, 50, 80, 120, 150]

plt.scatter(x, y, s=sizes, c='red') # 设置scatter的markersize根据sizes的数值动态调整,并改变颜色为红色
plt.show()
Output:
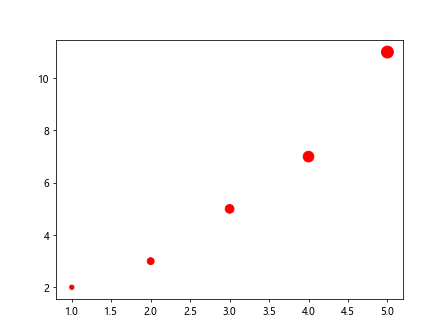
在上面的示例中,通过设置c参数为’red’,可以改变散点的颜色为红色。
改变边界颜色
import matplotlib.pyplot as plt

x = [1, 2, 3, 4, 5]
y = [2, 3, 5, 7, 11]
sizes = [20, 50, 80, 120, 150]

plt.scatter(x, y, s=sizes, edgecolor='blue') # 设置scatter的markersize根据sizes的数值动态调整,并改变边界颜色为蓝色
plt.show()
Output:
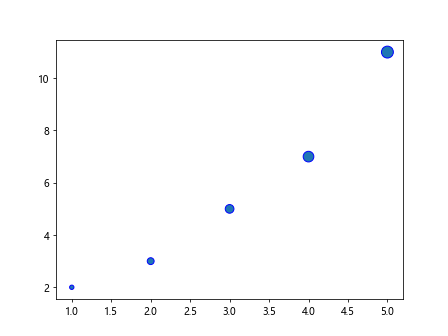
在上面的示例中,通过设置edgecolor参数为’blue’,可以改变散点的边界颜色为蓝色。
改变透明度和边界颜色
import matplotlib.pyplot as plt

x = [1, 2, 3, 4, 5]
y = [2, 3, 5, 7, 11]
sizes = [20, 50, 80, 120, 150]

plt.scatter(x, y, s=sizes, alpha=0.3, edgecolor='green') # 设置scatter的markersize根据sizes的数值动态调整,并设置透明度为0.3,边界颜色为绿色
plt.show()
Output:
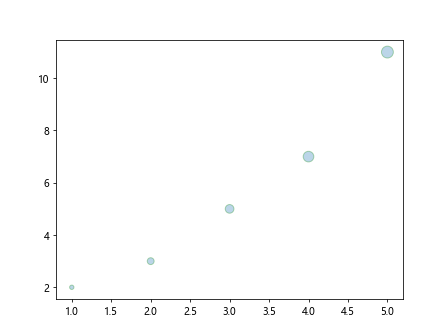
在上面的示例中,通过设置alpha参数为0.3和edgecolor参数为’green’,可以同时改变散点的透明度和边界颜色。
使用颜色映射
import matplotlib.pyplot as plt
import numpy as np

x = np.random.rand(50)
y = np.random.rand(50)
sizes = np.random.rand(50) * 100

plt.scatter(x, y, s=sizes, cmap='viridis') # 设置scatter的markersize根据sizes的数值动态调整,并使用颜色映射为viridis
plt.colorbar() # 添加颜色条
plt.show()
在上面的示例中,通过使用颜色映射cmap=’viridis’,可以根据数值大小自动调整散点的颜色。
通过以上示例代码,我们学习了如何在matplotlib中设置markersize来调整散点的大小,通过不同的参数设置,可以方便地定制化图表,使得数据展示更加直观和清晰。
 极客教程
极客教程