Matplotlib中如何使用虚线样式(Linestyle Dashed)绘制图形
参考:matplotlib linestyle dashed
Matplotlib是Python中最流行的数据可视化库之一,它提供了丰富的绘图功能和样式选项。在绘制线图时,虚线样式(Linestyle Dashed)是一种常用的线型,可以用来区分不同的数据系列或强调特定的图形元素。本文将详细介绍如何在Matplotlib中使用虚线样式,包括基本用法、自定义虚线样式、在不同类型的图表中应用虚线样式,以及一些高级技巧和注意事项。
1. 虚线样式的基本用法
在Matplotlib中,使用虚线样式非常简单。最常见的方法是在绘图函数中设置linestyle参数为'--'或'dashed'。以下是一个基本的示例:
import matplotlib.pyplot as plt
import numpy as np

x = np.linspace(0, 10, 100)
y = np.sin(x)

plt.figure(figsize=(8, 6))
plt.plot(x, y, linestyle='--', label='how2matplotlib.com')
plt.title('Sine Wave with Dashed Line')
plt.xlabel('X-axis')
plt.ylabel('Y-axis')
plt.legend()
plt.grid(True)
plt.show()
Output:
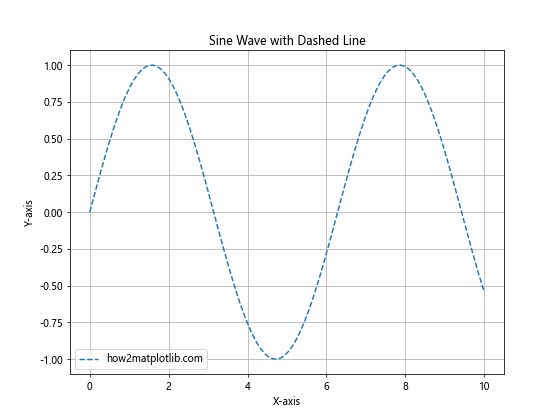
在这个例子中,我们使用linestyle='--'来绘制一条正弦波的虚线图。'--'是虚线样式的简写形式,也可以使用完整的单词'dashed'。
2. 自定义虚线样式
Matplotlib允许我们自定义虚线样式,以创建更多样化的线型效果。我们可以通过指定虚线和空白部分的长度来实现这一点。
import matplotlib.pyplot as plt
import numpy as np

x = np.linspace(0, 10, 100)
y1 = np.sin(x)
y2 = np.cos(x)

plt.figure(figsize=(10, 6))
plt.plot(x, y1, linestyle=(0, (5, 5)), label='Sine - how2matplotlib.com')
plt.plot(x, y2, linestyle=(0, (1, 1)), label='Cosine - how2matplotlib.com')
plt.title('Custom Dashed Lines')
plt.xlabel('X-axis')
plt.ylabel('Y-axis')
plt.legend()
plt.grid(True)
plt.show()
Output:
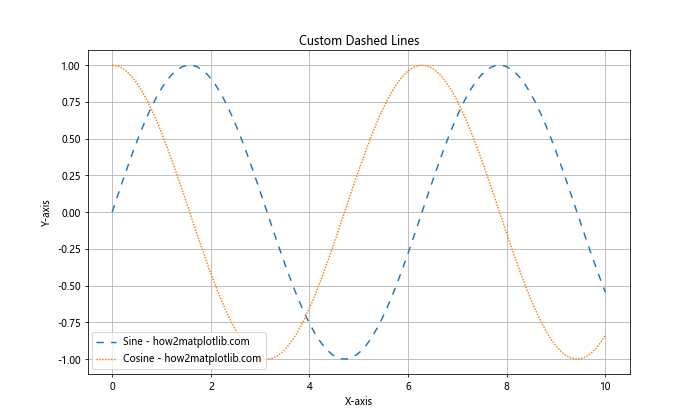
在这个例子中,我们使用元组来定义自定义的虚线样式。(0, (5, 5))表示线段长度为5,间隔也为5。(0, (1, 1))则创建了一种点线效果。
3. 在散点图中使用虚线连接
虽然散点图通常不使用线条连接数据点,但有时我们可能希望用虚线连接某些点以突出趋势或关系。
import matplotlib.pyplot as plt
import numpy as np

np.random.seed(42)
x = np.random.rand(20)
y = np.random.rand(20)

plt.figure(figsize=(8, 6))
plt.scatter(x, y, label='Data Points - how2matplotlib.com')
plt.plot(x, y, linestyle='--', color='red', alpha=0.5, label='Dashed Connection')
plt.title('Scatter Plot with Dashed Line Connection')
plt.xlabel('X-axis')
plt.ylabel('Y-axis')
plt.legend()
plt.grid(True)
plt.show()
Output:
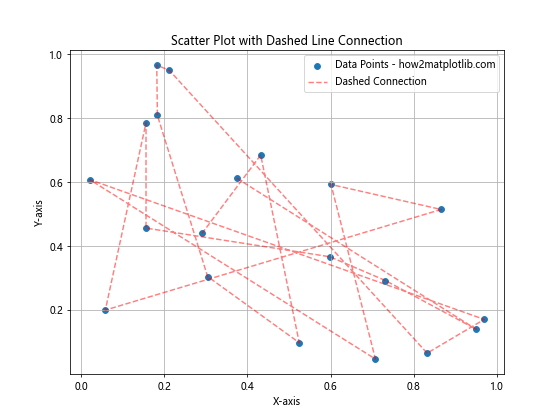
这个例子展示了如何在散点图中添加虚线连接。我们首先绘制散点图,然后使用相同的数据点用虚线连接它们。
4. 在条形图中使用虚线
虽然条形图通常不使用线条,但我们可以添加虚线来表示某些阈值或参考线。
import matplotlib.pyplot as plt
import numpy as np

categories = ['A', 'B', 'C', 'D', 'E']
values = [3, 7, 2, 5, 8]

plt.figure(figsize=(10, 6))
plt.bar(categories, values, label='Data - how2matplotlib.com')
plt.axhline(y=5, linestyle='--', color='red', label='Threshold')
plt.title('Bar Chart with Dashed Threshold Line')
plt.xlabel('Categories')
plt.ylabel('Values')
plt.legend()
plt.grid(True, axis='y')
plt.show()
Output:
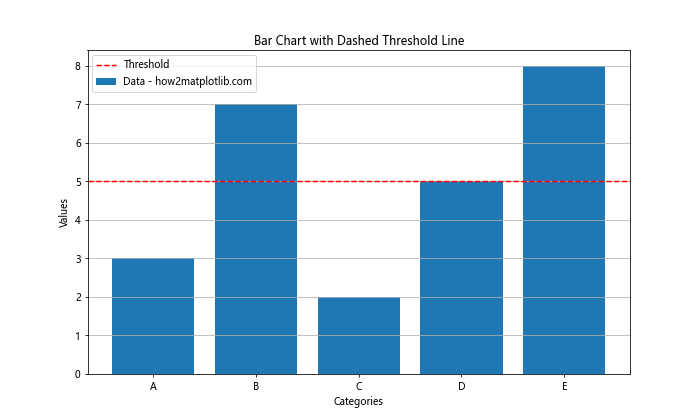
在这个例子中,我们使用axhline函数添加了一条水平虚线,表示某个阈值或参考线。
5. 在饼图中使用虚线
虽然饼图主要由扇形组成,但我们可以使用虚线来突出显示某些扇形或添加注释。
import matplotlib.pyplot as plt

sizes = [30, 20, 25, 15, 10]
labels = ['A', 'B', 'C', 'D', 'E']
explode = (0.1, 0, 0, 0, 0)

plt.figure(figsize=(10, 8))
plt.pie(sizes, explode=explode, labels=labels, autopct='%1.1f%%', startangle=90)
plt.title('Pie Chart with Dashed Annotation')

# 添加虚线注释
plt.annotate('Important Slice', xy=(0.7, 0.7), xytext=(1.2, 1.2),
             arrowprops=dict(facecolor='black', shrink=0.05, width=1, headwidth=8, linestyle='--'))

plt.text(1.3, 1.3, 'how2matplotlib.com', fontsize=12, ha='center')
plt.axis('equal')
plt.show()
Output:
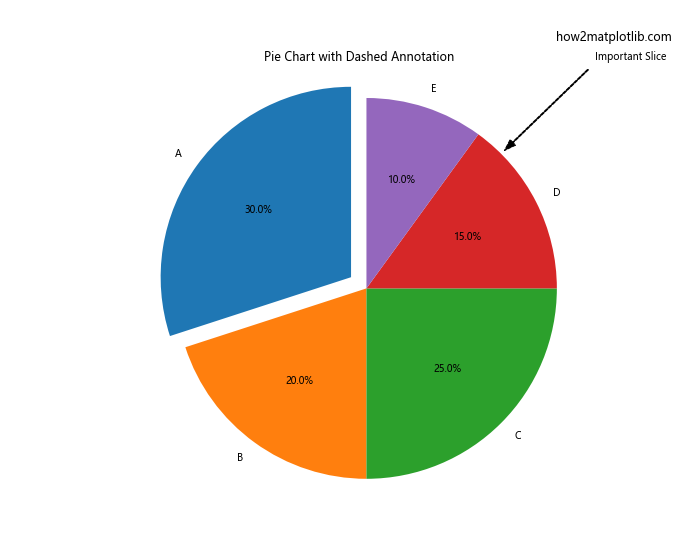
这个例子展示了如何在饼图中使用虚线箭头来注释特定的扇形。
6. 在多子图中使用不同的虚线样式
当我们需要在一个图形中展示多个子图时,使用不同的虚线样式可以帮助区分不同的数据系列。
import matplotlib.pyplot as plt
import numpy as np

x = np.linspace(0, 10, 100)
y1 = np.sin(x)
y2 = np.cos(x)
y3 = np.tan(x)

fig, (ax1, ax2, ax3) = plt.subplots(3, 1, figsize=(10, 12))

ax1.plot(x, y1, linestyle='--', label='Sine - how2matplotlib.com')
ax1.set_title('Sine Wave')
ax1.legend()

ax2.plot(x, y2, linestyle='-.', label='Cosine - how2matplotlib.com')
ax2.set_title('Cosine Wave')
ax2.legend()

ax3.plot(x, y3, linestyle=':', label='Tangent - how2matplotlib.com')
ax3.set_title('Tangent Wave')
ax3.legend()

plt.tight_layout()
plt.show()
Output:
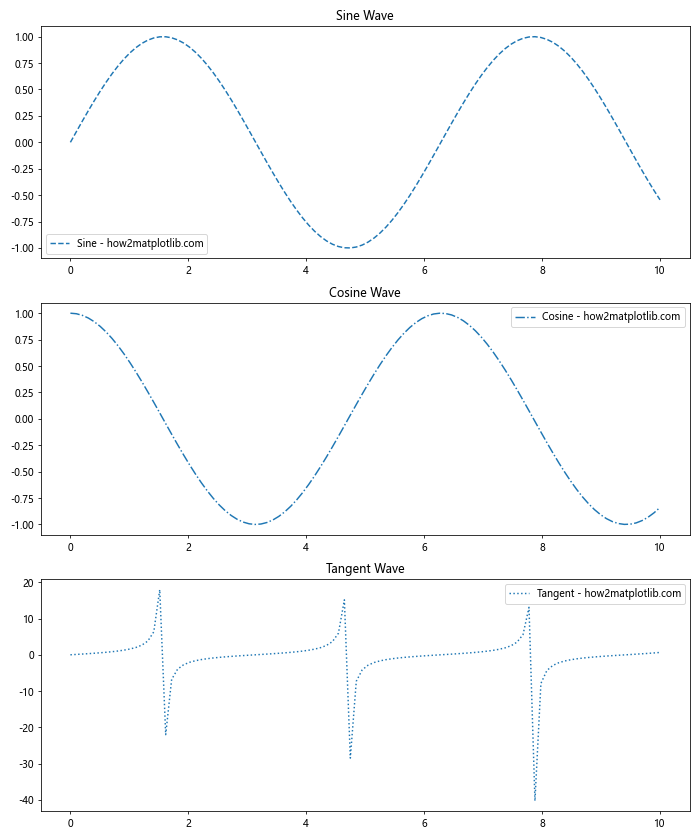
这个例子创建了三个子图,每个子图使用不同的虚线样式来绘制不同的三角函数。
7. 在极坐标图中使用虚线
虚线样式也可以应用于极坐标图,以创建独特的视觉效果。
import matplotlib.pyplot as plt
import numpy as np

theta = np.linspace(0, 2*np.pi, 100)
r = 2 + np.sin(5*theta)

plt.figure(figsize=(8, 8))
ax = plt.subplot(111, projection='polar')
ax.plot(theta, r, linestyle='--', label='how2matplotlib.com')
ax.set_title('Polar Plot with Dashed Line')
ax.legend()
plt.show()
Output:
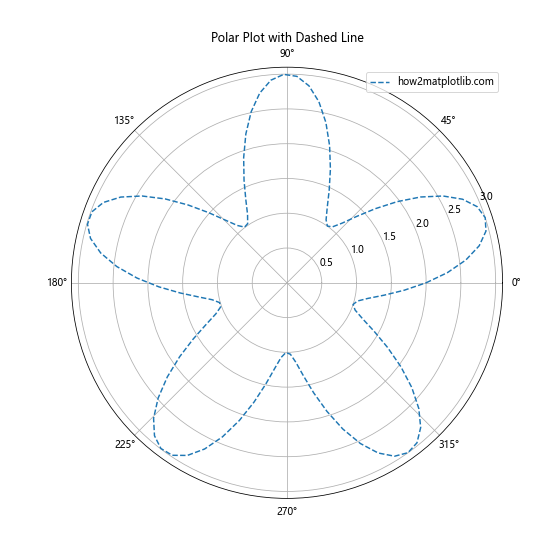
这个例子展示了如何在极坐标系中使用虚线绘制一个复杂的曲线。
8. 在3D图中使用虚线
Matplotlib也支持在3D图形中使用虚线样式,这可以帮助我们更好地可视化复杂的三维数据。
import matplotlib.pyplot as plt
import numpy as np

fig = plt.figure(figsize=(10, 8))
ax = fig.add_subplot(111, projection='3d')

t = np.linspace(0, 10, 100)
x = np.sin(t)
y = np.cos(t)
z = t

ax.plot(x, y, z, linestyle='--', label='3D Curve - how2matplotlib.com')
ax.set_xlabel('X-axis')
ax.set_ylabel('Y-axis')
ax.set_zlabel('Z-axis')
ax.set_title('3D Plot with Dashed Line')
ax.legend()

plt.show()
Output:
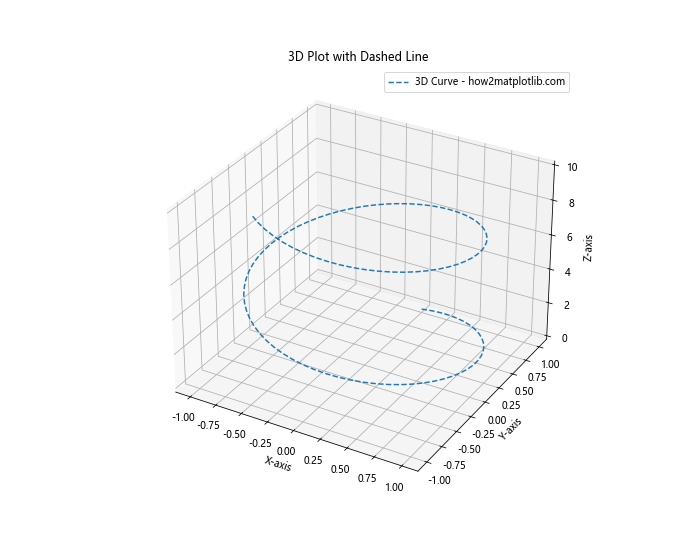
这个例子展示了如何在3D空间中使用虚线绘制一条螺旋曲线。
9. 使用虚线绘制误差线
在数据可视化中,误差线通常用来表示数据的不确定性或变异性。使用虚线样式可以使误差线不那么突兀,同时仍然清晰可见。
import matplotlib.pyplot as plt
import numpy as np

x = np.linspace(0, 10, 50)
y = np.sin(x) + np.random.normal(0, 0.1, 50)
yerr = np.random.uniform(0.05, 0.2, 50)

plt.figure(figsize=(10, 6))
plt.errorbar(x, y, yerr=yerr, fmt='o', linestyle='--', capsize=5, label='Data with Error - how2matplotlib.com')
plt.title('Error Bar Plot with Dashed Lines')
plt.xlabel('X-axis')
plt.ylabel('Y-axis')
plt.legend()
plt.grid(True)
plt.show()
Output:
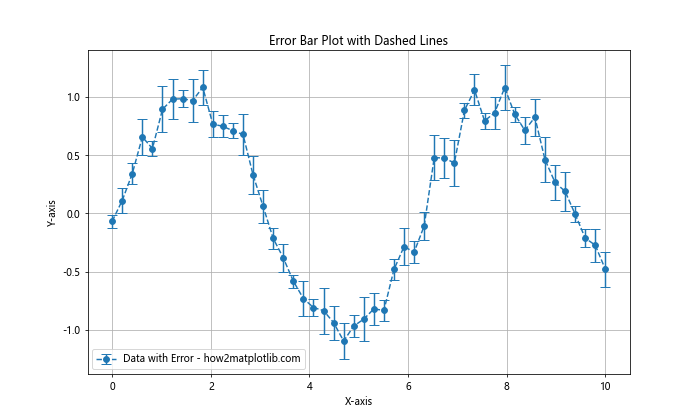
在这个例子中,我们使用errorbar函数绘制了带有误差线的散点图,并将误差线的样式设置为虚线。
10. 在填充区域图中使用虚线边界
当我们需要强调某个区域的边界时,可以使用虚线来绘制填充区域的轮廓。
import matplotlib.pyplot as plt
import numpy as np

x = np.linspace(0, 10, 100)
y1 = np.sin(x)
y2 = np.sin(x) + 0.5

plt.figure(figsize=(10, 6))
plt.fill_between(x, y1, y2, alpha=0.3, label='Filled Area - how2matplotlib.com')
plt.plot(x, y1, linestyle='--', color='blue', label='Lower Bound')
plt.plot(x, y2, linestyle='--', color='red', label='Upper Bound')
plt.title('Filled Area Plot with Dashed Boundaries')
plt.xlabel('X-axis')
plt.ylabel('Y-axis')
plt.legend()
plt.grid(True)
plt.show()
Output:
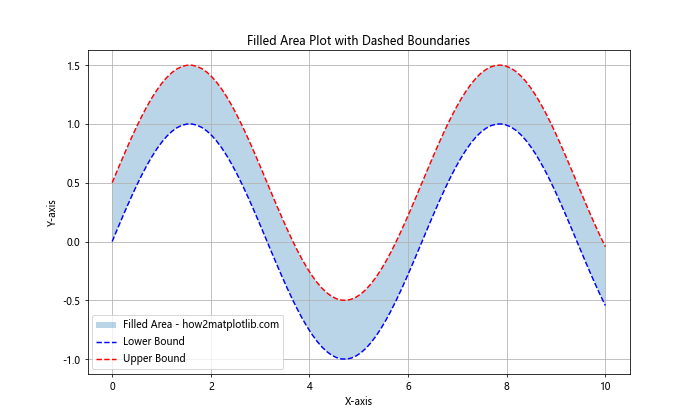
这个例子展示了如何使用虚线来绘制填充区域的上下边界,使得边界更加明显。
11. 在箱线图中使用虚线
箱线图通常用实线绘制,但我们可以使用虚线来表示某些特殊的统计信息或参考线。
import matplotlib.pyplot as plt
import numpy as np

np.random.seed(42)
data = [np.random.normal(0, std, 100) for std in range(1, 5)]

fig, ax = plt.subplots(figsize=(10, 6))
bp = ax.boxplot(data, patch_artist=True)

for median in bp['medians']:
    median.set(color='red', linewidth=2, linestyle='--')

ax.set_xticklabels(['Group 1', 'Group 2', 'Group 3', 'Group 4'])
ax.set_title('Box Plot with Dashed Median Lines')
ax.text(0.5, -0.15, 'how2matplotlib.com', transform=ax.transAxes, ha='center')

plt.show()
Output:
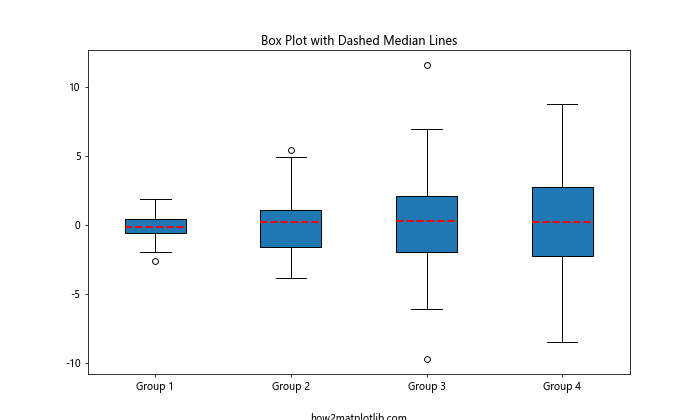
在这个例子中,我们将箱线图的中位数线设置为红色虚线,以突出显示这一重要统计信息。
12. 在热力图中使用虚线网格
虽然热力图主要由颜色块组成,但我们可以添加虚线网格来更清晰地分隔各个单元格。
import matplotlib.pyplot as plt
import numpy as np

data = np.random.rand(10, 10)

plt.figure(figsize=(10, 8))
plt.imshow(data, cmap='viridis')
plt.colorbar(label='Value')

# 添加虚线网格
for i in range(10):
    plt.axhline(y=i+0.5, color='white', linestyle='--', linewidth=0.5)
    plt.axvline(x=i+0.5, color='white', linestyle='--', linewidth=0.5)

plt.title('Heatmap with Dashed Grid Lines')
plt.xlabel('X-axis')
plt.ylabel('Y-axis')
plt.text(5, -1, 'how2matplotlib.com', ha='center')
plt.show()
Output:
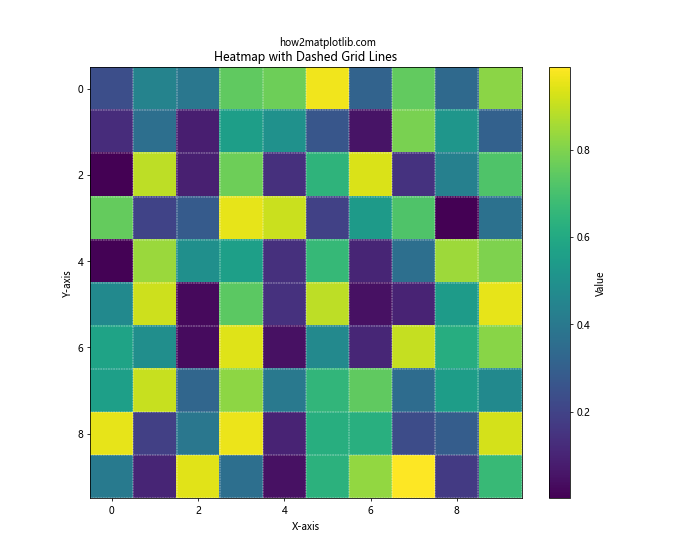
这个例子展示了如何在热力图中添加白色虚线网格,以更好地区分各个数据单元。
13. 在等高线图中使用虚线
等高线图通常用来表示三维表面的二维投影。使用虚线可以区分不同类型的等高线或强调某些特定的等高线。
import matplotlib.pyplot as plt
import numpy as np

x = np.linspace(-3, 3, 100)
y = np.linspace(-3, 3, 100)
X, Y = np.meshgrid(x, y)
Z = np.sin(X) * np.cos(Y)

plt.figure(figsize=(10, 8))
CS = plt.contour(X, Y, Z, levels=15, linestyles=['--', '-'], colors='k')
plt.clabel(CS, inline=True, fontsize=8)
plt.title('Contour Plot with Dashed and Solid Lines')
plt.xlabel('X-axis')
plt.ylabel('Y-axis')
plt.text(0, -3.5, 'how2matplotlib.com', ha='center')
plt.colorbar(label='Z-value')
plt.show()
Output:
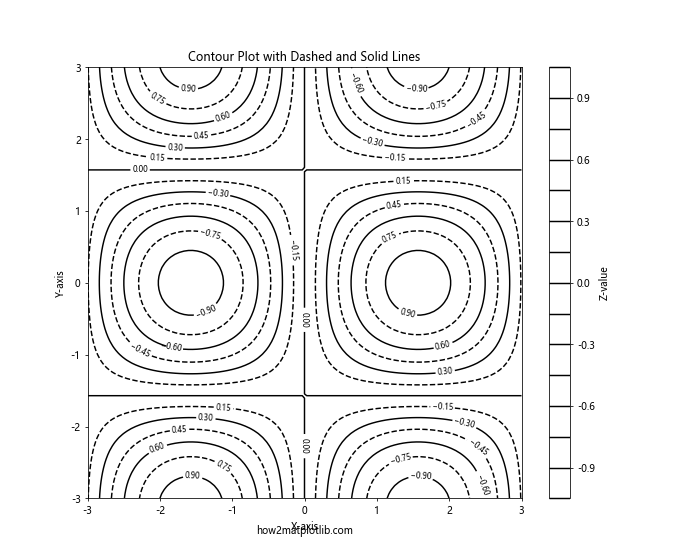
在这个例子中,我们交替使用实线和虚线来绘制等高线,这样可以更容易区分相邻的等高线。
14. 在雷达图中使用虚线
雷达图(也称为蜘蛛图或星图)是一种用于显示多变量数据的图表类型。使用虚线可以增加图表的可读性。
import matplotlib.pyplot as plt
import numpy as np

categories = ['A', 'B', 'C', 'D', 'E', 'F']
values = [4, 3, 5, 2, 4, 3]

angles = np.linspace(0, 2*np.pi, len(categories), endpoint=False)
values = np.concatenate((values, [values[0]]))  # 闭合多边形
angles = np.concatenate((angles, [angles[0]]))  # 闭合多边形

fig, ax = plt.subplots(figsize=(8, 8), subplot_kw=dict(projection='polar'))
ax.plot(angles, values, 'o-', linewidth=2, linestyle='--')
ax.fill(angles, values, alpha=0.25)
ax.set_thetagrids(angles[:-1] * 180/np.pi, categories)
ax.set_title('Radar Chart with Dashed Lines')
plt.text(0.5, -0.1, 'how2matplotlib.com', transform=ax.transAxes, ha='center')
plt.show()
Output:
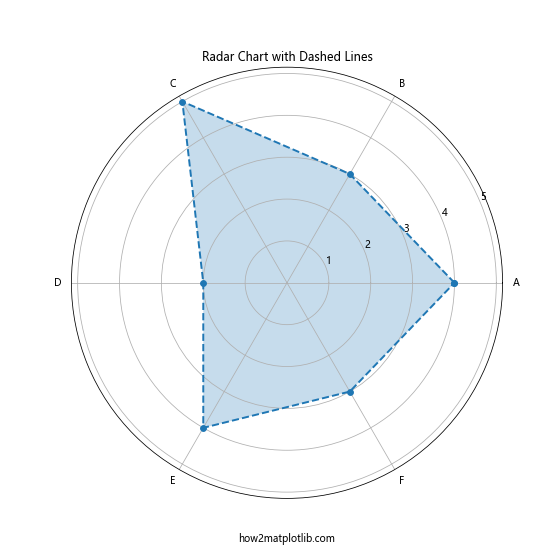
这个例子展示了如何使用虚线创建一个简单的雷达图,并用半透明的填充增强视觉效果。
15. 在对数坐标图中使用虚线
对数坐标图常用于显示跨越多个数量级的数据。使用虚线可以帮助读者更容易地跟踪数据点。
import matplotlib.pyplot as plt
import numpy as np

x = np.logspace(0, 5, 100)
y1 = x**2
y2 = x**1.5

plt.figure(figsize=(10, 6))
plt.loglog(x, y1, linestyle='--', label='y = x^2 - how2matplotlib.com')
plt.loglog(x, y2, linestyle=':', label='y = x^1.5 - how2matplotlib.com')
plt.title('Log-Log Plot with Different Dashed Lines')
plt.xlabel('X-axis (log scale)')
plt.ylabel('Y-axis (log scale)')
plt.legend()
plt.grid(True, which="both", ls="-", alpha=0.2)
plt.show()
Output:
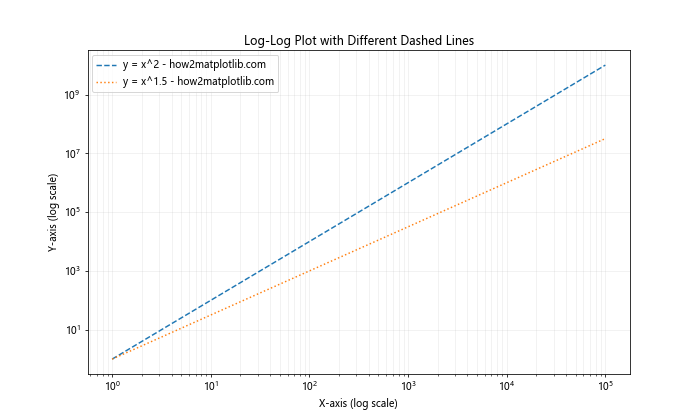
这个例子展示了如何在对数-对数坐标系中使用不同的虚线样式来区分不同的数据系列。
16. 在阶梯图中使用虚线
阶梯图用于显示离散的、阶梯状的数据变化。使用虚线可以使图形更加清晰,特别是当有多个数据系列时。
import matplotlib.pyplot as plt
import numpy as np

x = np.arange(10)
y1 = np.random.randint(1, 10, 10)
y2 = np.random.randint(1, 10, 10)

plt.figure(figsize=(10, 6))
plt.step(x, y1, where='mid', linestyle='--', label='Series 1 - how2matplotlib.com')
plt.step(x, y2, where='mid', linestyle=':', label='Series 2 - how2matplotlib.com')
plt.title('Step Plot with Different Dashed Lines')
plt.xlabel('X-axis')
plt.ylabel('Y-axis')
plt.legend()
plt.grid(True)
plt.show()
Output:
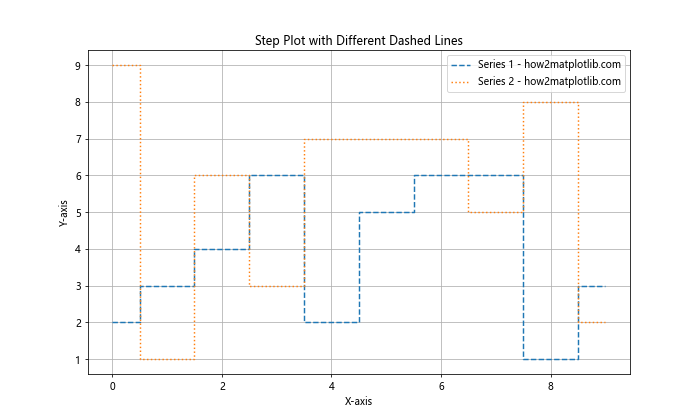
这个例子展示了如何在阶梯图中使用不同的虚线样式来区分两个数据系列。
17. 在极坐标条形图中使用虚线
极坐标条形图是一种独特的可视化方式,适用于显示周期性数据或比较不同类别的数据。使用虚线可以增加图表的层次感。
import matplotlib.pyplot as plt
import numpy as np

categories = ['A', 'B', 'C', 'D', 'E', 'F', 'G', 'H']
values = np.random.randint(1, 10, len(categories))

angles = np.linspace(0, 2*np.pi, len(categories), endpoint=False)

fig, ax = plt.subplots(figsize=(10, 10), subplot_kw=dict(projection='polar'))
bars = ax.bar(angles, values, width=0.5, bottom=0.0, alpha=0.5)

for bar in bars:
    bar.set_edgecolor('black')
    bar.set_linestyle('--')

ax.set_xticks(angles)
ax.set_xticklabels(categories)
ax.set_title('Polar Bar Chart with Dashed Edges')
plt.text(0.5, -0.1, 'how2matplotlib.com', transform=ax.transAxes, ha='center')
plt.show()
Output:
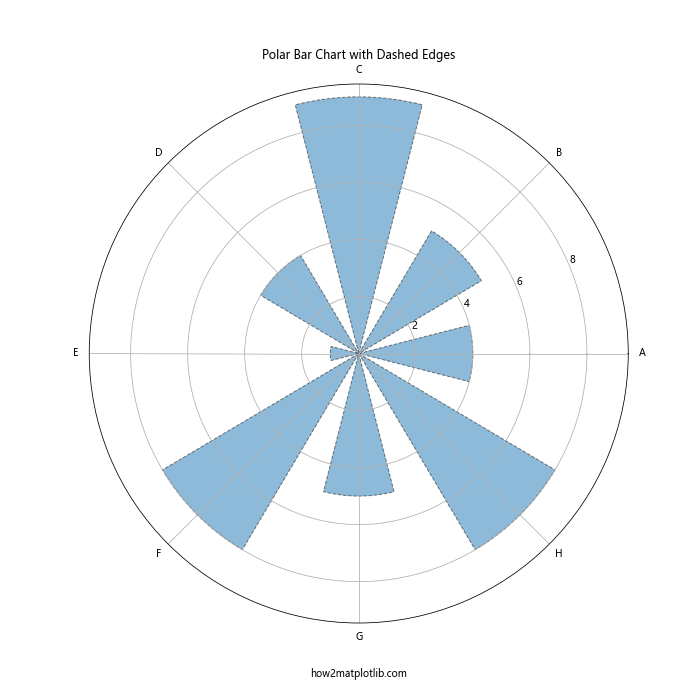
这个例子展示了如何创建一个极坐标条形图,并为每个条形添加虚线边缘。
18. 在堆叠面积图中使用虚线
堆叠面积图用于显示多个数据系列随时间的累积变化。使用虚线可以帮助区分不同的数据层。
import matplotlib.pyplot as plt
import numpy as np

x = np.arange(10)
y1 = np.random.randint(1, 10, 10)
y2 = np.random.randint(1, 10, 10)
y3 = np.random.randint(1, 10, 10)

plt.figure(figsize=(10, 6))
plt.stackplot(x, y1, y2, y3, labels=['Series 1', 'Series 2', 'Series 3'])
plt.plot(x, y1, linestyle='--', color='white', linewidth=2)
plt.plot(x, y1+y2, linestyle='--', color='white', linewidth=2)
plt.plot(x, y1+y2+y3, linestyle='--', color='white', linewidth=2)

plt.title('Stacked Area Plot with Dashed Boundaries')
plt.xlabel('X-axis')
plt.ylabel('Y-axis')
plt.legend(loc='upper left')
plt.text(5, -5, 'how2matplotlib.com', ha='center')
plt.show()
Output:
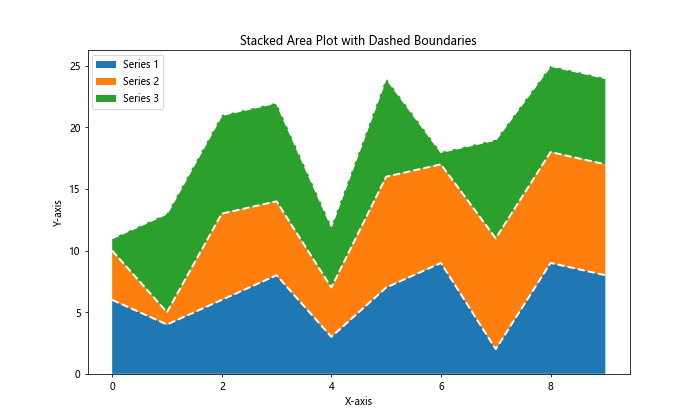
这个例子展示了如何在堆叠面积图中使用白色虚线来突出显示每个数据系列的边界。
结论
通过本文的详细介绍和丰富的示例,我们可以看到Matplotlib中虚线样式(Linestyle Dashed)的多样化应用。从基本的线图到复杂的3D图形,虚线样式都能在不同类型的图表中发挥重要作用,帮助我们更好地展示和区分数据。
虚线样式不仅可以用来绘制主要的数据线,还可以用于添加参考线、网格线、误差线等辅助元素。通过调整虚线的间隔和长度,我们可以创建各种自定义的线型效果,以满足不同的可视化需求。
在实际应用中,合理使用虚线样式可以提高图表的可读性和美观度。例如,在多数据系列的图表中,使用不同的虚线样式可以帮助读者更容易地区分和跟踪不同的数据线。在某些特殊的图表类型中,如极坐标图或3D图,虚线样式还可以增加图表的层次感和立体感。
需要注意的是,虽然虚线样式能够增加图表的表现力,但过度使用可能会导致图表变得杂乱。因此,在设计图表时,应当根据数据的特性和展示的目的,合理选择和搭配不同的线型样式。
总之,掌握Matplotlib中虚线样式的使用技巧,可以让我们的数据可视化作品更加专业和富有表现力。无论是进行科学研究、数据分析还是创建报告和演示文稿,灵活运用虚线样式都能帮助我们更好地传达数据背后的信息和洞见。
 极客教程
极客教程