matplotlib legend pos
在matplotlib中,legend用于标记图中的各种元素,包括线条、点和文本等。我们可以通过plt.legend()方法来添加legend,并且可以通过设置loc参数来指定legend的位置。
基本用法
下面是一个基本的例子,演示如何添加legend并设置其位置:
import matplotlib.pyplot as plt

x = [1, 2, 3, 4, 5]
y = [2, 3, 5, 7, 11]

plt.plot(x, y, label='Prime Numbers')
plt.legend(loc='upper right')

plt.show()
Output:
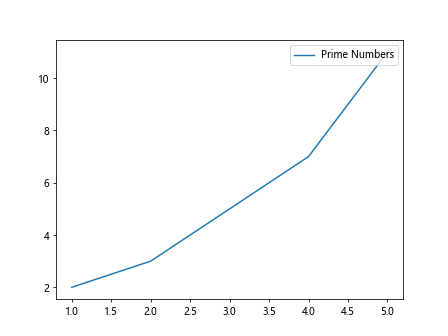
在上面的例子中,我们使用plt.plot()方法绘制了一条折线,并使用label='Prime Numbers'给这条线添加了一个标签。然后使用plt.legend(loc='upper right')将legend置于图的右上角。
设置位置
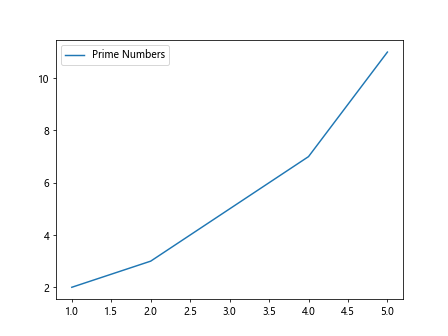
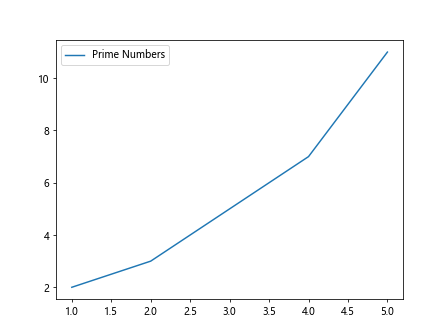
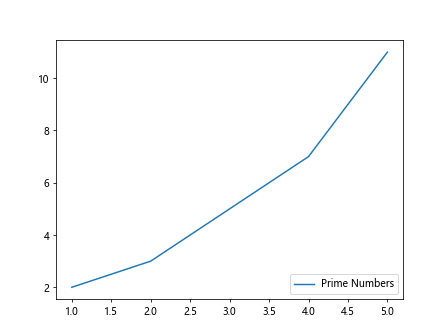
loc参数可以接受不同的字符串值来设置legend的位置,包括:’best’、’upper right’、’upper left’、’lower left’、’lower right’、’right’、’center left’、’center right’、’lower center’、’upper center’、’center’。
下面演示了不同位置的设置:
import matplotlib.pyplot as plt

x = [1, 2, 3, 4, 5]
y = [2, 3, 5, 7, 11]

plt.plot(x, y, label='Prime Numbers')
plt.legend(loc='best')

plt.show()
Output:
import matplotlib.pyplot as plt

x = [1, 2, 3, 4, 5]
y = [2, 3, 5, 7, 11]

plt.plot(x, y, label='Prime Numbers')
plt.legend(loc='upper left')

plt.show()
Output:
import matplotlib.pyplot as plt

x = [1, 2, 3, 4, 5]
y = [2, 3, 5, 7, 11]

plt.plot(x, y, label='Prime Numbers')
plt.legend(loc='lower right')

plt.show()
Output:
自定义位置
除了使用上述预设的位置外,我们还可以通过指定坐标的方式来自定义legend的位置。下面是一个例子:
import matplotlib.pyplot as plt

x = [1, 2, 3, 4, 5]
y = [2, 3, 5, 7, 11]

plt.plot(x, y, label='Prime Numbers')
plt.legend(loc=(0.2, 0.5))

plt.show()
Output:
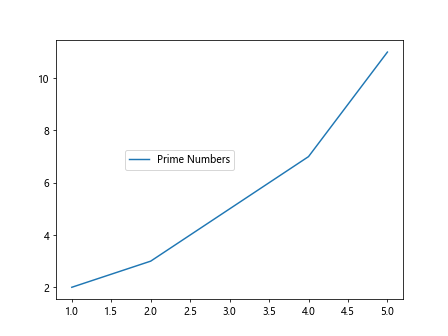
在上面的例子中,通过loc=(0.2, 0.5)来设置legend位置,其中(0.2, 0.5)表示legend的左上角距离图的左边和上边各占比20%的位置。
除了使用元组外,还可以使用以下字符串和数字的组合来自定义legend的位置:
– ‘upper right’ = 1
– ‘upper left’ = 2
– ‘lower left’ = 3
– ‘lower right’ = 4
– ‘right’ = 5
– ‘center left’ = 6
– ‘center right’ = 7
– ‘lower center’ = 8
– ‘upper center’ = 9
– ‘center’ = 10
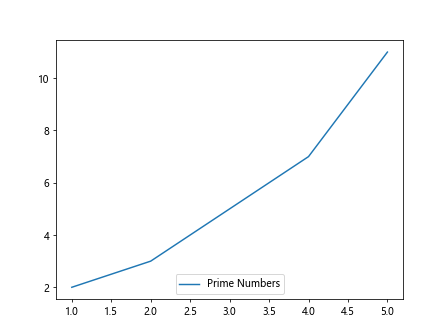
下面是一个使用数字来自定义位置的例子:
import matplotlib.pyplot as plt

x = [1, 2, 3, 4, 5]
y = [2, 3, 5, 7, 11]

plt.plot(x, y, label='Prime Numbers')
plt.legend(loc=8)

plt.show()
Output:
调整legend的大小
我们可以通过设置fontsize参数来调整legend的字体大小。下面是一个例子:
import matplotlib.pyplot as plt

x = [1, 2, 3, 4, 5]
y = [2, 3, 5, 7, 11]

plt.plot(x, y, label='Prime Numbers')
plt.legend(loc='lower right', fontsize=12)

plt.show()
Output:
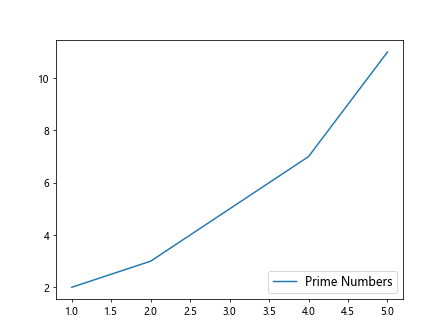
在上面的例子中,通过fontsize=12将legend的字体大小设置为12。
隐藏legend
有时候我们可能不需要显示legend,可以通过将plt.legend()中的参数设置为None来隐藏legend。
import matplotlib.pyplot as plt

x = [1, 2, 3, 4, 5]
y = [2, 3, 5, 7, 11]

plt.plot(x, y, label='Prime Numbers')
plt.legend(None)

plt.show()
总结
本文介绍了matplotlib中legend的位置设置方法,包括预设位置和自定义位置,以及调整legend大小和隐藏legend的方法。通过设置不同的位置和样式,可以让图中的legend更加清晰和美观。matplotlib提供了丰富的功能来帮助我们定制图中的legend,可以根据实际需求选择合适的设置。
 极客教程
极客教程