Matplotlib 图例颜色设置:全面指南与实用技巧
Matplotlib 是 Python 中最流行的数据可视化库之一,它提供了强大而灵活的工具来创建各种类型的图表。在数据可视化中,图例(legend)是一个非常重要的元素,它帮助读者理解图表中不同数据系列的含义。而图例的颜色设置则直接影响了图表的可读性和美观度。本文将深入探讨 Matplotlib 中图例颜色的设置方法,包括自定义颜色、颜色映射、透明度调整等多个方面,帮助你创建出更加专业和吸引人的数据可视化作品。
1. 基础图例颜色设置
在 Matplotlib 中,图例的颜色通常会自动继承对应数据系列的颜色。但有时我们需要手动设置或修改图例的颜色,以达到特定的视觉效果。以下是一些基础的图例颜色设置方法:
1.1 使用默认颜色
首先,让我们看一个使用默认颜色的简单示例:
import matplotlib.pyplot as plt

plt.figure(figsize=(8, 6))
plt.plot([1, 2, 3, 4], [1, 4, 2, 3], label='Line 1')
plt.plot([1, 2, 3, 4], [2, 3, 4, 1], label='Line 2')
plt.title('Default Legend Colors - how2matplotlib.com')
plt.legend()
plt.show()
Output:
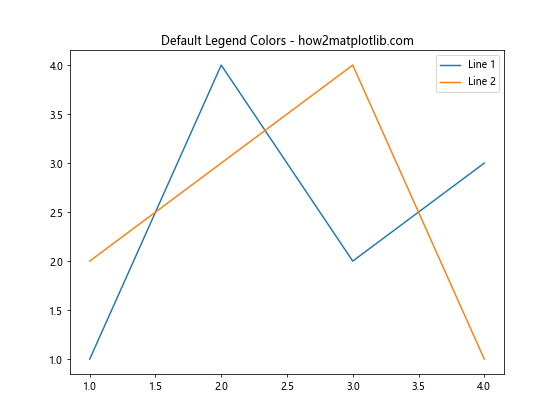
在这个例子中,我们绘制了两条线,并为每条线添加了标签。Matplotlib 会自动为这两条线分配不同的颜色,并在图例中显示相应的颜色。
1.2 手动设置线条颜色
如果我们想要手动控制线条的颜色,可以在 plot() 函数中使用 color 参数:
import matplotlib.pyplot as plt

plt.figure(figsize=(8, 6))
plt.plot([1, 2, 3, 4], [1, 4, 2, 3], color='red', label='Red Line')
plt.plot([1, 2, 3, 4], [2, 3, 4, 1], color='blue', label='Blue Line')
plt.title('Manual Color Setting - how2matplotlib.com')
plt.legend()
plt.show()
Output:
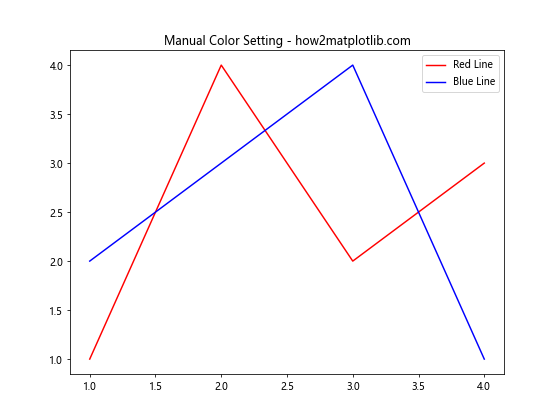
在这个例子中,我们明确指定了两条线的颜色为红色和蓝色。图例会自动继承这些颜色。
1.3 使用颜色名称
Matplotlib 支持多种颜色名称,你可以直接使用这些名称来设置颜色:
import matplotlib.pyplot as plt

plt.figure(figsize=(8, 6))
plt.plot([1, 2, 3, 4], [1, 4, 2, 3], color='forestgreen', label='Forest Green')
plt.plot([1, 2, 3, 4], [2, 3, 4, 1], color='darkorange', label='Dark Orange')
plt.title('Color Names - how2matplotlib.com')
plt.legend()
plt.show()
Output:
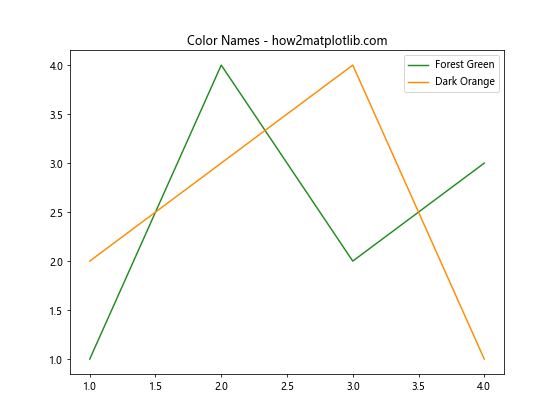
这个例子展示了如何使用 ‘forestgreen’ 和 ‘darkorange’ 这样的颜色名称来设置线条颜色。
2. 高级图例颜色设置
除了基础的颜色设置,Matplotlib 还提供了一些高级的颜色设置选项,让你能够更精细地控制图例的外观。
2.1 使用 RGB 值
你可以使用 RGB(红绿蓝)值来精确定义颜色:
import matplotlib.pyplot as plt

plt.figure(figsize=(8, 6))
plt.plot([1, 2, 3, 4], [1, 4, 2, 3], color=(0.1, 0.2, 0.5), label='RGB (0.1, 0.2, 0.5)')
plt.plot([1, 2, 3, 4], [2, 3, 4, 1], color=(0.8, 0.4, 0.1), label='RGB (0.8, 0.4, 0.1)')
plt.title('RGB Color Values - how2matplotlib.com')
plt.legend()
plt.show()
Output:
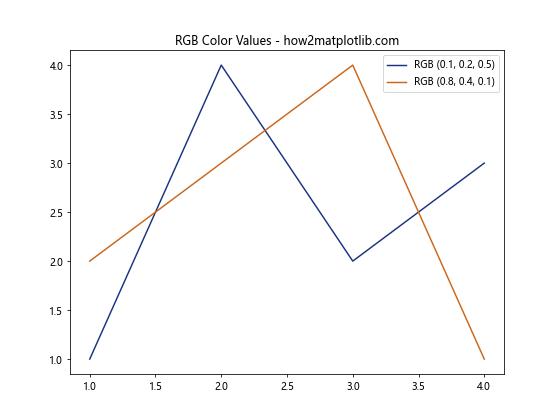
在这个例子中,我们使用了 RGB 元组来定义颜色。每个值的范围是 0 到 1。
2.2 使用十六进制颜色代码
十六进制颜色代码是另一种常用的颜色表示方法:
import matplotlib.pyplot as plt

plt.figure(figsize=(8, 6))
plt.plot([1, 2, 3, 4], [1, 4, 2, 3], color='#FF5733', label='#FF5733')
plt.plot([1, 2, 3, 4], [2, 3, 4, 1], color='#33FF57', label='#33FF57')
plt.title('Hexadecimal Color Codes - how2matplotlib.com')
plt.legend()
plt.show()
Output:
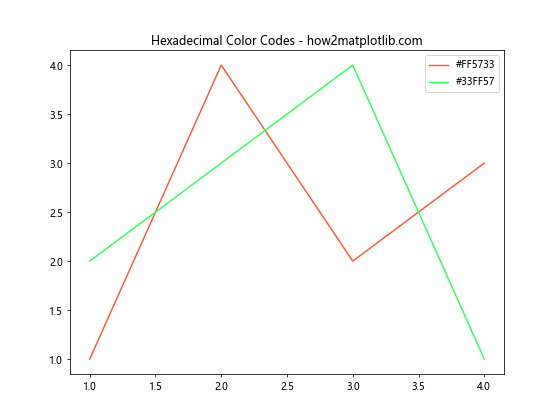
这个例子展示了如何使用十六进制颜色代码来设置线条颜色。
2.3 使用 RGBA 值
RGBA 值允许你设置颜色的透明度:
import matplotlib.pyplot as plt

plt.figure(figsize=(8, 6))
plt.plot([1, 2, 3, 4], [1, 4, 2, 3], color=(1, 0, 0, 0.5), label='Red (50% opacity)')
plt.plot([1, 2, 3, 4], [2, 3, 4, 1], color=(0, 0, 1, 0.5), label='Blue (50% opacity)')
plt.title('RGBA Color Values - how2matplotlib.com')
plt.legend()
plt.show()
Output:
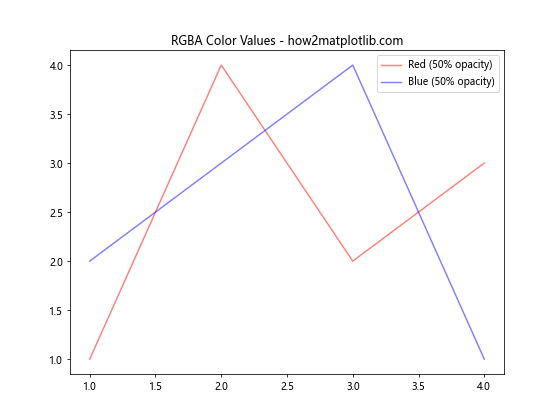
在这个例子中,我们使用了 RGBA 元组来定义颜色,其中第四个值表示透明度(0 表示完全透明,1 表示完全不透明)。
3. 自定义图例颜色
有时,我们可能想要图例的颜色与实际数据系列的颜色不同。Matplotlib 提供了多种方法来实现这一点。
3.1 使用 color 参数
在 legend() 函数中,我们可以使用 labelcolor 参数来设置图例文本的颜色:
import matplotlib.pyplot as plt

plt.figure(figsize=(8, 6))
plt.plot([1, 2, 3, 4], [1, 4, 2, 3], color='red', label='Line 1')
plt.plot([1, 2, 3, 4], [2, 3, 4, 1], color='blue', label='Line 2')
plt.title('Custom Legend Text Color - how2matplotlib.com')
plt.legend(labelcolor='green')
plt.show()
Output:
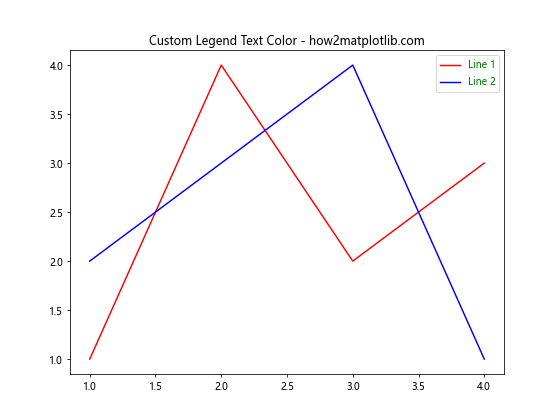
在这个例子中,尽管线条是红色和蓝色的,但图例文本都被设置为绿色。
3.2 使用 handle 参数
我们还可以通过创建自定义的图例句柄来更精细地控制图例的颜色:
import matplotlib.pyplot as plt
from matplotlib.lines import Line2D

plt.figure(figsize=(8, 6))
plt.plot([1, 2, 3, 4], [1, 4, 2, 3], color='red')
plt.plot([1, 2, 3, 4], [2, 3, 4, 1], color='blue')

custom_lines = [Line2D([0], [0], color='purple', lw=2),
                Line2D([0], [0], color='orange', lw=2)]

plt.title('Custom Legend Handles - how2matplotlib.com')
plt.legend(custom_lines, ['Line 1', 'Line 2'])
plt.show()
Output:
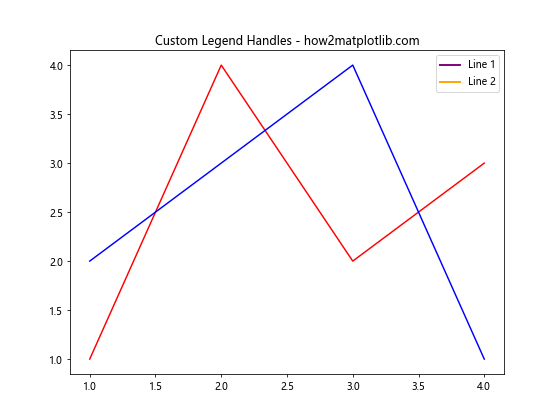
在这个例子中,我们创建了自定义的图例句柄,使图例中的颜色与实际线条的颜色不同。
4. 图例背景颜色设置
除了图例文本和标记的颜色,我们还可以自定义图例的背景颜色。
4.1 设置图例背景颜色
使用 facecolor 参数可以设置图例的背景颜色:
import matplotlib.pyplot as plt

plt.figure(figsize=(8, 6))
plt.plot([1, 2, 3, 4], [1, 4, 2, 3], label='Line 1')
plt.plot([1, 2, 3, 4], [2, 3, 4, 1], label='Line 2')
plt.title('Legend Background Color - how2matplotlib.com')
plt.legend(facecolor='lightgray')
plt.show()
Output:
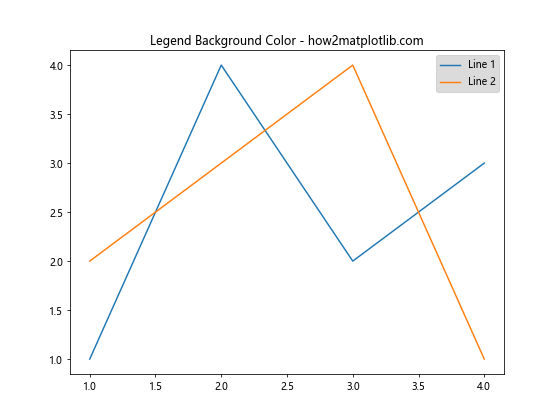
这个例子将图例的背景颜色设置为浅灰色。
4.2 设置图例边框颜色
我们还可以使用 edgecolor 参数来设置图例的边框颜色:
import matplotlib.pyplot as plt

plt.figure(figsize=(8, 6))
plt.plot([1, 2, 3, 4], [1, 4, 2, 3], label='Line 1')
plt.plot([1, 2, 3, 4], [2, 3, 4, 1], label='Line 2')
plt.title('Legend Border Color - how2matplotlib.com')
plt.legend(facecolor='white', edgecolor='red')
plt.show()
Output:
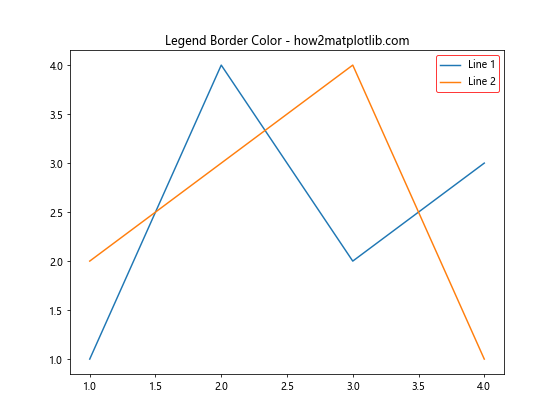
这个例子将图例的背景设置为白色,边框设置为红色。
5. 使用颜色映射
颜色映射(colormap)是一种将数值范围映射到颜色范围的方法。我们可以利用颜色映射来为图例创建渐变色效果。
5.1 使用内置颜色映射
Matplotlib 提供了多种内置的颜色映射:
import matplotlib.pyplot as plt
import numpy as np

plt.figure(figsize=(8, 6))
cmap = plt.get_cmap('viridis')
for i in range(5):
    plt.plot([1, 2, 3, 4], np.random.rand(4), color=cmap(i/4), label=f'Line {i+1}')
plt.title('Built-in Colormap - how2matplotlib.com')
plt.legend()
plt.show()
Output:
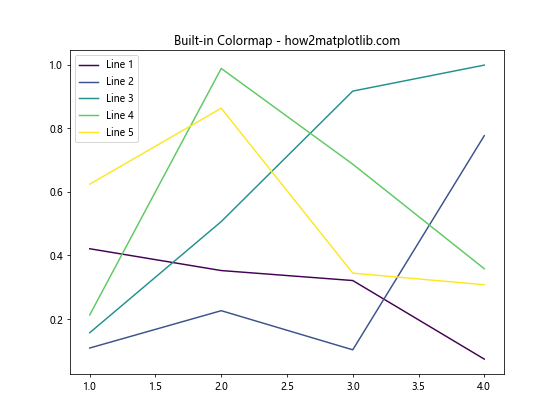
这个例子使用了 ‘viridis’ 颜色映射来为不同的线条分配颜色。
5.2 创建自定义颜色映射
我们还可以创建自定义的颜色映射:
import matplotlib.pyplot as plt
import matplotlib.colors as mcolors
import numpy as np

plt.figure(figsize=(8, 6))
colors = ['red', 'green', 'blue']
n_bins = 5
cmap = mcolors.LinearSegmentedColormap.from_list('custom_cmap', colors, N=n_bins)

for i in range(n_bins):
    plt.plot([1, 2, 3, 4], np.random.rand(4), color=cmap(i/(n_bins-1)), label=f'Line {i+1}')
plt.title('Custom Colormap - how2matplotlib.com')
plt.legend()
plt.show()
Output:
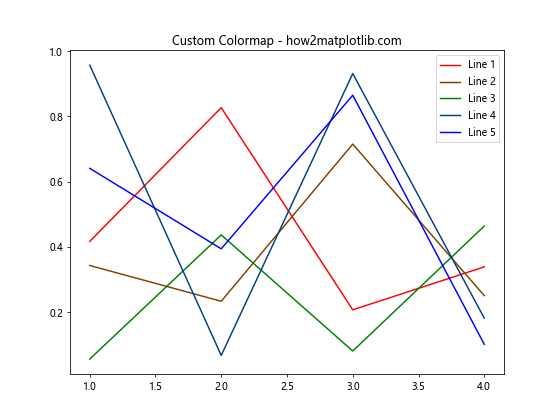
这个例子创建了一个从红色到绿色再到蓝色的自定义颜色映射。
6. 图例颜色与透明度
透明度是另一个可以用来增强图例视觉效果的重要属性。
6.1 设置图例整体透明度
我们可以使用 alpha 参数来设置整个图例的透明度:
import matplotlib.pyplot as plt

plt.figure(figsize=(8, 6))
plt.plot([1, 2, 3, 4], [1, 4, 2, 3], label='Line 1')
plt.plot([1, 2, 3, 4], [2, 3, 4, 1], label='Line 2')
plt.title('Legend Transparency - how2matplotlib.com')
plt.legend(facecolor='lightblue', edgecolor='blue', alpha=0.5)
plt.show()
这个例子将图例的整体透明度设置为 0.5。
6.2 设置单个图例项的透明度
我们还可以为图例中的单个项目设置不同的透明度:
import matplotlib.pyplot as plt
from matplotlib.patches import Patch

plt.figure(figsize=(8, 6))
plt.plot([1, 2, 3, 4], [1, 4, 2, 3])
plt.plot([1, 2, 3, 4], [2, 3, 4, 1])

legend_elements = [Patch(facecolor='red', edgecolor='r', label='Red', alpha=0.3),
                   Patch(facecolor='blue', edgecolor='b', label='Blue', alpha=0.7)]

plt.title('Individual Legend Item Transparency - how2matplotlib.com')
plt.legend(handles=legend_elements)
plt.show()
Output:
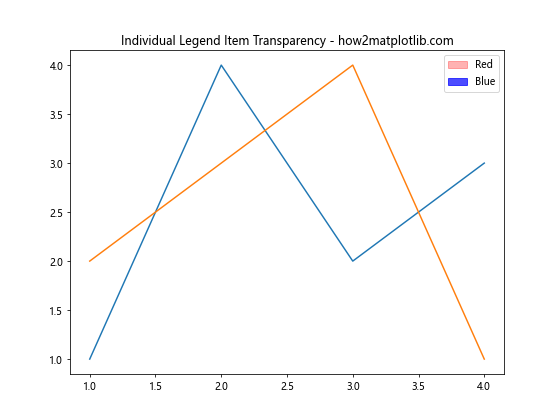
在这个例子中,我们创建了两个具有不同透明度的图例项。
7. 多列图例和颜色设置
当图例项目较多时,我们可能需要将图例排列成多列。
7.1 创建多列图例
使用 ncol 参数可以设置图例的列数:
import matplotlib.pyplot as plt
import numpy as np

plt.figure(figsize=(10, 6))
colors = plt.cm.rainbow(np.linspace(0, 1, 8))
for i, color in enumerate(colors):
    plt.plot([1, 2, 3, 4], np.random.rand(4), color=color, label=f'Line {i+1}')
plt.title('Multi-column Legend - how2matplotlib.com')
plt.legend(ncol=4, loc='upper center', bbox_to_anchor=(0.5, -0.05))
plt.show()
Output:
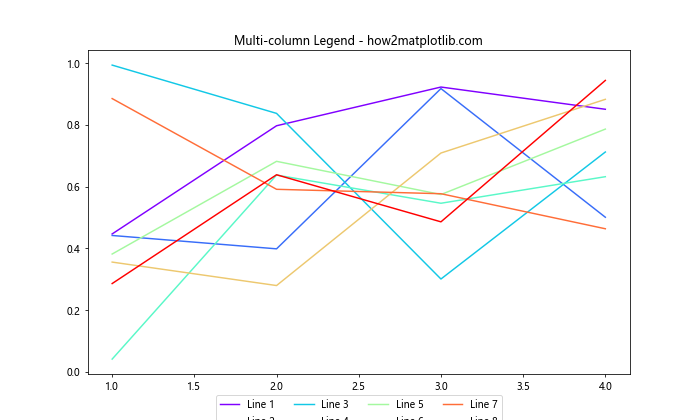
这个例子创建了一个 4 列的图例,并将其放置在图表下方。
7.2 为多列图例设置不同的颜色
对于多列图例,我们可以为每一列设置不同的颜色:
import matplotlib.pyplot as plt
import numpy as np
from matplotlib.patches import Patch

plt.figure(figsize=(10, 6))
colors = ['red', 'blue', 'green', 'orange']
legend_elements = []

for i, color in enumerate(colors):
    plt.plot([1, 2, 3, 4], np.random.rand(4), color=color)
    for j in range(2):
        legend_elements.append(Patch(facecolor=color, edgecolor=color,
                                     label=f'Column {i+1}, Item {j+1}'))

plt.title('Multi-column Legend with Different Colors - how2matplotlib.com')
plt.legend(handles=legend_elements, ncol=4, loc='upper center', bbox_to_anchor=(0.5, -0.05))
plt.show()
Output:
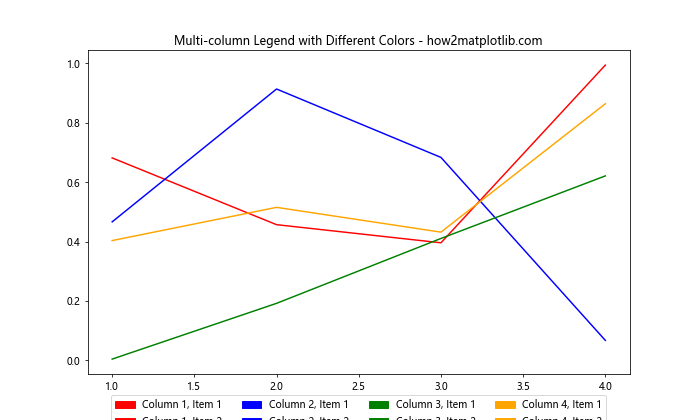
这个例子为每一列创建了两个图例项,每列使用不同的颜色。
8. 图例颜色与数据关联
有时,我们希望图例的颜色能够直接反映数据的某些特征。这可以通过将颜色与数据值关联来实现。
8.1 基于数据值设置颜色
我们可以根据数据的值来设置线条和图例的颜色:
import matplotlib.pyplot as plt
import numpy as np

plt.figure(figsize=(8, 6))
data = np.random.rand(4, 4)
cmap = plt.get_cmap('viridis')

for i, row in enumerate(data):
    color = cmap(np.mean(row))
    plt.plot(range(4), row, color=color, label=f'Line {i+1}')

plt.title('Color Based on Data Values - how2matplotlib.com')
plt.legend()
plt.show()
Output:
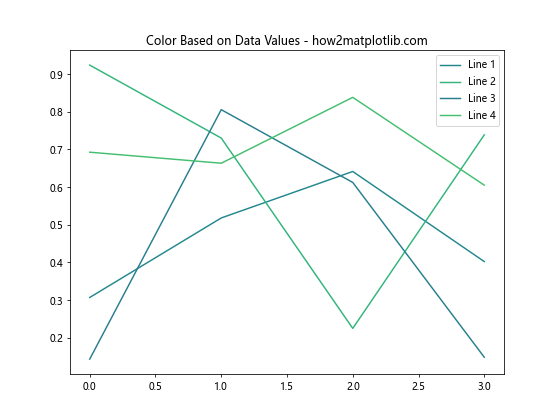
在这个例子中,每条线的颜色是基于其数据的平均值来设置的。
8.2 使用颜色条
我们还可以添加一个颜色条来显示颜色与数值的对应关系:
import matplotlib.pyplot as plt
import numpy as np

plt.figure(figsize=(10, 6))
data = np.random.rand(4, 4)
cmap = plt.get_cmap('viridis')

for i, row in enumerate(data):
    color = cmap(np.mean(row))
    plt.plot(range(4), row, color=color, label=f'Line {i+1}')

plt.title('Color Based on Data Values with Colorbar - how2matplotlib.com')
plt.legend()

sm = plt.cm.ScalarMappable(cmap=cmap, norm=plt.Normalize(vmin=0, vmax=1))
plt.colorbar(sm, label='Mean Value')

plt.show()
这个例子添加了一个颜色条,显示了颜色是如何与平均值对应的。
9. 动态图例颜色
在某些情况下,我们可能需要根据用户输入或其他条件动态更改图例的颜色。
9.1 基于用户输入更改颜色
这里是一个简单的例子,展示如何基于用户输入更改图例颜色:
import matplotlib.pyplot as plt

def plot_with_color(color):
    plt.figure(figsize=(8, 6))
    plt.plot([1, 2, 3, 4], [1, 4, 2, 3], color=color, label='Dynamic Color Line')
    plt.title(f'Dynamic Legend Color - {color} - how2matplotlib.com')
    plt.legend()
    plt.show()

# 假设这是用户输入的颜色
user_color = 'purple'
plot_with_color(user_color)
这个函数允许用户指定一个颜色,然后使用该颜色绘制图表和图例。
9.2 基于条件更改颜色
我们还可以基于某些条件动态更改颜色:
import matplotlib.pyplot as plt
import numpy as np

plt.figure(figsize=(8, 6))
data = np.random.rand(4, 4)

for i, row in enumerate(data):
    mean = np.mean(row)
    if mean > 0.5:
        color = 'red'
        label = f'High (mean={mean:.2f})'
    else:
        color = 'blue'
        label = f'Low (mean={mean:.2f})'
    plt.plot(range(4), row, color=color, label=label)

plt.title('Conditional Legend Colors - how2matplotlib.com')
plt.legend()
plt.show()
Output:
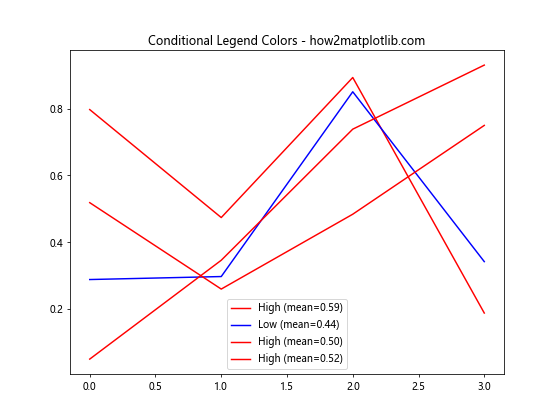
在这个例子中,根据每行数据的平均值来决定使用红色还是蓝色。
10. 图例颜色与样式结合
为了创建更具视觉吸引力的图例,我们可以将颜色与其他样式属性结合起来。
10.1 结合线型和颜色
我们可以在图例中结合不同的线型和颜色:
import matplotlib.pyplot as plt

plt.figure(figsize=(8, 6))
plt.plot([1, 2, 3, 4], [1, 4, 2, 3], color='red', linestyle='-', label='Solid Red')
plt.plot([1, 2, 3, 4], [2, 3, 4, 1], color='blue', linestyle='--', label='Dashed Blue')
plt.plot([1, 2, 3, 4], [3, 1, 4, 2], color='green', linestyle=':', label='Dotted Green')

plt.title('Combining Colors and Line Styles - how2matplotlib.com')
plt.legend()
plt.show()
Output:
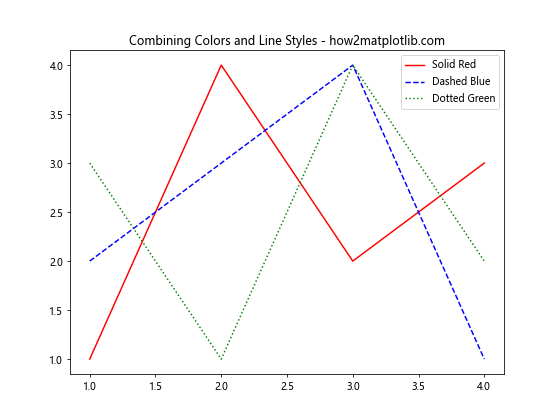
这个例子展示了如何在图例中结合不同的颜色和线型。
10.2 结合标记和颜色
我们还可以结合不同的标记和颜色:
import matplotlib.pyplot as plt

plt.figure(figsize=(8, 6))
plt.plot([1, 2, 3, 4], [1, 4, 2, 3], color='red', marker='o', label='Red Circles')
plt.plot([1, 2, 3, 4], [2, 3, 4, 1], color='blue', marker='s', label='Blue Squares')
plt.plot([1, 2, 3, 4], [3, 1, 4, 2], color='green', marker='^', label='Green Triangles')

plt.title('Combining Colors and Markers - how2matplotlib.com')
plt.legend()
plt.show()
Output:
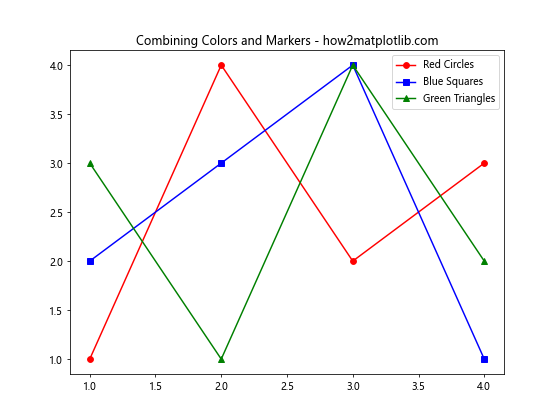
这个例子展示了如何在图例中结合不同的颜色和标记。
结论
通过本文的详细探讨,我们深入了解了 Matplotlib 中图例颜色设置的多种方法和技巧。从基础的颜色设置到高级的自定义选项,从使用颜色映射到动态更改颜色,我们涵盖了广泛的主题。这些技巧不仅可以帮助你创建更加美观和信息丰富的图表,还能让你的数据可视化作品更具专业性和吸引力。
记住,图例的颜色设置不仅仅是美学考虑,更重要的是要确保信息的清晰传达。在选择颜色时,要考虑可读性、色彩和谐以及与整体设计的一致性。同时,也要注意照顾到色盲读者,选择对比度适当的颜色组合。
最后,Matplotlib 的灵活性意味着你可以根据具体需求进行更多的自定义。不断实践和尝试新的方法,你会发现更多创新的方式来使用颜色增强你的数据可视化效果。希望这篇文章能够为你的 Matplotlib 使用之旅提供有价值的指导和灵感!
 极客教程
极客教程