Matplotlib标记带有坐标的数据点
参考:matplotlib label points with coordinates
在数据可视化中,经常需要在散点图或线图上标记数据点的具体坐标。在matplotlib中,我们可以使用annotate()函数来添加标签并指定标签的位置。本文将详细介绍如何使用annotate()函数在matplotlib中标记带有坐标的数据点。
1. 基本示例
import matplotlib.pyplot as plt

plt.figure(figsize=(6, 4))
plt.scatter([1, 2, 3], [3, 2, 4])

for i, txt in enumerate(['A', 'B', 'C']):
    plt.annotate(txt, (i+1, [3, 2, 4][i]))

plt.show()
Output:
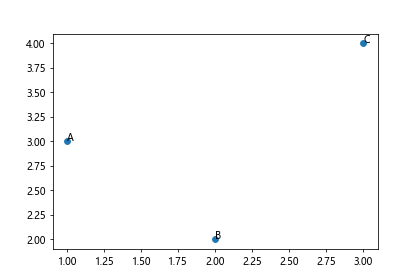
在上面的示例中,我们创建了一个简单的散点图,并使用annotate()函数在每个数据点上标记了对应的字母标签。
2. 指定坐标系
有时候我们希望坐标点的标签不是基于数据点的坐标系,而是基于图像的像素坐标系。我们可以通过设置参数xycoords=’axes points’来实现这一点。
import matplotlib.pyplot as plt

plt.figure(figsize=(6, 4))
plt.scatter([1, 2, 3], [3, 2, 4])

for i, txt in enumerate(['A', 'B', 'C']):
    plt.annotate(txt, (i+1, [3, 2, 4][i]), xycoords='axes points')

plt.show()
Output:
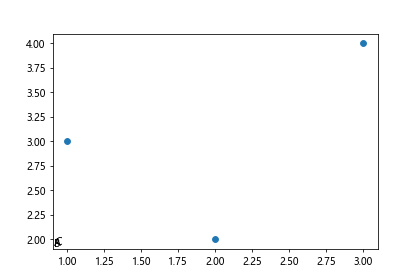
在上面的示例中,我们在annotate()函数中添加了参数xycoords=’axes points’,这样就将标签位置设定为基于坐标轴的像素位置。
3. 更改标签风格
我们还可以对标签的字体、颜色、大小等进行设置。下面是一个示例代码。
import matplotlib.pyplot as plt

plt.figure(figsize=(6, 4))
plt.scatter([1, 2, 3], [3, 2, 4])

for i, txt in enumerate(['A', 'B', 'C']):
    plt.annotate(txt, (i+1, [3, 2, 4][i]), xytext=(10, 10), textcoords='offset points', arrowprops=dict(arrowstyle='->', connectionstyle='arc3,rad=0.2'))

plt.show()
Output:
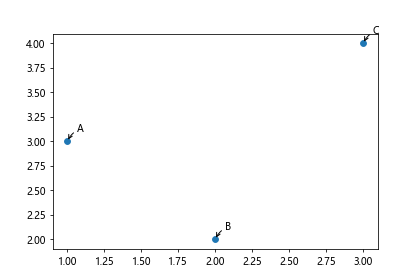
在上面的示例中,我们设置了标签的偏移量、箭头风格等参数,让标签看起来更加美观。
4. 使用箭头连接数据点和标签
有时候我们希望通过箭头连接数据点和标签,以进一步凸显数据点的位置。下面是一个示例代码。
import matplotlib.pyplot as plt

plt.figure(figsize=(6, 4))
plt.scatter([1, 2, 3], [3, 2, 4])

for i, txt in enumerate(['A', 'B', 'C']):
    plt.annotate(txt, (i+1, [3, 2, 4][i]), xytext=(0, 10), textcoords='offset points', arrowprops=dict(arrowstyle='->'))

plt.show()
Output:
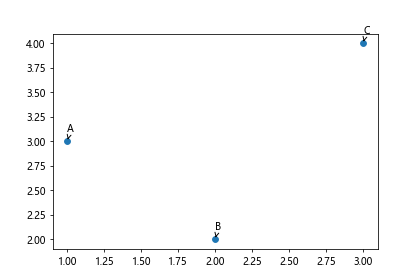
在上面的示例中,我们添加了带有箭头的连接线。
5. 自定义标签样式
除了基本的参数设置外,我们还可以通过设置fontdict参数来进一步自定义标签的样式。
import matplotlib.pyplot as plt

plt.figure(figsize=(6, 4))
plt.scatter([1, 2, 3], [3, 2, 4])

for i, txt in enumerate(['A', 'B', 'C']):
    plt.annotate(txt, (i+1, [3, 2, 4][i]), xytext=(10, 10), textcoords='offset points', fontdict={'fontsize': 12, 'color': 'red'})

plt.show()
在上面的示例中,我们设置了标签的字体大小和颜色。
6. 标记数据点的坐标
除了标记选择的文本外,我们还可以直接标记数据点的坐标。下面是一个示例代码。
import matplotlib.pyplot as plt

plt.figure(figsize=(6, 4))
plt.scatter([1, 2, 3], [3, 2, 4])

for x, y in zip([1, 2, 3], [3, 2, 4]):
    plt.annotate(f'({x}, {y})', (x, y), xytext=(10, 10), textcoords='offset points')

plt.show()
Output:
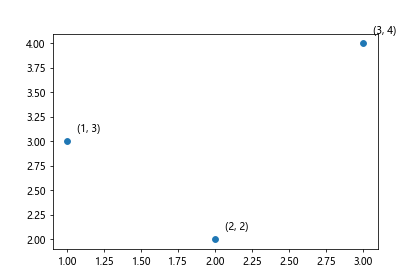
在上面的示例中,我们直接标记了每个数据点的坐标。
7. 标记数据点的索引
有时候我们需要标记数据点的索引值,方便在数据分析中进行参考。下面是一个示例代码。
import matplotlib.pyplot as plt

plt.figure(figsize=(6, 4))
plt.scatter([1, 2, 3], [3, 2, 4])

for i, (x, y) in enumerate(zip([1, 2, 3], [3, 2, 4])):
    plt.annotate(f'Point {i}', (x, y), xytext=(10, 10), textcoords='offset points')

plt.show()
Output:
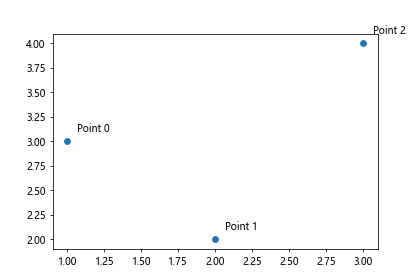
在上面的示例中,我们标记了每个数据点的索引值。
8. 标记全部数据点
有时候我们希望在散点图中标记所有的数据点,而不仅仅是几个特殊的点。下面是一个示例代码。
import matplotlib.pyplot as plt

x = [1, 2, 3, 4, 5]
y = [1, 4, 9, 16, 25]

plt.figure(figsize=(6, 4))
plt.scatter(x, y)

for i, (x_i, y_i) in enumerate(zip(x, y)):
    plt.annotate(f'({x_i}, {y_i})', (x_i, y_i), xytext=(10, 10), textcoords='offset points')

plt.show()
Output:
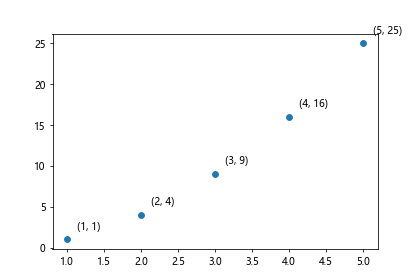
在上面的示例中,我们标记了散点图中所有的数据点坐标。
9. 指定标签的对齐方式
在标记数据点时,有时候我们需要指定标签的对齐方式。下面是一个示例代码。
import matplotlib.pyplot as plt

plt.figure(figsize=(6, 4))
plt.scatter([1, 2, 3], [3, 2, 4])

for i, txt in enumerate(['A', 'B', 'C']):
    plt.annotate(txt, (i+1, [3, 2, 4][i]), xytext=(10, 10), textcoords='offset points', horizontalalignment='right', verticalalignment='top')

plt.show()
Output:
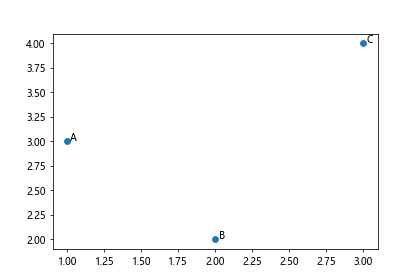
在上面的示例中,我们指定了标签相对于数据点的对齐方式。
10. 使用标签框
有时候我们需要标签拥有一个框来增加其可读性。下面是一个示例代码。
import matplotlib.pyplot as plt

plt.figure(figsize=(6, 4))
plt.scatter([1, 2, 3], [3, 2, 4])

for i, txt in enumerate(['A', 'B', 'C']):
    plt.annotate(txt, (i+1, [3, 2, 4][i]), bbox=dict(facecolor='red', alpha=0.5))

plt.show()
Output:
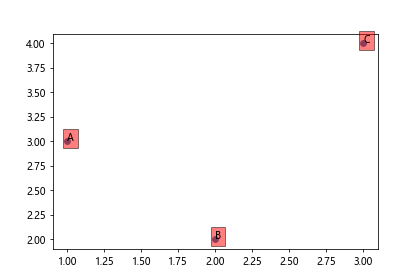
在上面的示例中,我们使用了bbox参数来设置标签的框样式。
11. 指定箭头的风格
在连接数据点和标签时,我们可以通过设置arrowprops参数来指定箭头的风格。下面是一个示例代码。
import matplotlib.pyplot as plt

plt.figure(figsize=(6, 4))
plt.scatter([1, 2, 3], [3, 2, 4])

for i, txt in enumerate(['A', 'B', 'C']):
    plt.annotate(txt, (i+1, [3, 2, 4][i]), xytext=(10, 10), textcoords='offset points', arrowprops=dict(arrowstyle='fancy', color='green'))

plt.show()
Output:
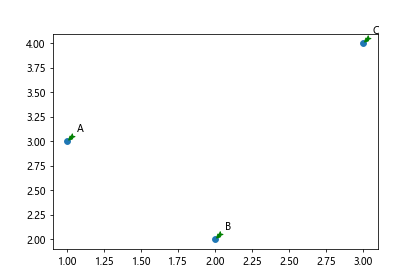
在上面的示例中,我们将箭头风格设置为’fancy’,并指定了箭头的颜色为绿色。
12. 使用标签旋转
如果标签很长,可能会与其他标签重叠,此时我们可以通过设置rotation参数来旋转标签。下面是一个示例代码。
import matplotlib.pyplot as plt

plt.figure(figsize=(6, 4))
plt.scatter([1, 2, 3], [3, 2, 4])

for i, txt in enumerate(['Long label 1', 'Long label 2', 'Long label 3']):
    plt.annotate(txt, (i+1, [3, 2, 4][i]), xytext=(10, 10), textcoords='offset points', rotation=45)

plt.show()
Output:
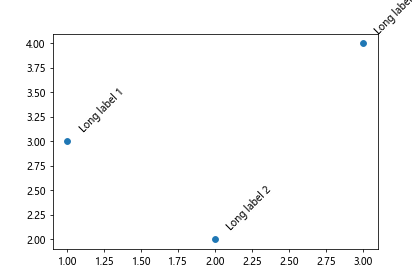
在上面的示例中,我们设置了标签的旋转角度为45度。
13. 在线图中标记数据点
除了散点图外,我们也可以在线图中标记数据点。下面是一个示例代码。
import matplotlib.pyplot as plt

x = [1, 2, 3, 4, 5]
y = [1, 4, 9, 16, 25]

plt.figure(figsize=(6, 4))
plt.plot(x, y, marker='o')

for i, (x_i, y_i) in enumerate(zip(x, y)):
    plt.annotate(f'({x_i}, {y_i})', (x_i, y_i), xytext=(10, 10), textcoords='offset points')

plt.show()
Output:
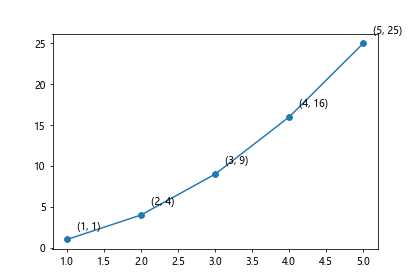
在上面的示例中,我们在线图中标记了数据点的坐标。
14. 结合不同类型的标签
有时候我们需要在一个图中结合不同类型的标签,比如文字标签、箭头标签等。下面是一个示例代码。
import matplotlib.pyplot as plt

plt.figure(figsize=(6, 4))
plt.scatter([1, 2, 3], [3, 2, 4])

plt.annotate('A', (1, 3), xytext=(10, 10), textcoords='offset points')
plt.annotate('B', (2, 2), xytext=(10, -10), textcoords='offset points', arrowprops=dict(arrowstyle='->'))

plt.show()
Output:
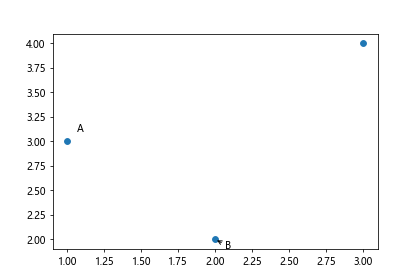
在上面的示例中,我们结合了简单的文字标签和带箭头的标签。
15. 自定义标签位置
除了直接在数据点上标记外,我们也可以手动指定标签的位置。下面是一个示例代码。
import matplotlib.pyplot as plt

plt.figure(figsize=(6, 4))
plt.scatter([1, 2, 3], [3, 2, 4])

plt.annotate('Custom label', (2, 3), xy=(2, 3), xycoords='data', xytext=(10, 10), textcoords='offset points', arrowprops=dict(arrowstyle='->'))

plt.show()
在上面的示例中,我们手动指定了标签的位置。
16. 标记不同分组的数据点
如果数据点分属于不同的分组,我们可以通过添加不同颜色或形状的标记来区分。下面是一个示例代码。
import matplotlib.pyplot as plt

x1 = [1, 2, 3]
y1 = [3, 2, 4]
x2 = [4, 5, 6]
y2 = [5, 4, 6]

plt.figure(figsize=(6, 4))
plt.scatter(x1, y1, color='red', marker='o', label='Group 1')
plt.scatter(x2, y2, color='blue', marker='s', label='Group 2')

for i, (x, y) in enumerate(zip(x1+y2, y1+y2)):
    plt.annotate(f'({x}, {y})', (x, y), xytext=(10, 10), textcoords='offset points')

plt.legend()
plt.show()
Output:
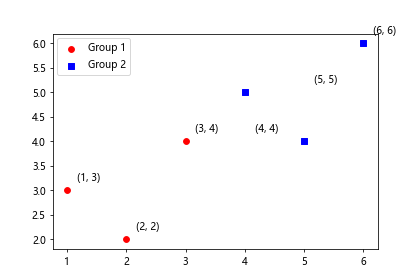
在上面的示例中,我们使用不同颜色和形状的标记来区分不同分组的数据点,并在每个数据点上标记了坐标。
17. 批量标记数据点
如果数据点数量较多,我们也可以批量标记数据点,通过循环依次标记每个点。下面是一个示例代码。
import matplotlib.pyplot as plt

x = [1, 2, 3, 4, 5]
y = [1, 4, 9, 16, 25]

plt.figure(figsize=(6, 4))
plt.scatter(x, y)

for i, (x_i, y_i) in enumerate(zip(x, y)):
    plt.annotate(f'({x_i}, {y_i})', (x_i, y_i), xytext=(10, 10), textcoords='offset points')

plt.show()
Output:
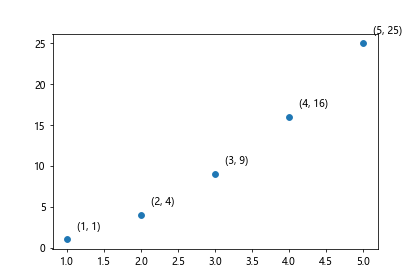
在上面的示例中,我们使用循环批量标记了数据点的坐标。
18. 离散型数据点的标记
除了连续型数据点外,我们还可以在离散型数据点上标记。下面是一个示例代码。
import matplotlib.pyplot as plt

x = ['A', 'B', 'C']
y = [3, 2, 4]

plt.figure(figsize=(6, 4))
plt.scatter(x, y)

for i, (x_i, y_i) in enumerate(zip(x, y)):
    plt.annotate(f'({x_i}, {y_i})', (x_i, y_i), xytext=(10, 10), textcoords='offset points')

plt.show()
Output:
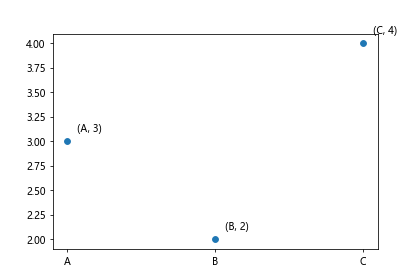
在上面的示例中,我们在离散型数据点上标记了坐标。
19. 标记数据点的数值
有时候我们希望在数据点上标记其具体数值,而不是坐标。下面是一个示例代码。
import matplotlib.pyplot as plt

x = [1, 2, 3, 4, 5]
y = [1, 4, 9, 16, 25]

plt.figure(figsize=(6, 4))
plt.scatter(x, y)

for i, y_i in enumerate(y):
    plt.annotate(y_i, (x[i], y_i), xytext=(10, 10), textcoords='offset points')

plt.show()
Output:
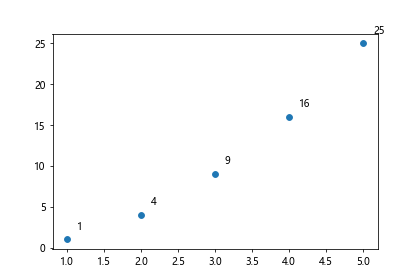
在上面的示例中,我们在数据点上标记了其具体数值。
20. 使用箭头标记数据点
除了简单的文字标签外,我们也可以使用箭头来标记数据点。下面是一个示例代码。
import matplotlib.pyplot as plt

plt.figure(figsize=(6, 4))
plt.scatter([1, 2, 3], [3, 2, 4])

plt.annotate('Start', (1, 3), xytext=(10, 10), textcoords='offset points', arrowprops=dict(arrowstyle='->'))
plt.annotate('End', (3, 4), xytext=(10, 10), textcoords='offset points', arrowprops=dict(arrowstyle='->'))

plt.show()
Output:
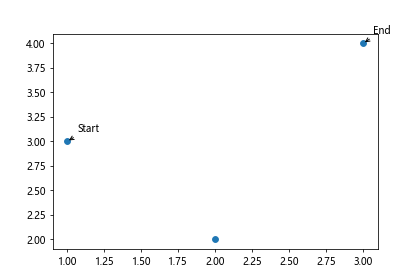
在上面的示例中,我们使用箭头标记了两个数据点。
 极客教程
极客教程