如何使用matplotlib来标注点
在使用matplotlib进行数据可视化时,有时候我们需要在图表中标注某些特殊的点,以便更加清晰地展示数据。在matplotlib中,通过使用annotate函数可以很容易地为图表中的点添加标签。本文将介绍如何使用matplotlib来标注点,并提供一些示例代码。
基本用法
首先,我们需要导入matplotlib库,并创建一个简单的散点图:
import matplotlib.pyplot as plt

x = [1, 2, 3, 4, 5]
y = [2, 3, 5, 7, 11]

plt.scatter(x, y)
plt.show()
Output:
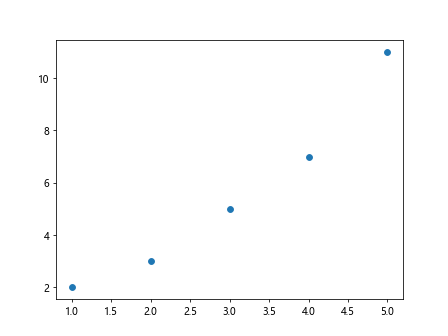
接下来,我们可以使用annotate函数来为图表中的某个点添加标签:
import matplotlib.pyplot as plt

x = [1, 2, 3, 4, 5]
y = [2, 3, 5, 7, 11]

plt.annotate('Prime', (3, 5), xytext=(3.5, 6), arrowprops=dict(arrowstyle='->'))
plt.show()
Output:
在上面的示例中,我们为点(3, 5)添加了一个标签”Prime”,并设置了标签文本的位置为(3.5, 6)。
自定义标签样式
我们可以通过设置fontsize、color、bbox等参数来自定义标签的样式。下面是一个示例代码:
import matplotlib.pyplot as plt

x = [1, 2, 3, 4, 5]
y = [2, 3, 5, 7, 11]

plt.annotate('how2matplotlib.com', (1, 2), xytext=(1.5, 2.5), fontsize=12, color='red',
             arrowprops=dict(arrowstyle='->'), bbox=dict(facecolor='yellow', edgecolor='black', boxstyle='round,pad=0.5'))
plt.show()
Output:
在上面的示例中,我们设置了标签的字体大小为12,颜色为红色,背景颜色为黄色,边框颜色为黑色,边框样式为圆角矩形。
标注多个点
如果我们需要在图表中标注多个点,可以使用一个循环来逐个添加标签。下面是一个示例代码:
import matplotlib.pyplot as plt

x = [1, 2, 3, 4, 5]
y = [2, 3, 5, 7, 11]

labels = ['A', 'B', 'C', 'D', 'E']

for label, x_val, y_val in zip(labels, x, y):
    plt.annotate(label, (x_val, y_val), xytext=(x_val + 0.1, y_val + 0.1), arrowprops=dict(arrowstyle='->'))

plt.show()
Output:
在上面的示例中,我们通过一个循环为每个点添加了一个标签,标签内容分别为’A’、’B’、’C’、’D’、’E’。
标注最大值和最小值
有时候我们需要在图表中标注最大值和最小值,可以通过一些简单的方法实现。下面是一个示例代码:
import matplotlib.pyplot as plt

x = [1, 2, 3, 4, 5]
y = [2, 3, 5, 7, 11]

max_x = max(x)
max_y = max(y)
min_x = min(x)
min_y = min(y)

plt.annotate(f'Max: {max_x}, {max_y}', (max_x, max_y), xytext=(max_x + 0.1, max_y + 0.1), arrowprops=dict(arrowstyle='->'))
plt.annotate(f'Min: {min_x}, {min_y}', (min_x, min_y), xytext=(min_x + 0.1, min_y + 0.1), arrowprops=dict(arrowstyle='->'))

plt.show()
Output:
在上面的示例中,我们找到了x和y的最大值和最小值,并在图表中分别标注了最大值和最小值。
结语
通过本文的介绍,我们了解了如何在matplotlib中标注点,并且提供了一些示例代码来演示基本用法、自定义标签样式、标注多个点以及标注最大值和最小值。
 极客教程
极客教程