matplotlib grid behind bars
参考:Matplotlib Grid Behind Bars
引言
在数据可视化领域,Matplotlib 是一个常用的Python库。它提供了丰富的绘图功能,可以轻松创建各种类型的统计图表和图形。本文将介绍如何在Matplotlib中绘制柱状图时将网格线放置在柱子的后面,以提高图表的可读性和美观性。
背景
在Matplotlib中,默认情况下,网格线会覆盖在柱状图的柱子上。这可能会使柱子的边线部分变得模糊或难以分辨。为了解决这个问题,我们希望将网格线放置在柱子的后面。这样,柱子的边线将清晰可见,网格线也能提供更好的参考线。
解决方案
要实现在Matplotlib中将网格线放置在柱状图的背后,我们需要使用以下步骤:
步骤1:导入所需的库
import matplotlib.pyplot as plt
import numpy as np
步骤2:创建示例数据
这里我们将使用一个简单的例子来说明。假设我们要绘制一个月度销售额的柱状图。
months = ['Jan', 'Feb', 'Mar', 'Apr', 'May']
sales = [10000, 15000, 12000, 18000, 9000]
步骤3:绘制柱状图和网格线
在绘制柱状图之前,我们先绘制网格线,并将其放置在柱子的后面。
plt.grid(axis='y', color='gray', linestyle='-', linewidth=0.5, alpha=0.5, zorder=0)
这里的zorder参数用于确定绘图元素的绘制顺序。值越大,绘制的顺序越靠后。
步骤4:绘制柱状图
plt.bar(months, sales)
步骤5:设置图表标题和坐标轴标签
plt.title('Monthly Sales')
plt.xlabel('Months')
plt.ylabel('Sales')
步骤6:显示图表
plt.show()
示例
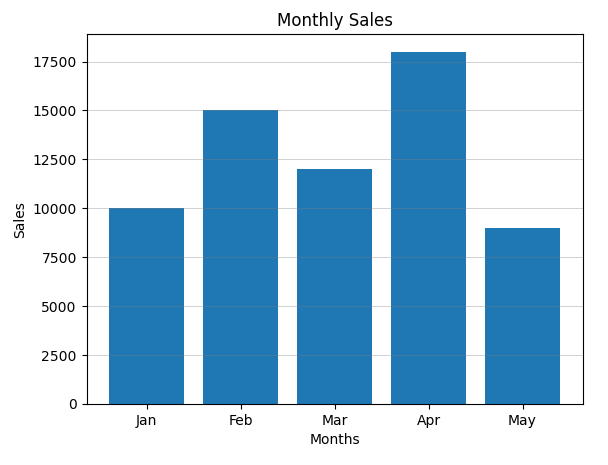
下面是完整的示例代码和运行结果:
import matplotlib.pyplot as plt
import numpy as np

months = ['Jan', 'Feb', 'Mar', 'Apr', 'May']
sales = [10000, 15000, 12000, 18000, 9000]

plt.grid(axis='y', color='gray', linestyle='-', linewidth=0.5, alpha=0.5, zorder=0)
plt.bar(months, sales)

plt.title('Monthly Sales')
plt.xlabel('Months')
plt.ylabel('Sales')

plt.show()

如上图所示,网格线被放置在柱子的后面,使得柱子边线清晰可见。
结论
本文介绍了如何在Matplotlib中将网格线放置在柱状图的背后。通过使用zorder参数,我们可以调整网格线和柱子的绘制顺序,以达到更好的可读性和美观度。
 极客教程
极客教程