Matplotlib中使用errorbar函数绘制带误差线的散点图
matplotlib errorbar marker
Matplotlib是Python中最流行的数据可视化库之一,它提供了丰富的绘图功能,可以创建各种类型的图表和可视化效果。在数据分析和科学研究中,我们经常需要绘制带有误差线的散点图,以展示数据点的不确定性或变异性。Matplotlib的errorbar函数就是专门用于绘制这种图表的工具。
errorbar函数不仅可以绘制误差线,还可以自定义数据点的标记(marker)样式,使图表更加美观和信息丰富。本文将详细介绍如何使用Matplotlib的errorbar函数绘制带误差线的散点图,并重点讨论如何设置和自定义数据点的标记。
1. errorbar函数的基本用法
首先,让我们从errorbar函数的基本用法开始。这个函数允许我们绘制带有误差线的数据点,误差线可以是对称的或非对称的。
以下是一个简单的示例:
import matplotlib.pyplot as plt
import numpy as np

# 生成示例数据
x = np.linspace(0, 10, 10)
y = np.sin(x)
yerr = 0.1 + 0.2 * np.random.rand(10)

# 创建图形和坐标轴
fig, ax = plt.subplots(figsize=(10, 6))

# 绘制带误差线的散点图
ax.errorbar(x, y, yerr=yerr, fmt='o', label='Data')

# 设置图表标题和轴标签
ax.set_title('Simple Errorbar Plot - how2matplotlib.com')
ax.set_xlabel('X-axis')
ax.set_ylabel('Y-axis')

# 添加图例
ax.legend()

# 显示网格
ax.grid(True)

# 保存图形
plt.savefig('simple_errorbar_plot.png')

# 显示图形
plt.show()

print("图形已保存为 simple_errorbar_plot.png")
Output:
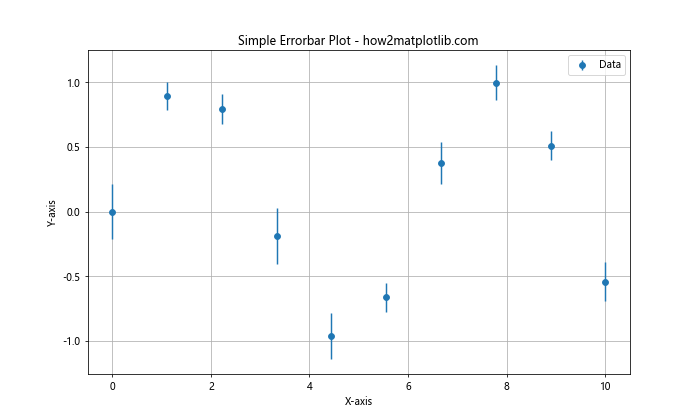
在这个示例中,我们首先导入了必要的库:Matplotlib的pyplot模块和NumPy。然后,我们生成了一些示例数据:x是一个从0到10的等间隔序列,y是x的正弦值,yerr是随机生成的误差值。
接下来,我们使用plt.subplots()创建了一个图形和坐标轴对象。errorbar()函数用于绘制带误差线的散点图。这个函数的主要参数包括:
- x:x轴数据
- y:y轴数据
- yerr:y轴方向的误差值
- fmt:数据点的格式字符串,’o’表示圆形标记
- label:图例标签
我们还设置了图表标题、轴标签,添加了图例和网格,最后保存并显示了图形。
这个示例展示了errorbar函数的基本用法,但它只是冰山一角。接下来,我们将深入探讨如何自定义误差线和标记的样式。
2. 自定义误差线样式
errorbar函数提供了多个参数来自定义误差线的样式。我们可以调整误差线的颜色、线型、宽度等属性。
下面是一个展示如何自定义误差线样式的示例:
import matplotlib.pyplot as plt
import numpy as np

# 生成示例数据
x = np.linspace(0, 10, 15)
y = np.exp(-x/10)
yerr = 0.1 + 0.1 * np.random.rand(15)

# 创建图形和坐标轴
fig, ax = plt.subplots(figsize=(12, 7))

# 绘制带自定义误差线的散点图
ax.errorbar(x, y, yerr=yerr, fmt='o',
            ecolor='red', elinewidth=2, capsize=5, capthick=2,
            label='Custom Errorbar')

# 设置图表标题和轴标签
ax.set_title('Errorbar Plot with Custom Error Line Style - how2matplotlib.com')
ax.set_xlabel('X-axis')
ax.set_ylabel('Y-axis')

# 添加图例
ax.legend()

# 显示网格
ax.grid(True, linestyle='--', alpha=0.7)

# 保存图形
plt.savefig('custom_errorbar_style.png')

# 显示图形
plt.show()

print("图形已保存为 custom_errorbar_style.png")
Output:
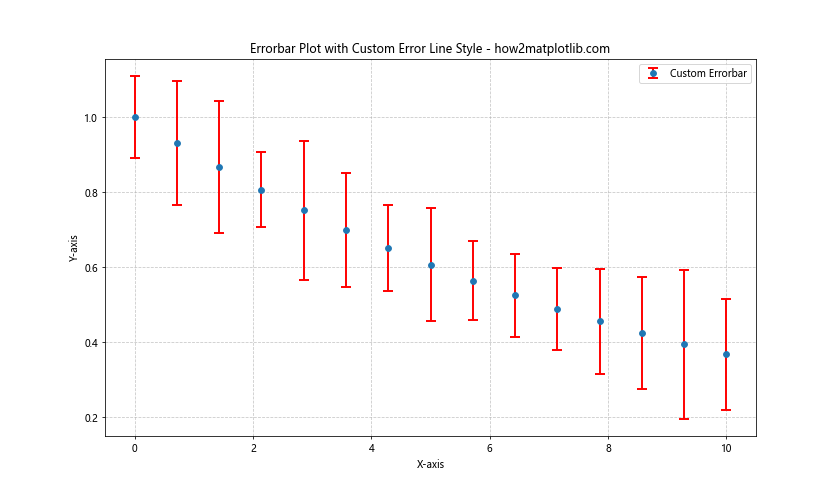
在这个示例中,我们使用了以下参数来自定义误差线的样式:
- ecolor:设置误差线的颜色为红色
- elinewidth:设置误差线的宽度为2
- capsize:设置误差线端点的大小为5
- capthick:设置误差线端点的粗细为2
这些参数允许我们精细地控制误差线的外观,使其更加突出或与其他图表元素协调。
3. 设置不同的上下误差
在某些情况下,数据点的上下误差可能不同。errorbar函数允许我们为每个数据点设置不同的上下误差。
以下是一个示例,展示如何设置不同的上下误差:
import matplotlib.pyplot as plt
import numpy as np

# 生成示例数据
x = np.linspace(0, 10, 12)
y = np.sin(x) + 1
yerr_lower = 0.1 + 0.2 * np.random.rand(12)
yerr_upper = 0.2 + 0.3 * np.random.rand(12)

# 创建图形和坐标轴
fig, ax = plt.subplots(figsize=(12, 7))

# 绘制带不同上下误差的散点图
ax.errorbar(x, y, yerr=[yerr_lower, yerr_upper], fmt='s',
            ecolor='purple', capsize=4,
            label='Asymmetric Errors')

# 设置图表标题和轴标签
ax.set_title('Errorbar Plot with Asymmetric Errors - how2matplotlib.com')
ax.set_xlabel('X-axis')
ax.set_ylabel('Y-axis')

# 添加图例
ax.legend()

# 显示网格
ax.grid(True, linestyle=':', alpha=0.6)

# 保存图形
plt.savefig('asymmetric_errorbar.png')

# 显示图形
plt.show()

print("图形已保存为 asymmetric_errorbar.png")
Output:
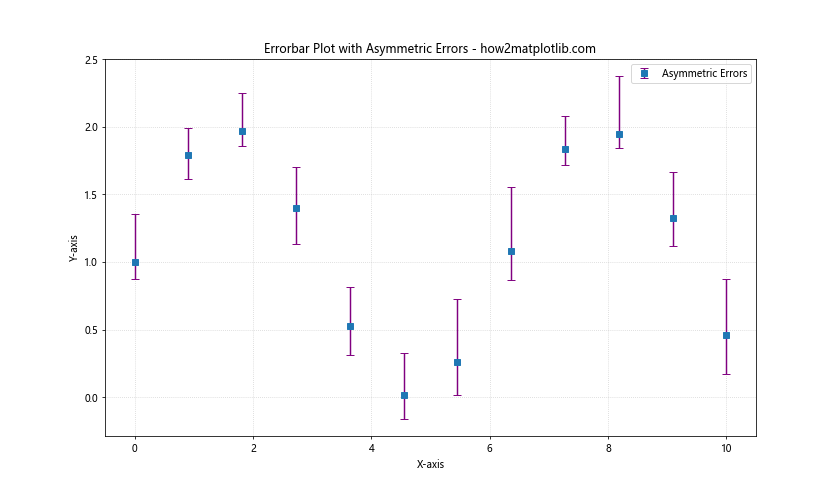
在这个示例中,我们为yerr参数传递了一个包含两个数组的列表:[yerr_lower, yerr_upper]。yerr_lower表示下误差,yerr_upper表示上误差。这样,我们就可以为每个数据点设置不同的上下误差。
注意,我们还将fmt参数设置为’s’,这会使用方形标记来表示数据点。
4. 自定义标记样式
errorbar函数的fmt参数不仅控制线型,还可以设置数据点的标记样式。我们可以使用各种预定义的标记,如圆形、方形、三角形等,也可以自定义标记的大小和颜色。
以下是一个展示如何自定义标记样式的示例:
import matplotlib.pyplot as plt
import numpy as np

# 生成示例数据
x = np.linspace(0, 8, 9)
y1 = np.sin(x)
y2 = np.cos(x)
yerr1 = 0.1 + 0.1 * np.random.rand(9)
yerr2 = 0.1 + 0.1 * np.random.rand(9)

# 创建图形和坐标轴
fig, ax = plt.subplots(figsize=(12, 7))

# 绘制两组带自定义标记的误差线图
ax.errorbar(x, y1, yerr=yerr1, fmt='o', markersize=8, capsize=4,
            label='Sin(x) - Circles')
ax.errorbar(x, y2, yerr=yerr2, fmt='s', markersize=8, capsize=4,
            label='Cos(x) - Squares')

# 设置图表标题和轴标签
ax.set_title('Errorbar Plot with Custom Markers - how2matplotlib.com')
ax.set_xlabel('X-axis')
ax.set_ylabel('Y-axis')

# 添加图例
ax.legend()

# 显示网格
ax.grid(True, linestyle='--', alpha=0.5)

# 保存图形
plt.savefig('custom_marker_errorbar.png')

# 显示图形
plt.show()

print("图形已保存为 custom_marker_errorbar.png")
Output:
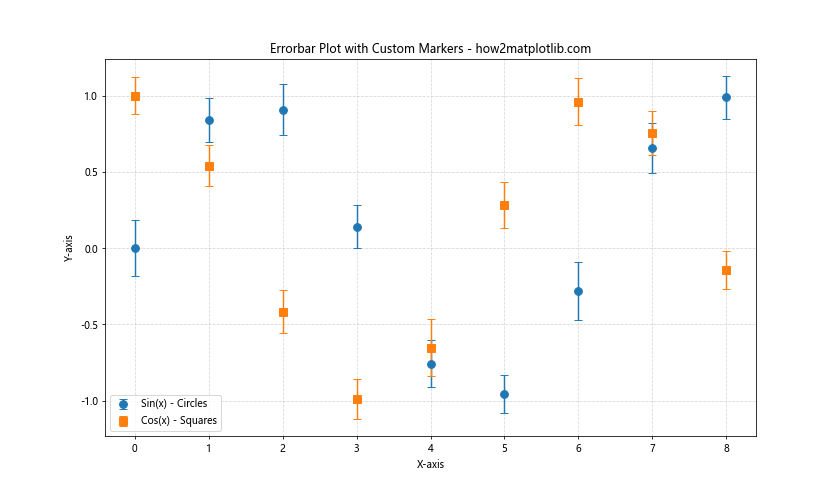
在这个示例中,我们绘制了两组数据:正弦和余弦函数。对于正弦函数,我们使用圆形标记(’o’),对于余弦函数,我们使用方形标记(’s’)。markersize参数用于设置标记的大小。
这种方法允许我们在同一图表中区分不同的数据系列,使图表更加清晰和信息丰富。
5. 使用不同颜色的标记和误差线
有时,我们可能希望数据点的标记和误差线使用不同的颜色。errorbar函数允许我们分别设置这些元素的颜色。
以下是一个示例,展示如何为标记和误差线设置不同的颜色:
import matplotlib.pyplot as plt
import numpy as np

# 生成示例数据
x = np.linspace(0, 10, 11)
y = np.exp(-x/10)
yerr = 0.1 + 0.2 * np.random.rand(11)

# 创建图形和坐标轴
fig, ax = plt.subplots(figsize=(12, 7))

# 绘制带不同颜色标记和误差线的散点图
ax.errorbar(x, y, yerr=yerr, fmt='o', markersize=8,
            color='blue', ecolor='red', capsize=5,
            label='Data with Different Colors')

# 设置图表标题和轴标签
ax.set_title('Errorbar Plot with Different Colors - how2matplotlib.com')
ax.set_xlabel('X-axis')
ax.set_ylabel('Y-axis')

# 添加图例
ax.legend()

# 显示网格
ax.grid(True, linestyle=':', alpha=0.6)

# 保存图形
plt.savefig('different_color_errorbar.png')

# 显示图形
plt.show()

print("图形已保存为 different_color_errorbar.png")
Output:
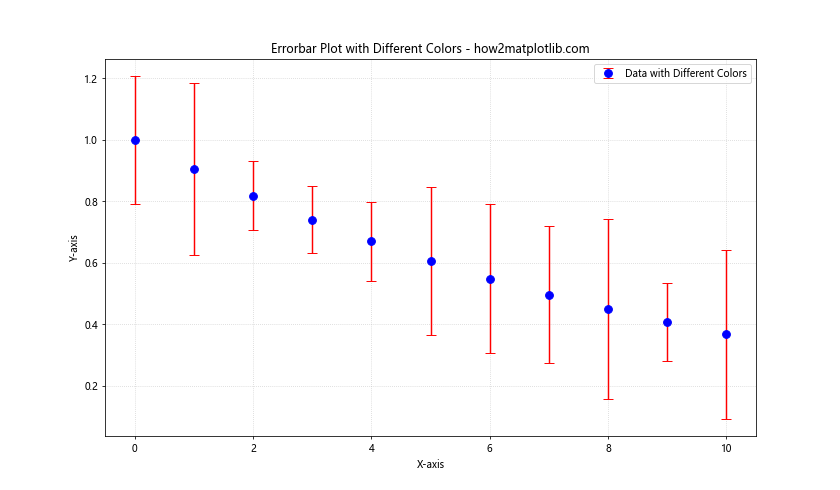
在这个示例中,我们使用color参数设置标记的颜色为蓝色,使用ecolor参数设置误差线的颜色为红色。这种对比可以使数据点和误差线更加突出,便于观察。
6. 添加水平误差线
虽然我们通常关注垂直方向的误差,但有时也需要表示水平方向的误差。errorbar函数允许我们同时添加水平和垂直误差线。
以下是一个展示如何添加水平误差线的示例:
import matplotlib.pyplot as plt
import numpy as np

# 生成示例数据
x = np.linspace(1, 10, 10)
y = np.log(x)
xerr = 0.2 + 0.3 * np.random.rand(10)
yerr = 0.1 + 0.2 * np.random.rand(10)

# 创建图形和坐标轴
fig, ax = plt.subplots(figsize=(12, 7))

# 绘制带水平和垂直误差线的散点图
ax.errorbar(x, y, xerr=xerr, yerr=yerr, fmt='D',
            ecolor='green', capsize=4, capthick=2,
            label='Data with X and Y Errors')

# 设置图表标题和轴标签
ax.set_title('Errorbar Plot with Horizontal and Vertical Errors - how2matplotlib.com')
ax.set_xlabel('X-axis')
ax.set_ylabel('Y-axis')

# 添加图例
ax.legend()

# 显示网格
ax.grid(True, linestyle='--', alpha=0.5)

# 保存图形
plt.savefig('horizontal_vertical_errorbar.png')

# 显示图形
plt.show()

print("图形已保存为 horizontal_vertical_errorbar.png")
Output:
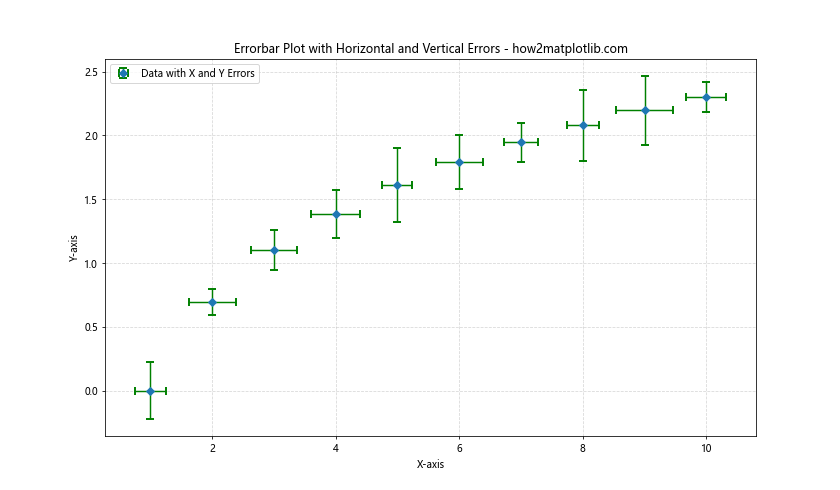
在这个示例中,我们使用xerr参数添加了水平误差线。同时,我们使用了菱形标记(’D’)来表示数据点。这种方法可以同时展示x和y方向的不确定性,适用于两个变量都有误差的情况。
7. 使用填充区域表示误差范围
除了使用误差线,我们还可以使用填充区域来表示误差范围。这种方法可以更直观地展示数据的变异性。
以下是一个使用填充区域表示误差范围的示例:
import matplotlib.pyplot as plt
import numpy as np

# 生成示例数据
x = np.linspace(0, 10, 50)
y = np.sin(x)
yerr = 0.2 + 0.1 * np.random.rand(50)

# 创建图形和坐标轴
fig, ax = plt.subplots(figsize=(12, 7))

# 绘制数据点
ax.plot(x, y, 'o-', label='Data')

# 添加填充区域表示误差范围
ax.fill_between(x, y - yerr, y + yerr, alpha=0.3, label='Error Range')

# 设置图表标题和轴标签
ax.set_title('Error Range Plot with Filled Area - how2matplotlib.com')
ax.set_xlabel('X-axis')
ax.set_ylabel('Y-axis')

# 添加图例
ax.legend()

# 显示网格
ax.grid(True, linestyle=':', alpha=0.6)

# 保存图形
plt.savefig('filled_error_range.png')

# 显示图形
plt.show()

print("图形已保存为 filled_error_range.png")
Output:
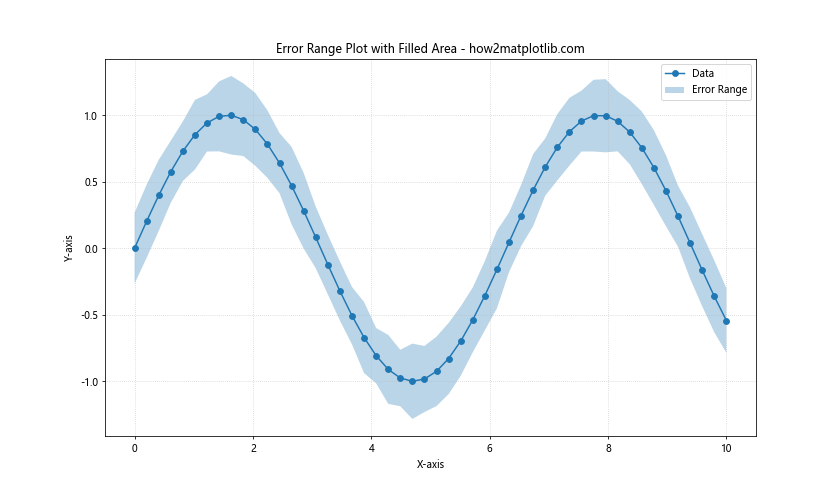
在这个示例中,我们首先使用plot函数绘制了数据点和连接线。然后,我们使用fill_between函数创建了一个填充区域来表示误差范围。这个函数接受x值、下边界(y – yerr)和上边界(y + yerr)作为参数。alpha参数用于设置填充区域的透明度。
这种方法可以很好地展示数据的整体趋势和不确定性范围,特别适合于数据点较多的情况。
8. 组合多种样式
在实际应用中,我们可能需要在同一图表中组合多种样式的errorbar图。这可以帮助我们比较不同数据集或突出显示某些特定数据点。
以下是一个组合多种样式的示例:
import matplotlib.pyplot as plt
import numpy as np

# 生成示例数据
x = np.linspace(0, 10, 11)
y1 = np.sin(x)
y2 = np.cos(x)
yerr1 = 0.1 + 0.1 * np.random.rand(11)
yerr2 = 0.2 + 0.2 * np.random.rand(11)

# 创建图形和坐标轴
fig, ax = plt.subplots(figsize=(12, 7))

# 绘制第一组数据:带误差线的散点图
ax.errorbar(x, y1, yerr=yerr1, fmt='o', markersize=8, capsize=5,
            label='Sin(x) with Errorbars')

# 绘制第二组数据:带填充区域的线图
ax.plot(x, y2, 's-', label='Cos(x)')
ax.fill_between(x, y2 - yerr2, y2 + yerr2, alpha=0.3)

# 设置图表标题和轴标签
ax.set_title('Combined Errorbar Styles - how2matplotlib.com')
ax.set_xlabel('X-axis')
ax.set_ylabel('Y-axis')

# 添加图例
ax.legend()

# 显示网格
ax.grid(True, linestyle='--', alpha=0.5)

# 保存图形
plt.savefig('combined_errorbar_styles.png')

# 显示图形
plt.show()

print("图形已保存为 combined_errorbar_styles.png")
Output:
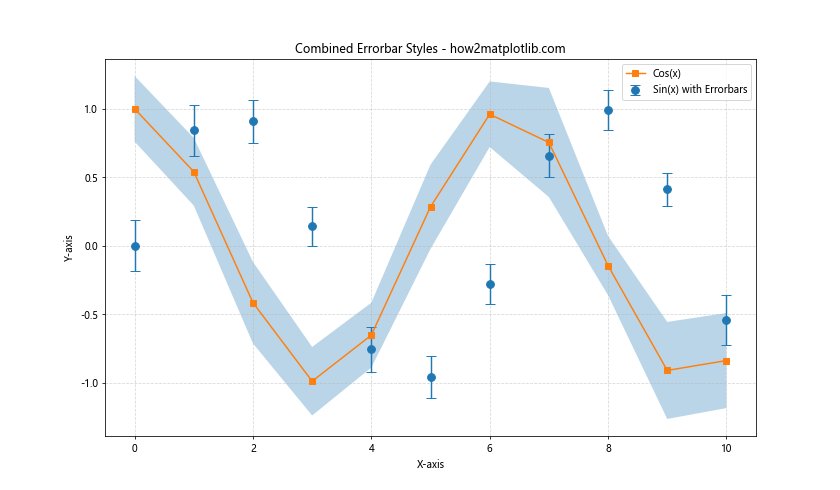
在这个示例中,我们为正弦函数使用了传统的errorbar样式,而为余弦函数使用了带填充区域的线图。这种组合可以在同一图表中展示不同类型的数据和误差表示方法。
9. 自定义标记样式
Matplotlib提供了丰富的标记样式选项,我们可以使用这些选项来创建独特的errorbar图。以下是一个展示如何使用自定义标记的示例:
import matplotlib.pyplot as plt
import numpy as np

# 生成示例数据
x = np.linspace(0, 10, 6)
y = np.exp(-x/10)
yerr = 0.1 + 0.2 * np.random.rand(6)

# 创建图形和坐标轴
fig, ax = plt.subplots(figsize=(12, 7))

# 定义自定义标记
custom_marker = {
    'marker': 'D',
    'markersize': 10,
    'markerfacecolor': 'yellow',
    'markeredgecolor': 'red',
    'markeredgewidth': 2
}

# 绘制带自定义标记的errorbar图
ax.errorbar(x, y, yerr=yerr, fmt='none', ecolor='blue', capsize=5,
            label='Data with Custom Marker')
ax.plot(x, y, linestyle='none', **custom_marker)

# 设置图表标题和轴标签
ax.set_title('Errorbar Plot with Custom Marker - how2matplotlib.com')
ax.set_xlabel('X-axis')
ax.set_ylabel('Y-axis')

# 添加图例
ax.legend()

# 显示网格
ax.grid(True, linestyle=':', alpha=0.6)

# 保存图形
plt.savefig('custom_marker_style.png')

# 显示图形
plt.show()

print("图形已保存为 custom_marker_style.png")
Output:
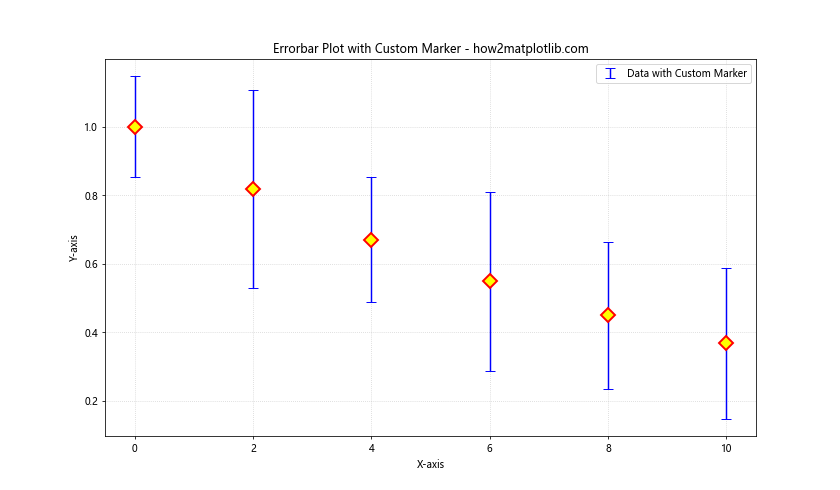
在这个示例中,我们定义了一个自定义标记字典,包含了标记的形状、大小、填充颜色、边缘颜色和边缘宽度。然后,我们使用errorbar函数绘制误差线,并使用plot函数单独绘制自定义标记。这种方法允许我们创建非常独特和引人注目的数据点标记。
10. 在3D空间中使用errorbar
虽然errorbar函数主要用于2D图表,但我们也可以在3D图表中使用类似的技术来表示误差。以下是一个在3D空间中表示误差的示例:
import matplotlib.pyplot as plt
import numpy as np
from mpl_toolkits.mplot3d import Axes3D

# 生成示例数据
x = np.linspace(0, 10, 10)
y = np.linspace(0, 10, 10)
z = np.sin(x) * np.cos(y)
zerr = 0.2 + 0.3 * np.random.rand(10)

# 创建3D图形和坐标轴
fig = plt.figure(figsize=(12, 9))
ax = fig.add_subplot(111, projection='3d')

# 绘制3D散点图
scatter = ax.scatter(x, y, z, c=z, cmap='viridis', s=100)

# 添加Z方向的误差线
for xi, yi, zi, zerri in zip(x, y, z, zerr):
    ax.plot([xi, xi], [yi, yi], [zi-zerri, zi+zerri], color='red', alpha=0.5)

# 设置图表标题和轴标签
ax.set_title('3D Errorbar Plot - how2matplotlib.com')
ax.set_xlabel('X-axis')
ax.set_ylabel('Y-axis')
ax.set_zlabel('Z-axis')

# 添加颜色条
plt.colorbar(scatter)

# 保存图形
plt.savefig('3d_errorbar_plot.png')

# 显示图形
plt.show()

print("图形已保存为 3d_errorbar_plot.png")
Output:
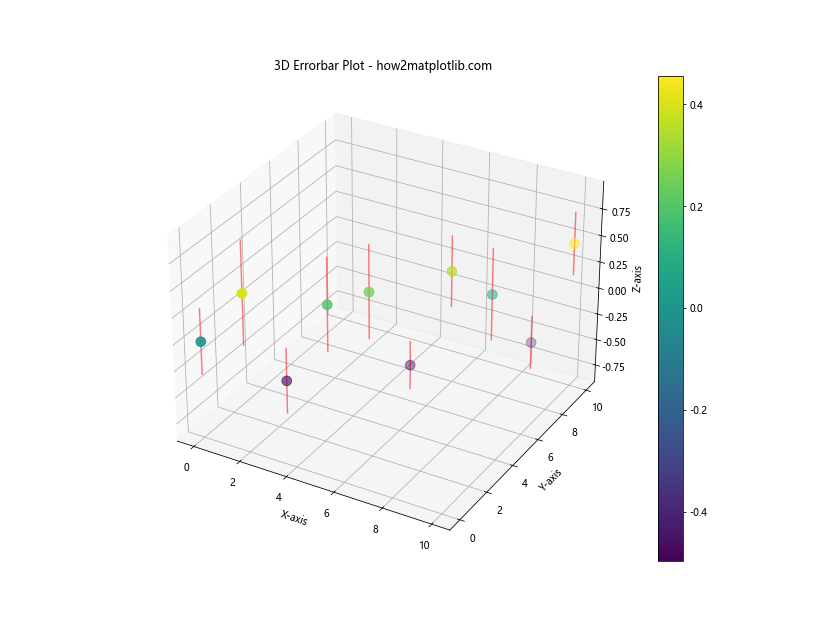
在这个3D示例中,我们使用scatter函数绘制了数据点,然后使用plot函数为每个数据点添加了Z方向的误差线。虽然这不是严格意义上的errorbar函数,但它实现了类似的效果,允许我们在3D空间中表示数据的不确定性。
11. 使用条形图表示误差
在某些情况下,使用条形图来表示误差可能更加直观。以下是一个使用条形图表示误差的示例:
import matplotlib.pyplot as plt
import numpy as np

# 生成示例数据
categories = ['A', 'B', 'C', 'D', 'E']
values = np.random.rand(5) * 10
errors = np.random.rand(5)

# 创建图形和坐标轴
fig, ax = plt.subplots(figsize=(12, 7))

# 绘制条形图
bars = ax.bar(categories, values, yerr=errors, capsize=5,
              error_kw={'ecolor': 'red', 'capthick': 2})

# 为每个条形设置不同的颜色
colors = plt.cm.viridis(np.linspace(0, 1, len(bars)))
for bar, color in zip(bars, colors):
    bar.set_color(color)

# 设置图表标题和轴标签
ax.set_title('Bar Plot with Error Bars - how2matplotlib.com')
ax.set_xlabel('Categories')
ax.set_ylabel('Values')

# 显示数值标签
for bar in bars:
    height = bar.get_height()
    ax.text(bar.get_x() + bar.get_width()/2., height,
            f'{height:.2f}', ha='center', va='bottom')

# 调整y轴范围
ax.set_ylim(0, max(values) + max(errors) + 1)

# 显示网格
ax.grid(True, axis='y', linestyle='--', alpha=0.7)

# 保存图形
plt.savefig('bar_plot_with_errors.png')

# 显示图形
plt.show()

print("图形已保存为 bar_plot_with_errors.png")
Output:
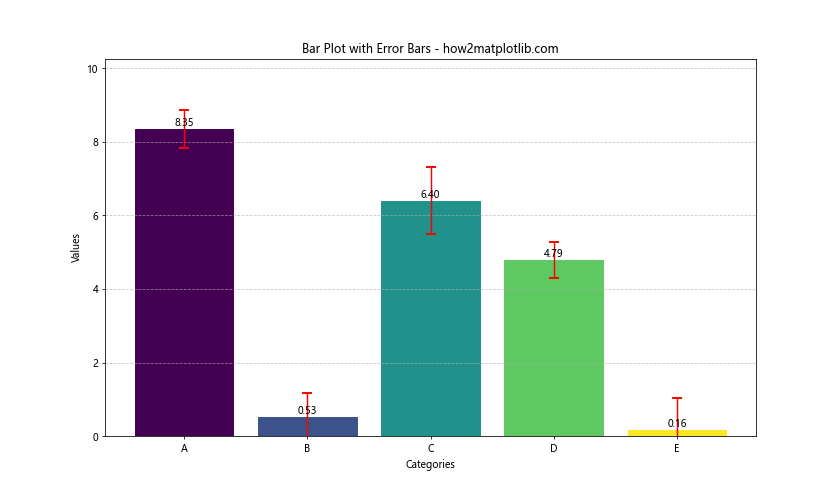
在这个示例中,我们使用bar函数创建了一个条形图,并使用yerr参数添加了误差线。我们还为每个条形设置了不同的颜色,并在条形顶部添加了数值标签。这种方法特别适合于展示分类数据的值和不确定性。
12. 使用箱线图表示误差分布
箱线图是另一种表示数据分布和误差的有效方法。它可以显示数据的中位数、四分位数范围和异常值。以下是一个使用箱线图表示误差分布的示例:
import matplotlib.pyplot as plt
import numpy as np

# 生成示例数据
np.random.seed(42)
data = [np.random.normal(0, std, 100) for std in range(1, 6)]

# 创建图形和坐标轴
fig, ax = plt.subplots(figsize=(12, 7))

# 绘制箱线图
bp = ax.boxplot(data, patch_artist=True)

# 自定义箱线图颜色
colors = plt.cm.Set3(np.linspace(0, 1, len(data)))
for patch, color in zip(bp['boxes'], colors):
    patch.set_facecolor(color)

# 设置图表标题和轴标签
ax.set_title('Box Plot to Represent Error Distribution - how2matplotlib.com')
ax.set_xlabel('Groups')
ax.set_ylabel('Values')

# 设置x轴刻度标签
ax.set_xticklabels([f'Group {i}' for i in range(1, 6)])

# 添加网格线
ax.yaxis.grid(True, linestyle='--', alpha=0.7)

# 保存图形
plt.savefig('box_plot_error_distribution.png')

# 显示图形
plt.show()

print("图形已保存为 box_plot_error_distribution.png")
Output:
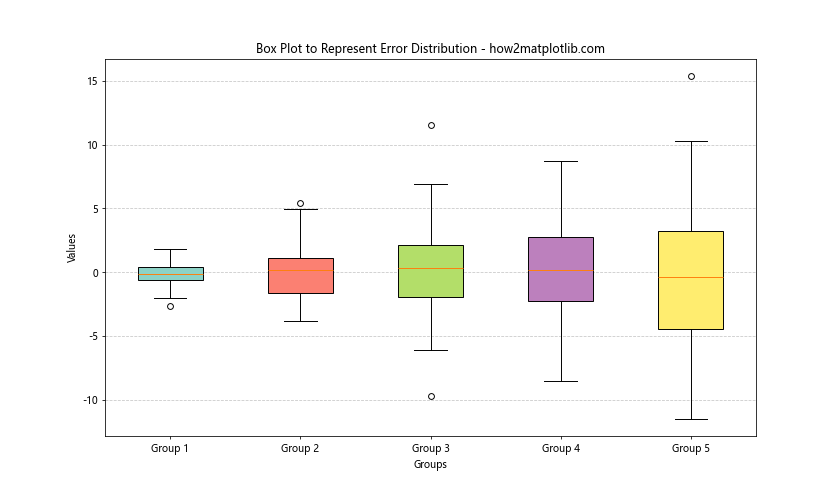
在这个示例中,我们使用boxplot函数创建了一个箱线图。每个箱子代表一组数据的分布,包括中位数(箱子中的线)、四分位数范围(箱子的上下边界)和异常值(箱子外的点)。这种方法可以很好地展示数据的整体分布和变异性。
13. 使用violin图表示误差分布
violin图是箱线图的一个变体,它不仅显示数据的摘要统计信息,还显示了数据的概率密度。这对于理解数据的分布特征特别有用。以下是一个使用violin图表示误差分布的示例:
import matplotlib.pyplot as plt
import numpy as np
import seaborn as sns

# 生成示例数据
np.random.seed(42)
data = [np.random.normal(0, std, 1000) for std in range(1, 6)]

# 创建图形和坐标轴
fig, ax = plt.subplots(figsize=(12, 7))

# 绘制violin图
parts = ax.violinplot(data, showmeans=False, showmedians=True)

# 自定义violin图颜色
colors = plt.cm.rainbow(np.linspace(0, 1, len(data)))
for pc, color in zip(parts['bodies'], colors):
    pc.set_facecolor(color)
    pc.set_edgecolor('black')
    pc.set_alpha(0.7)

# 设置图表标题和轴标签
ax.set_title('Violin Plot to Represent Error Distribution - how2matplotlib.com')
ax.set_xlabel('Groups')
ax.set_ylabel('Values')

# 设置x轴刻度标签
ax.set_xticks(np.arange(1, len(data) + 1))
ax.set_xticklabels([f'Group {i}' for i in range(1, 6)])

# 添加网格线
ax.yaxis.grid(True, linestyle='--', alpha=0.7)

# 保存图形
plt.savefig('violin_plot_error_distribution.png')

# 显示图形
plt.show()

print("图形已保存为 violin_plot_error_distribution.png")
Output:
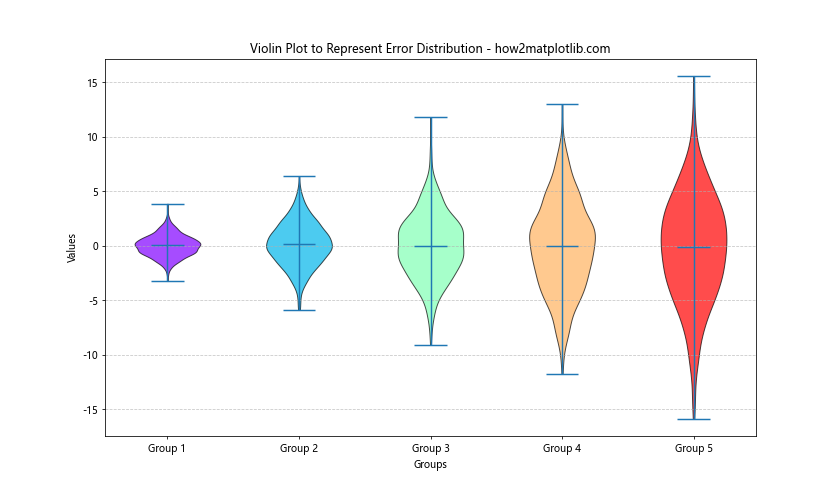
在这个示例中,我们使用violinplot函数创建了一个violin图。每个”小提琴”的形状代表数据的概率密度分布,宽度表示在某个值范围内数据点的相对频率。中间的白点表示中位数,粗黑线代表四分位数范围。这种可视化方法可以提供比箱线图更详细的分布信息。
14. 使用热图表示二维误差分布
当我们需要表示二维数据的误差分布时,热图可能是一个很好的选择。以下是一个使用热图表示二维误差分布的示例:
import matplotlib.pyplot as plt
import numpy as np
import seaborn as sns

# 生成示例数据
np.random.seed(42)
x = np.linspace(0, 10, 20)
y = np.linspace(0, 10, 20)
X, Y = np.meshgrid(x, y)
Z = np.sin(X) * np.cos(Y)
error = 0.1 * np.random.randn(20, 20)

# 创建图形和坐标轴
fig, ax = plt.subplots(figsize=(12, 10))

# 绘制热图
im = ax.imshow(error, cmap='coolwarm', extent=[0, 10, 0, 10], origin='lower', aspect='auto')

# 添加颜色条
cbar = plt.colorbar(im)
cbar.set_label('Error Magnitude')

# 设置图表标题和轴标签
ax.set_title('2D Error Distribution Heatmap - how2matplotlib.com')
ax.set_xlabel('X-axis')
ax.set_ylabel('Y-axis')

# 添加等高线
contours = ax.contour(X, Y, Z, colors='black', alpha=0.5)
ax.clabel(contours, inline=True, fontsize=8)

# 保存图形
plt.savefig('2d_error_heatmap.png')

# 显示图形
plt.show()

print("图形已保存为 2d_error_heatmap.png")
Output:
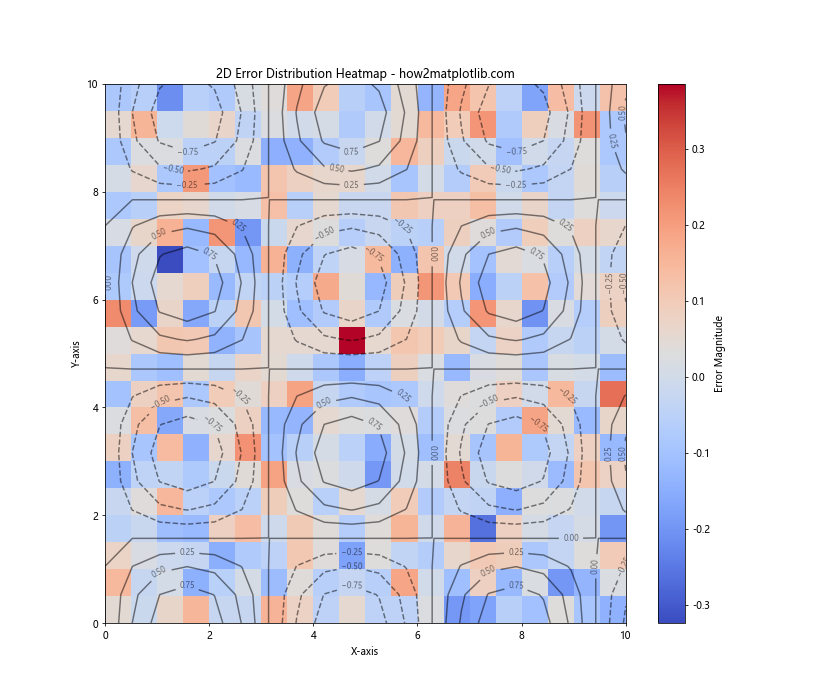
在这个示例中,我们使用imshow函数创建了一个热图来表示二维误差分布。颜色的强度表示误差的大小。我们还添加了等高线来显示原始数据的结构。这种方法可以有效地展示二维数据中误差的空间分布。
15. 使用动画展示误差变化
有时,我们可能需要展示误差随时间或其他参数的变化。在这种情况下,创建一个动画可能是一个很好的选择。以下是一个使用动画展示误差变化的示例:
import matplotlib.pyplot as plt
import numpy as np
from matplotlib.animation import FuncAnimation

# 生成初始数据
x = np.linspace(0, 10, 100)
y = np.sin(x)
yerr = np.random.rand(100) * 0.2

# 创建图形和坐标轴
fig, ax = plt.subplots(figsize=(12, 7))
line, = ax.plot(x, y, 'b-', label='Data')
errorbar = ax.errorbar(x, y, yerr=yerr, fmt='none', ecolor='r', alpha=0.5)

# 设置图表标题和轴标签
ax.set_title('Animated Errorbar Plot - how2matplotlib.com')
ax.set_xlabel('X-axis')
ax.set_ylabel('Y-axis')
ax.legend()

# 定义动画更新函数
def update(frame):
    global yerr
    y = np.sin(x + frame / 10)
    yerr = np.random.rand(100) * 0.2
    line.set_ydata(y)
    errorbar.remove()
    errorbar = ax.errorbar(x, y, yerr=yerr, fmt='none', ecolor='r', alpha=0.5)
    ax.set_title(f'Animated Errorbar Plot - Frame {frame} - how2matplotlib.com')
    return line, errorbar

# 创建动画
anim = FuncAnimation(fig, update, frames=100, interval=100, blit=False)

# 保存动画
anim.save('animated_errorbar.gif', writer='pillow')

print("动画已保存为 animated_errorbar.gif")
在这个示例中,我们使用FuncAnimation创建了一个动画。update函数在每一帧更新数据和误差线。这种动画可以很好地展示数据和误差随时间的变化趋势。
16. 使用误差椭圆表示二维误差
对于二维数据,我们可以使用误差椭圆来表示两个变量的联合不确定性。以下是一个使用误差椭圆的示例:
import matplotlib.pyplot as plt
import numpy as np
from matplotlib.patches import Ellipse

# 生成示例数据
np.random.seed(42)
x = np.random.randn(100)
y = 2 * x + np.random.randn(100) * 0.5

# 计算均值和协方差
mean_x, mean_y = np.mean(x), np.mean(y)
cov = np.cov(x, y)

# 计算特征值和特征向量
eigenvals, eigenvecs = np.linalg.eig(cov)

# 创建图形和坐标轴
fig, ax = plt.subplots(figsize=(12, 9))

# 绘制散点图
ax.scatter(x, y, alpha=0.5)

# 创建误差椭圆
angle = np.degrees(np.arctan2(*eigenvecs[:, 0][::-1]))
width, height = 2 * np.sqrt(eigenvals)
ellipse = Ellipse(xy=(mean_x, mean_y), width=width, height=height,
                  angle=angle, facecolor='none', edgecolor='red')

# 添加误差椭圆到图表
ax.add_artist(ellipse)

# 设置图表标题和轴标签
ax.set_title('Error Ellipse for 2D Data - how2matplotlib.com')
ax.set_xlabel('X-axis')
ax.set_ylabel('Y-axis')

# 调整坐标轴范围
ax.set_xlim(min(x) - 1, max(x) + 1)
ax.set_ylim(min(y) - 1, max(y) + 1)

# 添加网格
ax.grid(True, linestyle='--', alpha=0.7)

# 保存图形
plt.savefig('error_ellipse_2d.png')

# 显示图形
plt.show()

print("图形已保存为 error_ellipse_2d.png")
Output:
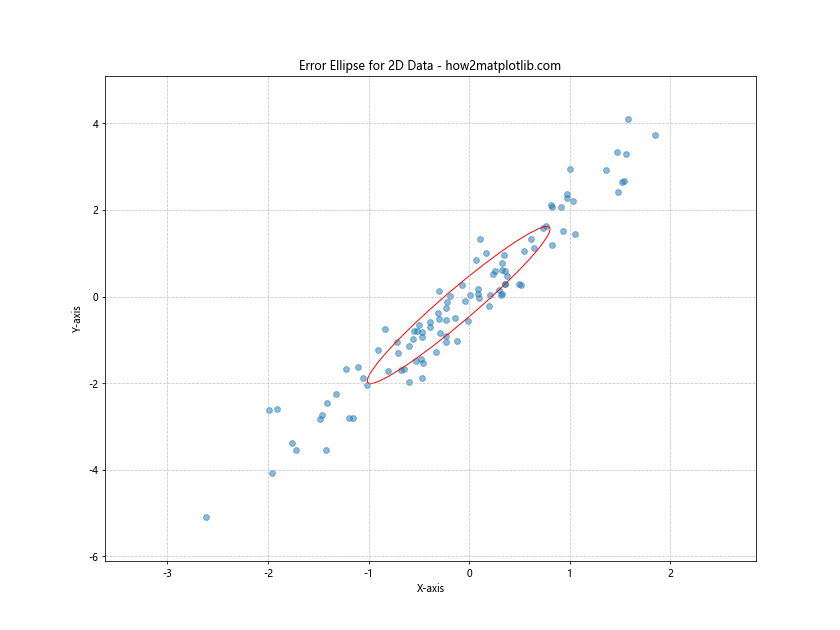
在这个示例中,我们首先计算了数据的均值和协方差矩阵。然后,我们使用特征值和特征向量来确定误差椭圆的大小和方向。误差椭圆提供了数据分布的视觉摘要,包括两个变量之间的相关性。
17. 使用误差带表示时间序列数据的不确定性
对于时间序列数据,我们可以使用误差带(error band)来表示数据的不确定性范围。以下是一个使用误差带的示例:
import matplotlib.pyplot as plt
import numpy as np
from scipy import stats

# 生成示例数据
np.random.seed(42)
x = np.linspace(0, 10, 100)
y = np.sin(x) + 0.1 * np.random.randn(100)

# 计算置信区间
def confidence_interval(x, y, confidence=0.95):
    n = len(x)
    m, b, r_value, p_value, std_err = stats.linregress(x, y)
    y_pred = m * x + b
    std_error = np.sqrt(np.sum((y - y_pred)**2) / (n-2))
    t = stats.t.ppf((1 + confidence) / 2, n - 2)
    ci = t * std_error * np.sqrt(1/n + (x - np.mean(x))**2 / np.sum((x - np.mean(x))**2))
    return y_pred, ci

# 计算预测值和置信区间
y_pred, ci = confidence_interval(x, y)

# 创建图形和坐标轴
fig, ax = plt.subplots(figsize=(12, 7))

# 绘制散点图和拟合线
ax.scatter(x, y, alpha=0.5, label='Data')
ax.plot(x, y_pred, 'r-', label='Fit')

# 添加误差带
ax.fill_between(x, y_pred - ci, y_pred + ci, color='gray', alpha=0.2, label='95% CI')

# 设置图表标题和轴标签
ax.set_title('Time Series with Error Band - how2matplotlib.com')
ax.set_xlabel('Time')
ax.set_ylabel('Value')

# 添加图例
ax.legend()

# 显示网格
ax.grid(True, linestyle='--', alpha=0.7)

# 保存图形
plt.savefig('time_series_error_band.png')

# 显示图形
plt.show()

print("图形已保存为 time_series_error_band.png")
Output:
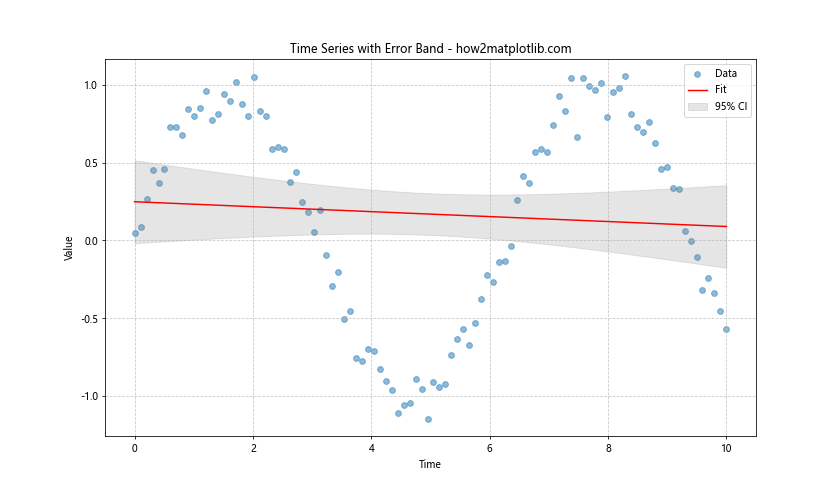
在这个示例中,我们首先生成了一些带有噪声的时间序列数据。然后,我们使用线性回归计算了预测值和95%置信区间。最后,我们使用fill_between函数创建了一个误差带,显示了预测值的不确定性范围。这种方法特别适合于展示时间序列数据的趋势和变异性。
18. 使用误差棒图比较多组数据
当我们需要比较多组数据及其误差时,误差棒图是一个很好的选择。以下是一个使用误差棒图比较多组数据的示例:
import matplotlib.pyplot as plt
import numpy as np

# 生成示例数据
np.random.seed(42)
groups = ['A', 'B', 'C', 'D', 'E']
means = np.random.rand(5) * 10
errors = np.random.rand(5)

# 创建图形和坐标轴
fig, ax = plt.subplots(figsize=(12, 7))

# 绘制误差棒图
ax.bar(groups, means, yerr=errors, capsize=5, alpha=0.7, color='skyblue', ecolor='black')

# 设置图表标题和轴标签
ax.set_title('Comparison of Multiple Groups with Error Bars - how2matplotlib.com')
ax.set_xlabel('Groups')
ax.set_ylabel('Values')

# 添加数值标签
for i, v in enumerate(means):
    ax.text(i, v + errors[i], f'{v:.2f}±{errors[i]:.2f}', ha='center', va='bottom')

# 调整y轴范围
ax.set_ylim(0, max(means + errors) * 1.2)

# 显示网格
ax.grid(True, axis='y', linestyle='--', alpha=0.7)

# 保存图形
plt.savefig('multi_group_error_bars.png')

# 显示图形
plt.show()

print("图形已保存为 multi_group_error_bars.png")
Output:
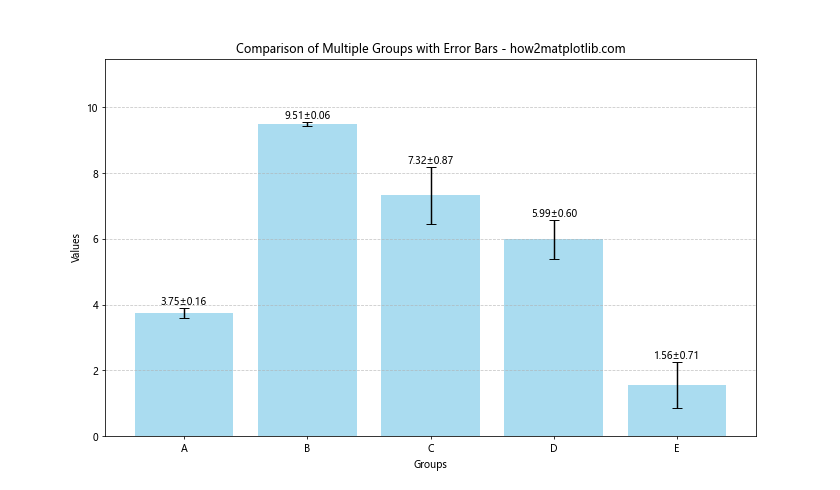
在这个示例中,我们使用bar函数创建了一个条形图,并使用yerr参数添加了误差线。我们还在每个条形上方添加了数值标签,显示了均值和误差。这种图表形式非常适合于比较不同组或类别的数据及其不确定性。
19. 使用误差阴影区域表示连续数据的不确定性
对于连续数据,我们可以使用阴影区域来表示数据的不确定性范围。这种方法特别适用于展示模型预测的置信区间。以下是一个使用误差阴影区域的示例:
import matplotlib.pyplot as plt
import numpy as np
from scipy import stats

# 生成示例数据
np.random.seed(42)
x = np.linspace(0, 10, 100)
y = 2 * x + 1 + np.random.normal(0, 2, 100)

# 进行线性回归
slope, intercept, r_value, p_value, std_err = stats.linregress(x, y)
line = slope * x + intercept

# 计算预测区间
def prediction_interval(x, y, new_x, confidence=0.95):
    n = len(x)
    mean_x = np.mean(x)
    std_err = np.sqrt(np.sum((y - (slope * x + intercept))**2) / (n-2))
    t = stats.t.ppf((1 + confidence) / 2, n - 2)
    se = std_err * np.sqrt(1 + 1/n + (new_x - mean_x)**2 / np.sum((x - mean_x)**2))
    return t * se

# 计算预测区间
pi = prediction_interval(x, y, x)

# 创建图形和坐标轴
fig, ax = plt.subplots(figsize=(12, 7))

# 绘制散点图和回归线
ax.scatter(x, y, alpha=0.5, label='Data')
ax.plot(x, line, 'r-', label='Regression Line')

# 添加预测区间
ax.fill_between(x, line - pi, line + pi, color='gray', alpha=0.2, label='95% Prediction Interval')

# 设置图表标题和轴标签
ax.set_title('Linear Regression with Prediction Interval - how2matplotlib.com')
ax.set_xlabel('X-axis')
ax.set_ylabel('Y-axis')

# 添加图例
ax.legend()

# 显示网格
ax.grid(True, linestyle='--', alpha=0.7)

# 保存图形
plt.savefig('regression_prediction_interval.png')

# 显示图形
plt.show()

print("图形已保存为 regression_prediction_interval.png")
Output:
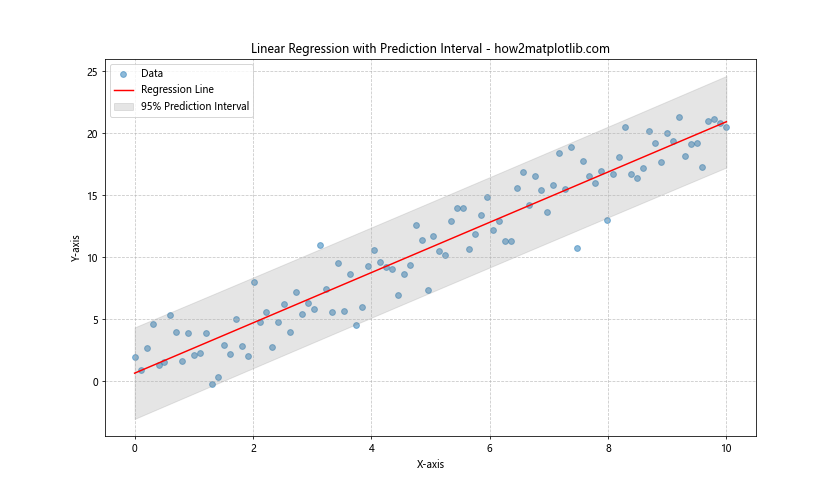
在这个示例中,我们首先生成了一些带有噪声的线性数据。然后,我们使用scipy.stats.linregress进行线性回归,并计算了95%的预测区间。最后,我们使用fill_between函数创建了一个阴影区域来表示预测区间。这种可视化方法可以清晰地展示模型预测的不确定性范围。
20. 使用误差条形图比较不同模型的性能
当我们需要比较不同模型或方法的性能时,误差条形图是一个很好的选择。以下是一个使用误差条形图比较不同模型性能的示例:
import matplotlib.pyplot as plt
import numpy as np

# 生成示例数据
np.random.seed(42)
models = ['Model A', 'Model B', 'Model C', 'Model D']
accuracies = np.random.uniform(0.7, 0.9, 4)
errors = np.random.uniform(0.02, 0.05, 4)

# 创建图形和坐标轴
fig, ax = plt.subplots(figsize=(12, 7))

# 绘制误差条形图
ax.bar(models, accuracies, yerr=errors, capsize=5, alpha=0.7, color='lightgreen', ecolor='darkgreen')

# 设置图表标题和轴标签
ax.set_title('Comparison of Model Performances - how2matplotlib.com')
ax.set_xlabel('Models')
ax.set_ylabel('Accuracy')

# 添加数值标签
for i, v in enumerate(accuracies):
    ax.text(i, v + errors[i], f'{v:.2f}±{errors[i]:.2f}', ha='center', va='bottom')

# 调整y轴范围
ax.set_ylim(0, 1)

# 显示网格
ax.grid(True, axis='y', linestyle='--', alpha=0.7)

# 保存图形
plt.savefig('model_performance_comparison.png')

# 显示图形
plt.show()

print("图形已保存为 model_performance_comparison.png")
Output:
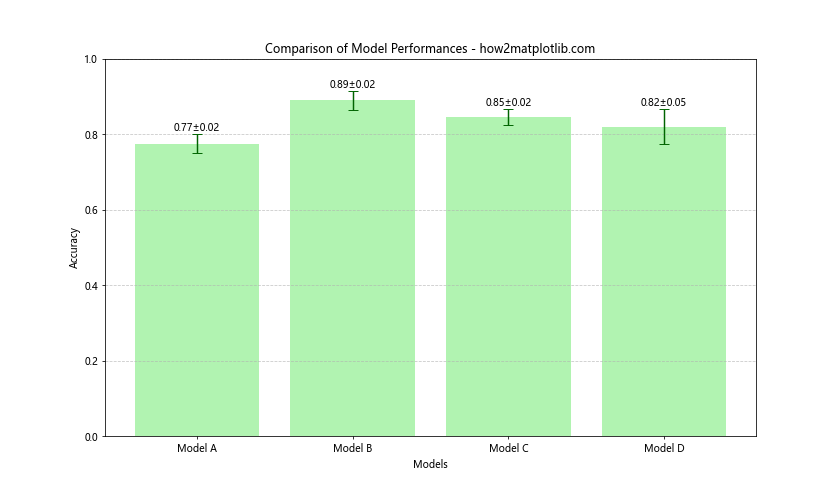
在这个示例中,我们使用bar函数创建了一个条形图,并使用yerr参数添加了误差线。每个条形代表一个模型的准确率,误差线表示准确率的不确定性范围。我们还在每个条形上方添加了数值标签,显示了准确率和误差。这种图表形式非常适合于比较不同模型的性能及其可靠性。
总结
在本文中,我们深入探讨了Matplotlib中errorbar函数的使用,以及与之相关的各种误差可视化技术。我们从基本的errorbar图开始,逐步介绍了如何自定义误差线和标记的样式,如何处理不同类型的误差(如对称和非对称误差),以及如何在2D和3D空间中表示误差。
我们还探讨了其他相关的误差可视化方法,包括:
- 使用填充区域表示误差范围
- 组合多种样式的errorbar图
- 使用自定义标记
- 在3D空间中表示误差
- 使用条形图和箱线图表示误差
- 使用violin图表示误差分布
- 使用热图表示二维误差分布
- 创建动画来展示误差变化
- 使用误差椭圆表示二维误差
- 使用误差带表示时间序列数据的不确定性
- 使用误差棒图比较多组数据
- 使用误差阴影区域表示连续数据的不确定性
- 使用误差条形图比较不同模型的性能
这些技术为数据科学家和研究人员提供了丰富的工具,可以根据具体的数据类型和分析需求选择最合适的可视化方法。
在实际应用中,选择合适的误差可视化方法取决于多个因素,包括:
- 数据的类型(离散或连续)
- 误差的性质(对称或非对称)
- 需要比较的组或类别的数量
- 数据的维度(1D、2D或3D)
- 需要展示的信息(如分布、趋势、相关性等)
通过恰当地使用这些可视化技术,我们可以更有效地传达数据的不确定性和变异性,帮助读者更好地理解数据的特征和局限性。
在使用这些技术时,需要注意以下几点:
- 保持图表简洁清晰,避免过度复杂化
- 选择合适的颜色和样式,确保图表易于理解
- 提供清晰的标题、轴标签和图例
- 考虑数据的尺度和范围,适当调整坐标轴
- 在必要时添加注释或说明,帮助读者理解图表
最后,熟练掌握这些误差可视化技术需要大量的实践和经验。建议读者根据自己的具体需求,尝试不同的方法,并根据反馈不断改进。同时,也要注意关注Matplotlib的最新更新和社区资源,以了解新的功能和最佳实践。
通过合理使用这些误差可视化技术,我们可以更好地展示数据的不确定性,提高数据分析的可信度和说服力,从而做出更加明智的决策和结论。
 极客教程
极客教程