Matplotlib Contour: 绘制等高线图的强大工具
Matplotlib是Python中最流行的数据可视化库之一,而contour(等高线)绘图是其中一个强大而versatile的功能。等高线图在地形图、天气图、热力图等多个领域都有广泛应用。本文将深入探讨Matplotlib中的contour功能,从基础用法到高级技巧,帮助你掌握这一强大的可视化工具。
1. 什么是等高线图?
等高线图是一种二维图形,用于表示三维表面的二维投影。它通过一系列连接相同值点的曲线来展示数据的分布情况。在地形图中,等高线连接海拔相同的点;在天气图中,等高线可能连接气压相同的点。
2. Matplotlib中的contour基础
2.1 创建基本的等高线图
让我们从一个简单的例子开始,创建一个基本的等高线图:
import numpy as np
import matplotlib.pyplot as plt

# 创建数据
x = np.linspace(-5, 5, 100)
y = np.linspace(-5, 5, 100)
X, Y = np.meshgrid(x, y)
Z = np.sin(np.sqrt(X**2 + Y**2))

# 绘制等高线图
plt.figure(figsize=(10, 8))
contour = plt.contour(X, Y, Z)
plt.colorbar(contour)
plt.title('Basic Contour Plot - how2matplotlib.com')
plt.xlabel('X')
plt.ylabel('Y')
plt.show()
Output:
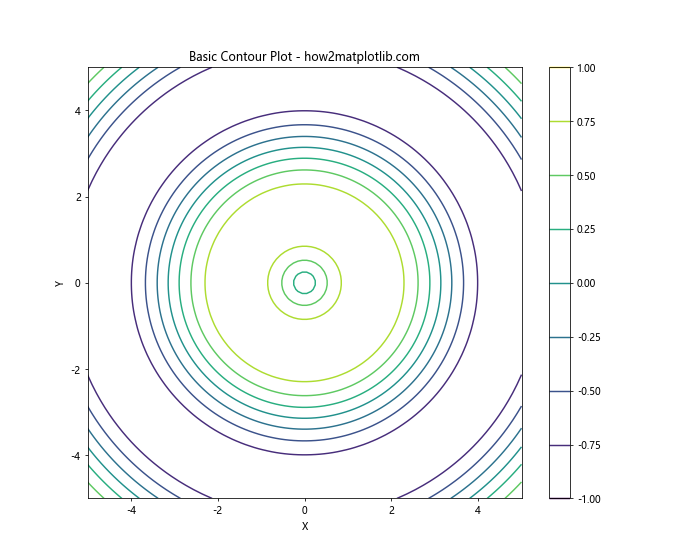
在这个例子中,我们首先创建了一个网格数据,然后使用plt.contour()函数绘制等高线。colorbar用于显示颜色刻度。
2.2 填充等高线
除了线条,我们还可以填充等高线之间的区域:
import numpy as np
import matplotlib.pyplot as plt

x = np.linspace(-5, 5, 100)
y = np.linspace(-5, 5, 100)
X, Y = np.meshgrid(x, y)
Z = np.sin(np.sqrt(X**2 + Y**2))

plt.figure(figsize=(10, 8))
contourf = plt.contourf(X, Y, Z, cmap='viridis')
plt.colorbar(contourf)
plt.title('Filled Contour Plot - how2matplotlib.com')
plt.xlabel('X')
plt.ylabel('Y')
plt.show()
Output:
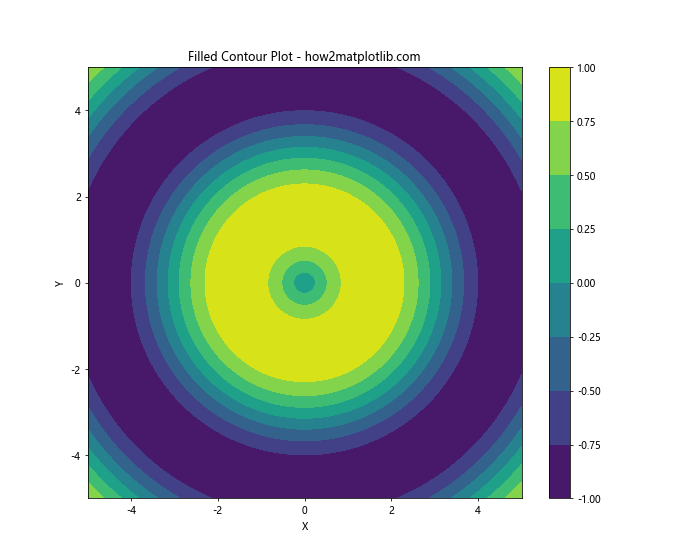
这里我们使用plt.contourf()函数来创建填充的等高线图。cmap参数用于指定颜色映射。
3. 自定义等高线
3.1 指定等高线级别
我们可以通过指定levels参数来控制等高线的数量和位置:
import numpy as np
import matplotlib.pyplot as plt

x = np.linspace(-5, 5, 100)
y = np.linspace(-5, 5, 100)
X, Y = np.meshgrid(x, y)
Z = np.sin(np.sqrt(X**2 + Y**2))

plt.figure(figsize=(10, 8))
levels = [-0.5, 0, 0.5]
contour = plt.contour(X, Y, Z, levels=levels)
plt.colorbar(contour)
plt.title('Custom Contour Levels - how2matplotlib.com')
plt.xlabel('X')
plt.ylabel('Y')
plt.show()
Output:
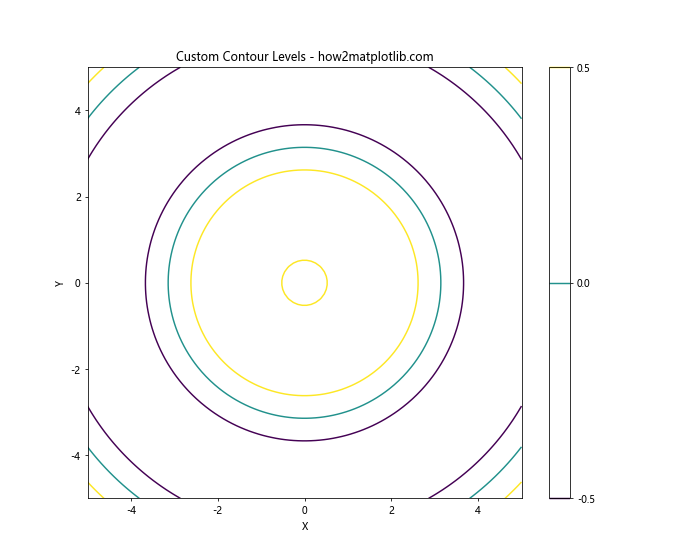
在这个例子中,我们只绘制了-0.5、0和0.5这三个等高线。
3.2 自定义等高线颜色
我们可以为每个等高线指定不同的颜色:
import numpy as np
import matplotlib.pyplot as plt

x = np.linspace(-5, 5, 100)
y = np.linspace(-5, 5, 100)
X, Y = np.meshgrid(x, y)
Z = np.sin(np.sqrt(X**2 + Y**2))

plt.figure(figsize=(10, 8))
levels = [-0.5, 0, 0.5]
colors = ['blue', 'green', 'red']
contour = plt.contour(X, Y, Z, levels=levels, colors=colors)
plt.colorbar(contour)
plt.title('Custom Contour Colors - how2matplotlib.com')
plt.xlabel('X')
plt.ylabel('Y')
plt.show()
Output:
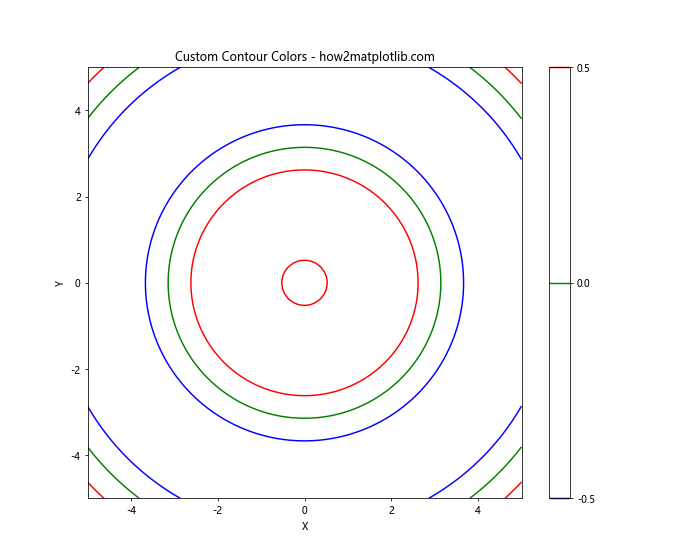
这里我们为每个等高线指定了不同的颜色。
4. 等高线标签
4.1 添加等高线标签
我们可以使用plt.clabel()函数为等高线添加标签:
import numpy as np
import matplotlib.pyplot as plt

x = np.linspace(-5, 5, 100)
y = np.linspace(-5, 5, 100)
X, Y = np.meshgrid(x, y)
Z = np.sin(np.sqrt(X**2 + Y**2))

plt.figure(figsize=(10, 8))
contour = plt.contour(X, Y, Z)
plt.clabel(contour, inline=True, fontsize=8)
plt.title('Contour Plot with Labels - how2matplotlib.com')
plt.xlabel('X')
plt.ylabel('Y')
plt.show()
Output:
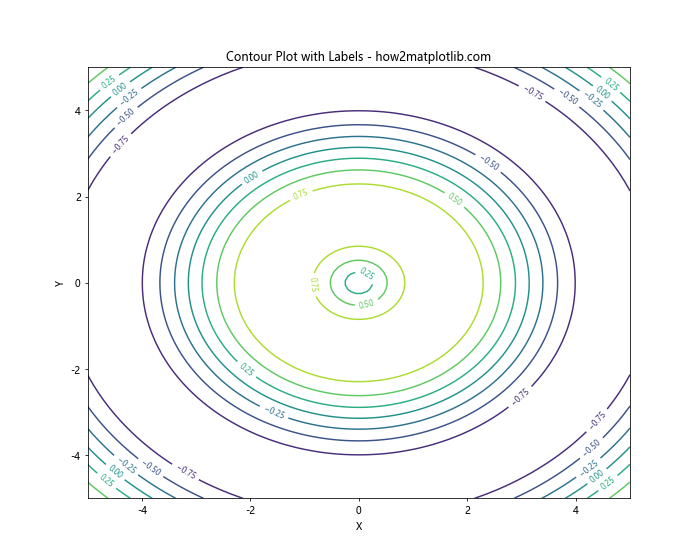
inline=True参数确保标签不会与等高线重叠。
4.2 自定义标签格式
我们可以自定义标签的格式:
import numpy as np
import matplotlib.pyplot as plt

x = np.linspace(-5, 5, 100)
y = np.linspace(-5, 5, 100)
X, Y = np.meshgrid(x, y)
Z = np.sin(np.sqrt(X**2 + Y**2))

plt.figure(figsize=(10, 8))
contour = plt.contour(X, Y, Z)
plt.clabel(contour, inline=True, fmt='%1.2f', fontsize=8)
plt.title('Contour Plot with Custom Labels - how2matplotlib.com')
plt.xlabel('X')
plt.ylabel('Y')
plt.show()
Output:
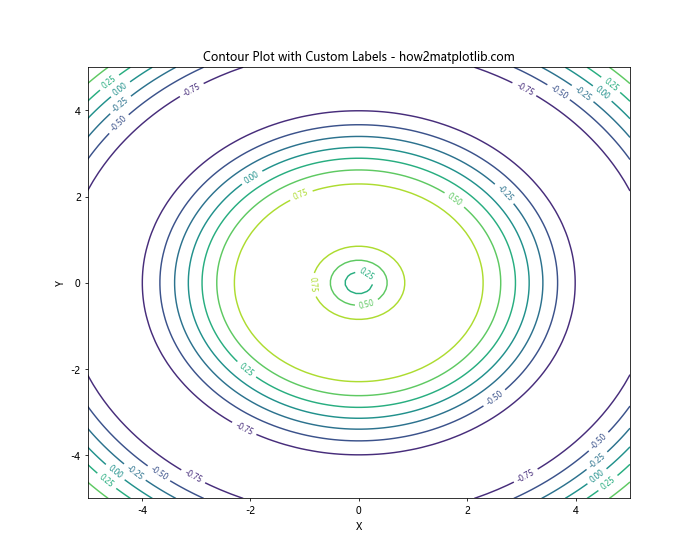
这里我们使用fmt参数来指定标签的格式,’%1.2f’表示保留两位小数。
5. 组合等高线图和其他图形
5.1 等高线图和散点图
我们可以将等高线图与其他类型的图形结合,例如散点图:
import numpy as np
import matplotlib.pyplot as plt

x = np.linspace(-5, 5, 100)
y = np.linspace(-5, 5, 100)
X, Y = np.meshgrid(x, y)
Z = np.sin(np.sqrt(X**2 + Y**2))

plt.figure(figsize=(10, 8))
contour = plt.contour(X, Y, Z)
plt.scatter([-2, 0, 2], [-2, 0, 2], color='red', s=50)
plt.colorbar(contour)
plt.title('Contour Plot with Scatter Points - how2matplotlib.com')
plt.xlabel('X')
plt.ylabel('Y')
plt.show()
Output:
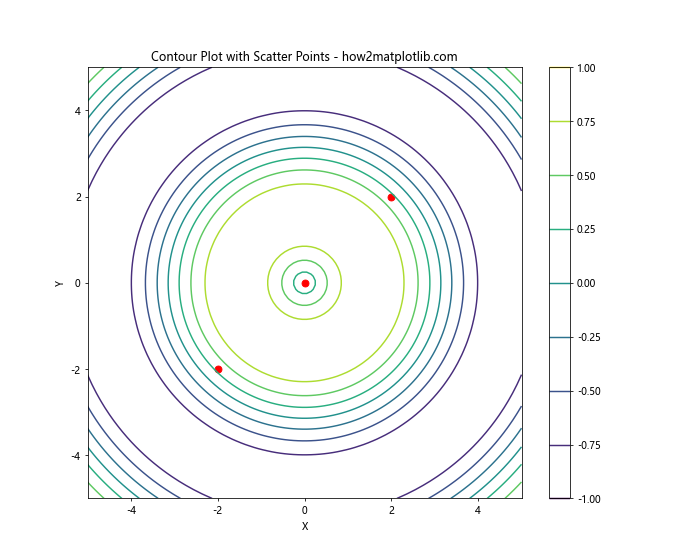
这个例子展示了如何在等高线图上添加散点。
5.2 等高线图和向量场
我们还可以将等高线图与向量场结合:
import numpy as np
import matplotlib.pyplot as plt

x = np.linspace(-5, 5, 20)
y = np.linspace(-5, 5, 20)
X, Y = np.meshgrid(x, y)
Z = np.sin(np.sqrt(X**2 + Y**2))
U = -Y / (X**2 + Y**2)
V = X / (X**2 + Y**2)

plt.figure(figsize=(10, 8))
plt.contour(X, Y, Z)
plt.quiver(X, Y, U, V)
plt.title('Contour Plot with Vector Field - how2matplotlib.com')
plt.xlabel('X')
plt.ylabel('Y')
plt.show()
Output:
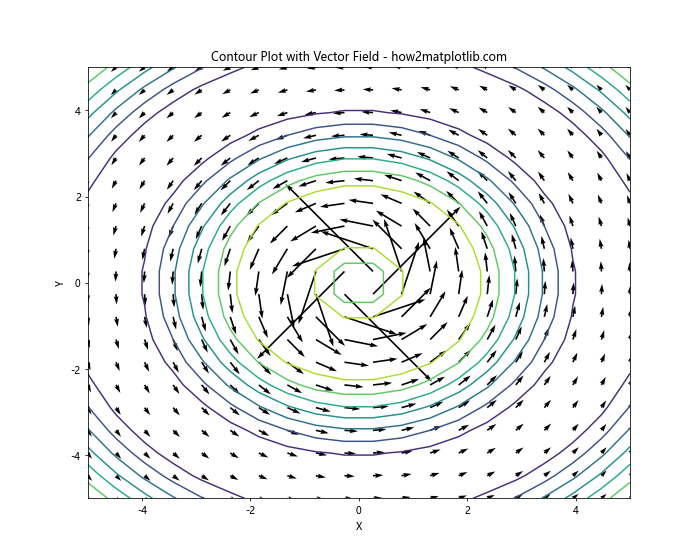
这个例子展示了如何在等高线图上添加向量场。
6. 3D等高线图
6.1 基本的3D等高线图
Matplotlib还支持3D等高线图:
import numpy as np
import matplotlib.pyplot as plt
from mpl_toolkits.mplot3d import Axes3D

x = np.linspace(-5, 5, 100)
y = np.linspace(-5, 5, 100)
X, Y = np.meshgrid(x, y)
Z = np.sin(np.sqrt(X**2 + Y**2))

fig = plt.figure(figsize=(10, 8))
ax = fig.add_subplot(111, projection='3d')
contour = ax.contour(X, Y, Z)
ax.set_title('3D Contour Plot - how2matplotlib.com')
ax.set_xlabel('X')
ax.set_ylabel('Y')
ax.set_zlabel('Z')
plt.show()
Output:
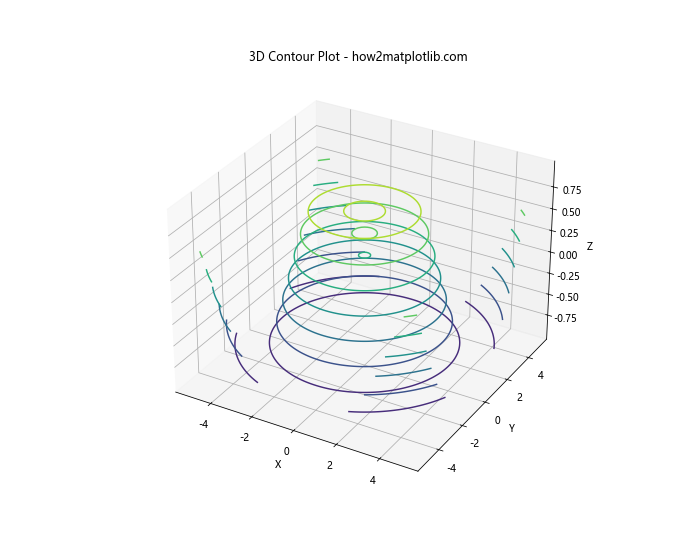
这个例子展示了如何创建基本的3D等高线图。
6.2 3D等高线图与表面
我们可以将3D等高线图与表面结合:
import numpy as np
import matplotlib.pyplot as plt
from mpl_toolkits.mplot3d import Axes3D

x = np.linspace(-5, 5, 100)
y = np.linspace(-5, 5, 100)
X, Y = np.meshgrid(x, y)
Z = np.sin(np.sqrt(X**2 + Y**2))

fig = plt.figure(figsize=(10, 8))
ax = fig.add_subplot(111, projection='3d')
surface = ax.plot_surface(X, Y, Z, alpha=0.5)
contour = ax.contour(X, Y, Z, zdir='z', offset=-1)
ax.set_title('3D Surface with Contour - how2matplotlib.com')
ax.set_xlabel('X')
ax.set_ylabel('Y')
ax.set_zlabel('Z')
plt.show()
Output:
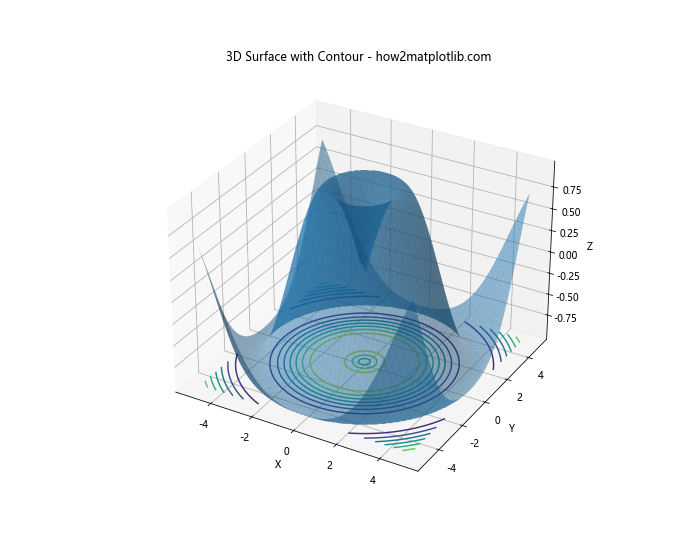
这个例子展示了如何在3D表面下方添加等高线投影。
7. 高级技巧
7.1 非均匀网格
有时我们的数据可能不在均匀网格上,这时我们可以使用tricontour:
import numpy as np
import matplotlib.pyplot as plt

np.random.seed(19680801)
npts = 200
ngridx = 100
ngridy = 200
x = np.random.uniform(-2, 2, npts)
y = np.random.uniform(-2, 2, npts)
z = x * np.exp(-x**2 - y**2)

plt.figure(figsize=(10, 8))
plt.tricontour(x, y, z, levels=14, linewidths=0.5, colors='k')
plt.tricontourf(x, y, z, levels=14, cmap="RdBu_r")
plt.colorbar()
plt.title('Non-Uniform Grid Contour - how2matplotlib.com')
plt.xlabel('X')
plt.ylabel('Y')
plt.show()
Output:
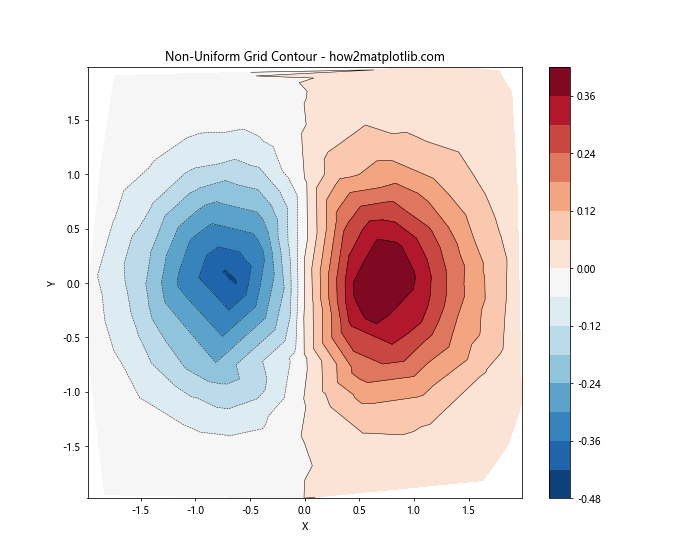
这个例子展示了如何在非均匀网格上创建等高线图。
7.2 等高线图动画
我们还可以创建等高线图的动画:
import numpy as np
import matplotlib.pyplot as plt
from matplotlib.animation import FuncAnimation

x = np.linspace(-5, 5, 100)
y = np.linspace(-5, 5, 100)
X, Y = np.meshgrid(x, y)

fig, ax = plt.subplots(figsize=(10, 8))

def animate(i):
    ax.clear()
    Z = np.sin(np.sqrt(X**2 + Y**2) - i * 0.1)
    contour = ax.contourf(X, Y, Z, cmap='viridis')
    ax.set_title(f'Frame {i} - how2matplotlib.com')
    return contour

anim = FuncAnimation(fig, animate, frames=100, interval=50)
plt.show()
Output:
这个例子展示了如何创建一个简单的等高线图动画。
8. 实际应用案例
8.1 地形图
等高线图常用于表示地形:
import numpy as np
import matplotlib.pyplot as plt

def terrain(x, y):
    return np.sin(5*x) * np.cos(5*y) / 5

x = np.linspace(-1, 1, 100)
y = np.linspace(-1, 1, 100)
X, Y = np.meshgrid(x, y)
Z = terrain(X, Y)

plt.figure(figsize=(10, 8))
contour = plt.contour(X, Y, Z, levels=20, cmap='terrain')
plt.clabel(contour, inline=True, fontsize=8)
plt.title('Terrain Map - how2matplotlib.com')
plt.xlabel('X')
plt.ylabel('Y')
plt.colorbar(contour)
plt.show()
Output:
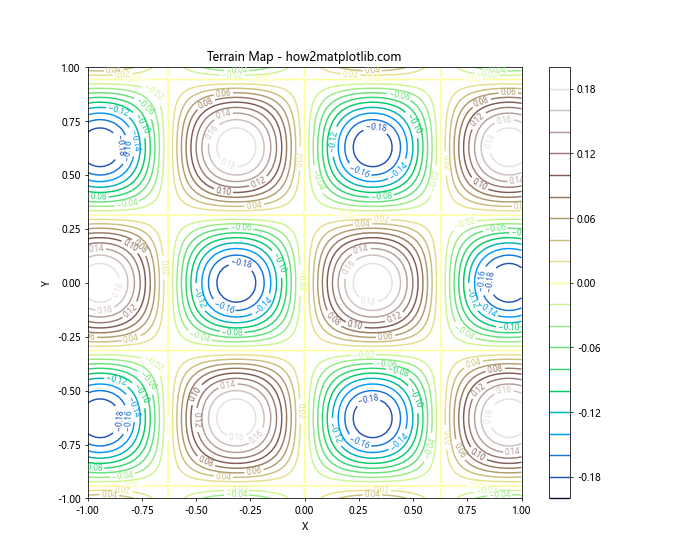
这个例子模拟了一个简单的地形图。
8.2 天气图
等高线图也常用于气象学:
import numpy as np
import matplotlib.pyplot as plt

def pressure(x, y):
    return 1000 + 5 * np.sin(5*x) * np.cos(5*y)

x = np.linspace(-1, 1, 100)
y = np.linspace(-1, 1, 100)
X, Y = np.meshgrid(x, y)
Z = pressure(X, Y)

plt.figure(figsize=(10, 8))
contour = plt.contour(X, Y, Z, levels=20, colors='k')
plt.clabel(contour, inline=True, fontsize=8, fmt='%1.0f')
plt.title('Weather Map (Pressure) - how2matplotlib.com')
plt.xlabel('Longitude')
plt.ylabel('Latitude')
plt.show()
Output:
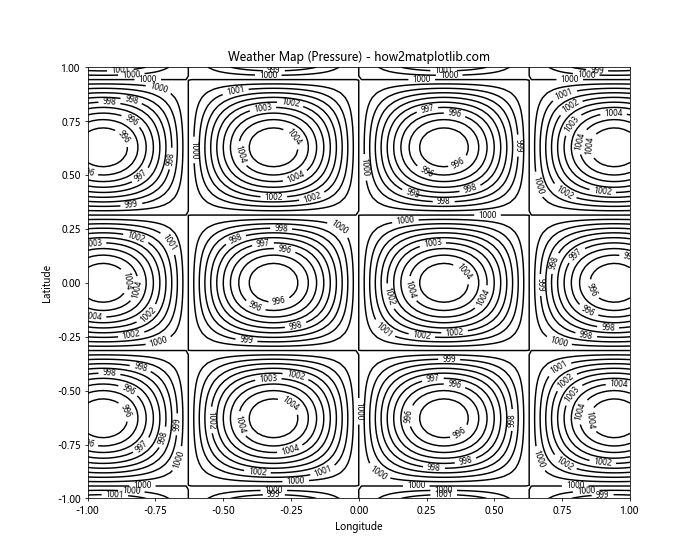
这个例子模拟了一个简单的气压图。
9. 性能优化
在处理大型数据集时,等高线图的绘制可能会变得很慢。以下是一些优化技巧:
9.1 减少数据点
如果可能的话,减少数据点的数量可以显著提高性能:
“`python“`python
import numpy as np
import matplotlib.pyplot as plt
x = np.linspace(-5, 5, 50) # 减少到50×50的网格
y = np.linspace(-5, 5, 50)
X, Y = np.meshgrid(x, y)
Z = np.sin(np.sqrt(X2 + Y2))
plt.figure(figsize=(10, 8))
contour = plt.contour(X, Y, Z)
plt.colorbar(contour)
plt.title(‘Optimized Contour Plot – how2matplotlib.com’)
plt.xlabel(‘X’)
plt.ylabel(‘Y’)
plt.show()
Output:

这个例子使用了较少的数据点,但仍能保持图形的整体形状。
### 9.2 使用适当的等高线级别
选择适当数量的等高线级别可以在保持图形信息的同时提高性能:
```python
import numpy as np
import matplotlib.pyplot as plt
x = np.linspace(-5, 5, 100)
y = np.linspace(-5, 5, 100)
X, Y = np.meshgrid(x, y)
Z = np.sin(np.sqrt(X**2 + Y**2))
plt.figure(figsize=(10, 8))
contour = plt.contour(X, Y, Z, levels=10) # 使用10个等高线级别
plt.colorbar(contour)
plt.title('Contour Plot with Optimized Levels - how2matplotlib.com')
plt.xlabel('X')
plt.ylabel('Y')
plt.show()
Output:
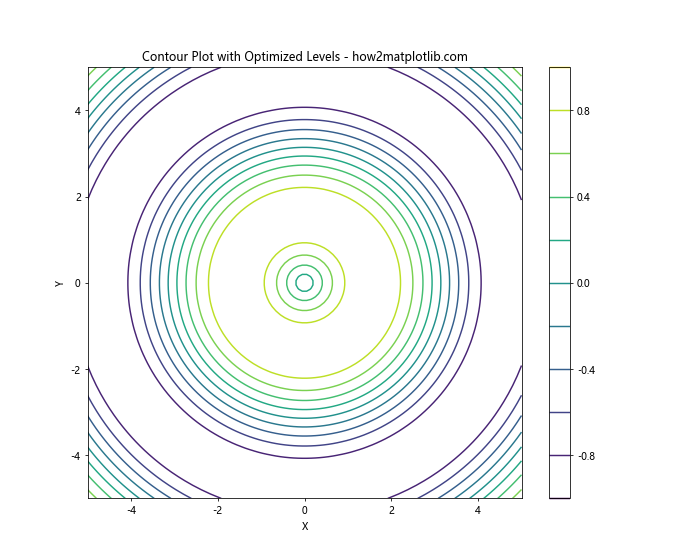
这个例子使用了较少的等高线级别,可以加快绘图速度。
10. 常见问题和解决方案
10.1 等高线不平滑
有时等高线可能看起来不够平滑。这可以通过增加数据点或使用插值来解决:
import numpy as np
import matplotlib.pyplot as plt
from scipy.interpolate import interp2d

x = np.linspace(-5, 5, 20)
y = np.linspace(-5, 5, 20)
X, Y = np.meshgrid(x, y)
Z = np.sin(np.sqrt(X**2 + Y**2))

f = interp2d(x, y, Z, kind='cubic')

x_new = np.linspace(-5, 5, 100)
y_new = np.linspace(-5, 5, 100)
Z_new = f(x_new, y_new)

plt.figure(figsize=(10, 8))
contour = plt.contour(x_new, y_new, Z_new)
plt.colorbar(contour)
plt.title('Smoothed Contour Plot - how2matplotlib.com')
plt.xlabel('X')
plt.ylabel('Y')
plt.show()
Output:
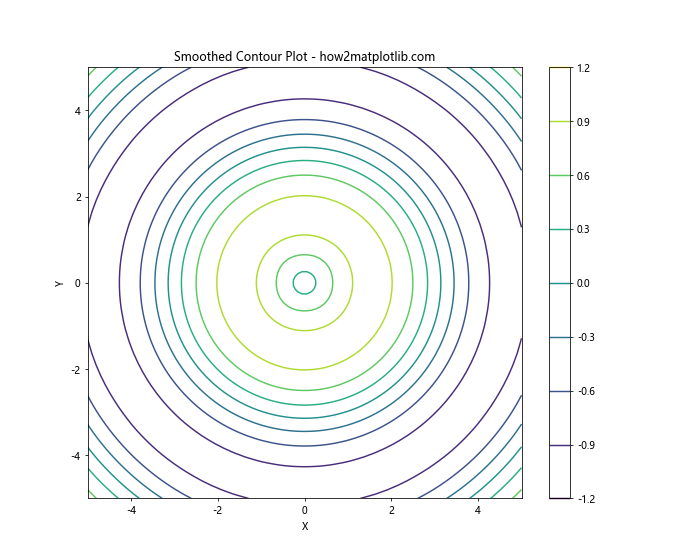
这个例子使用了scipy的interp2d函数来进行插值,使等高线更加平滑。
10.2 处理缺失数据
有时我们的数据可能包含缺失值(NaN)。Matplotlib可以处理这种情况:
import numpy as np
import matplotlib.pyplot as plt

x = np.linspace(-5, 5, 100)
y = np.linspace(-5, 5, 100)
X, Y = np.meshgrid(x, y)
Z = np.sin(np.sqrt(X**2 + Y**2))

# 添加一些缺失值
Z[20:40, 20:40] = np.nan

plt.figure(figsize=(10, 8))
contour = plt.contourf(X, Y, Z)
plt.colorbar(contour)
plt.title('Contour Plot with Missing Data - how2matplotlib.com')
plt.xlabel('X')
plt.ylabel('Y')
plt.show()
Output:
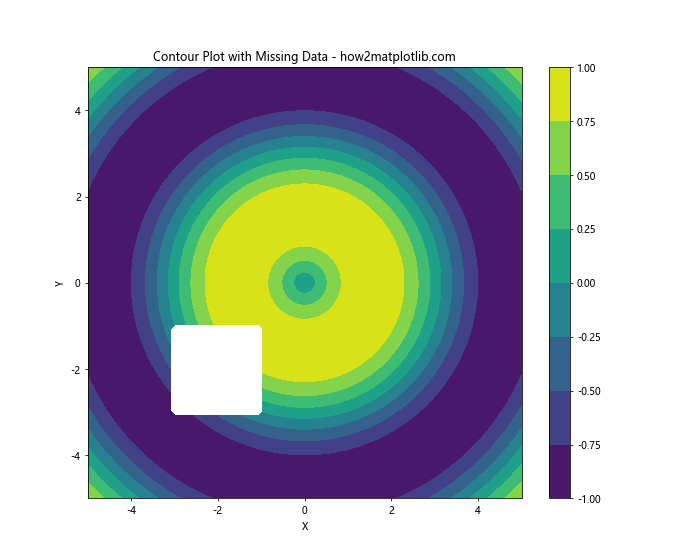
这个例子展示了如何处理包含缺失值的数据。
11. 与其他库的集成
11.1 与Pandas集成
我们可以使用Pandas的数据来创建等高线图:
import numpy as np
import pandas as pd
import matplotlib.pyplot as plt

# 创建一个DataFrame
df = pd.DataFrame({
    'x': np.random.rand(1000) * 10,
    'y': np.random.rand(1000) * 10,
    'z': np.random.rand(1000)
})

# 创建网格
xi = np.linspace(df.x.min(), df.x.max(), 100)
yi = np.linspace(df.y.min(), df.y.max(), 100)
X, Y = np.meshgrid(xi, yi)

# 使用griddata进行插值
from scipy.interpolate import griddata
Z = griddata((df.x, df.y), df.z, (X, Y), method='cubic')

plt.figure(figsize=(10, 8))
contour = plt.contourf(X, Y, Z)
plt.colorbar(contour)
plt.title('Contour Plot from Pandas Data - how2matplotlib.com')
plt.xlabel('X')
plt.ylabel('Y')
plt.show()
Output:
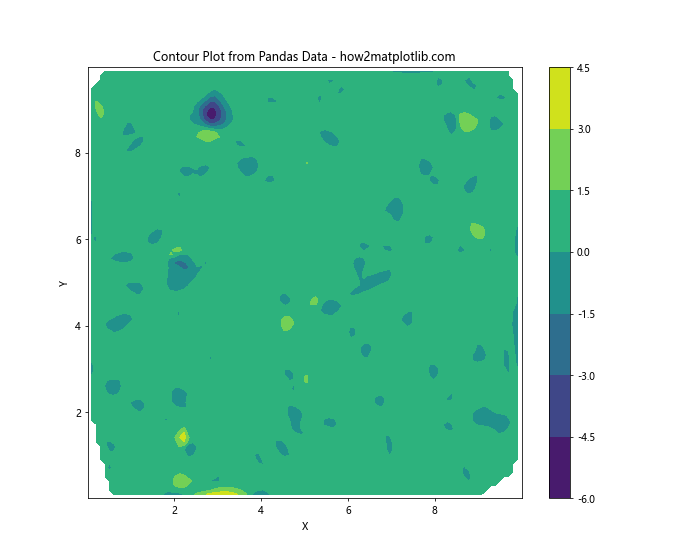
这个例子展示了如何从Pandas DataFrame创建等高线图。
11.2 与Seaborn集成
Seaborn是另一个流行的可视化库,它可以与Matplotlib很好地集成:
import numpy as np
import pandas as pd
import matplotlib.pyplot as plt
import seaborn as sns

x = np.linspace(-5, 5, 100)
y = np.linspace(-5, 5, 100)
X, Y = np.meshgrid(x, y)
Z = np.sin(np.sqrt(X**2 + Y**2))

df = pd.DataFrame({'x': X.flatten(), 'y': Y.flatten(), 'z': Z.flatten()})

plt.figure(figsize=(10, 8))
sns.kdeplot(data=df, x='x', y='y', cmap='viridis', shade=True, cbar=True)
plt.title('Seaborn KDE Plot - how2matplotlib.com')
plt.xlabel('X')
plt.ylabel('Y')
plt.show()
Output:
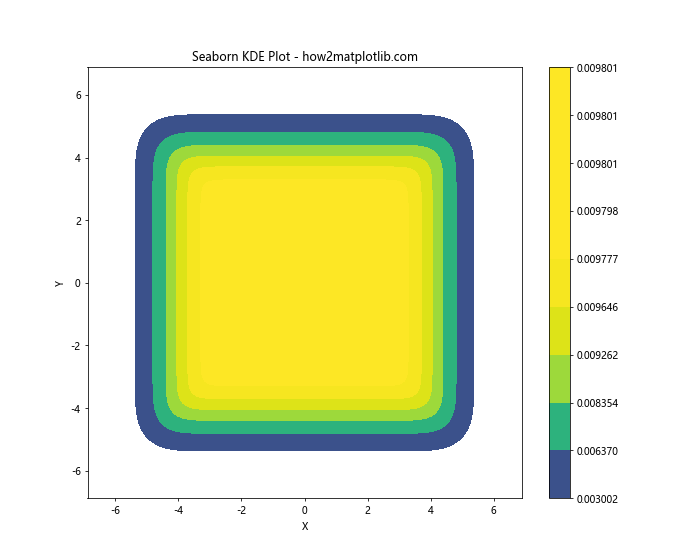
这个例子使用Seaborn的kdeplot函数创建了一个类似于等高线图的密度图。
12. 高级自定义
12.1 自定义colormap
我们可以创建自定义的colormap来更好地表达数据:
import numpy as np
import matplotlib.pyplot as plt
from matplotlib.colors import LinearSegmentedColormap

x = np.linspace(-5, 5, 100)
y = np.linspace(-5, 5, 100)
X, Y = np.meshgrid(x, y)
Z = np.sin(np.sqrt(X**2 + Y**2))

# 创建自定义colormap
colors = ['blue', 'white', 'red']
n_bins = 100
cmap = LinearSegmentedColormap.from_list('custom', colors, N=n_bins)

plt.figure(figsize=(10, 8))
contour = plt.contourf(X, Y, Z, cmap=cmap)
plt.colorbar(contour)
plt.title('Contour Plot with Custom Colormap - how2matplotlib.com')
plt.xlabel('X')
plt.ylabel('Y')
plt.show()
Output:
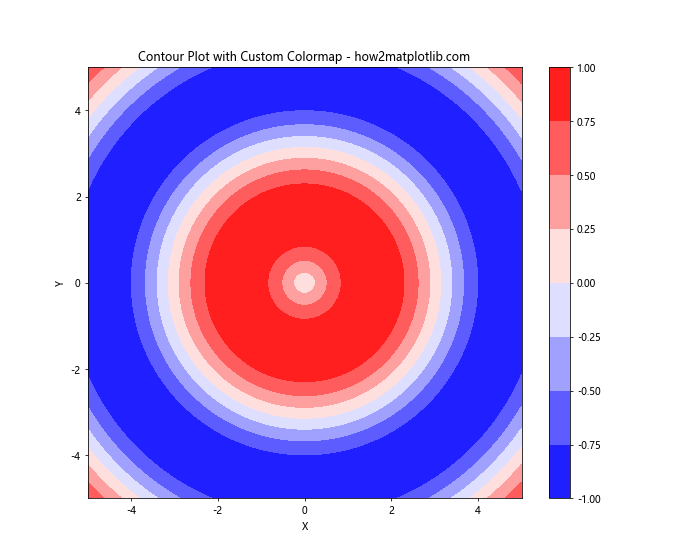
这个例子创建了一个从蓝色到白色再到红色的自定义colormap。
12.2 添加文本注释
我们可以在等高线图上添加文本注释来突出显示特定区域:
import numpy as np
import matplotlib.pyplot as plt

x = np.linspace(-5, 5, 100)
y = np.linspace(-5, 5, 100)
X, Y = np.meshgrid(x, y)
Z = np.sin(np.sqrt(X**2 + Y**2))

plt.figure(figsize=(10, 8))
contour = plt.contourf(X, Y, Z)
plt.colorbar(contour)

# 添加文本注释
plt.text(0, 0, 'Center', fontsize=12, ha='center', va='center', bbox=dict(facecolor='white', alpha=0.5))
plt.text(3, 3, 'Peak', fontsize=12, ha='center', va='center', bbox=dict(facecolor='white', alpha=0.5))

plt.title('Contour Plot with Annotations - how2matplotlib.com')
plt.xlabel('X')
plt.ylabel('Y')
plt.show()
Output:
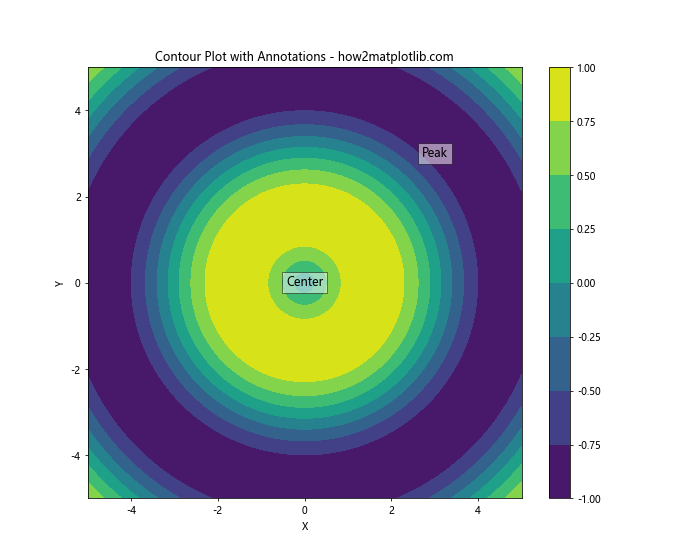
这个例子在等高线图上添加了两个文本注释。
结论
Matplotlib的contour功能是一个强大的工具,可以用来创建各种类型的等高线图。从基本的2D等高线图到复杂的3D表面图,从简单的数据可视化到高级的科学绘图,contour都能满足各种需求。通过本文的详细介绍和丰富的示例,相信你已经掌握了使用Matplotlib创建精美等高线图的技能。记住,实践是提高的关键,所以不要犹豫,开始尝试创建你自己的等高线图吧!
 极客教程
极客教程