Matplotlib柱状图绘制指南:从基础到高级技巧
Matplotlib是Python中最流行的数据可视化库之一,它提供了强大而灵活的工具来创建各种类型的图表。其中,柱状图(bar chart)是一种常用的图表类型,用于比较不同类别的数据。本文将深入探讨如何使用Matplotlib创建各种类型的柱状图,从基础概念到高级技巧,帮助你掌握柱状图绘制的精髓。
1. 基础柱状图
让我们从最基本的柱状图开始。基础柱状图用于展示单一系列的数据,每个类别对应一个柱子。
import matplotlib.pyplot as plt
import numpy as np

categories = ['A', 'B', 'C', 'D', 'E']
values = [3, 7, 2, 5, 8]

plt.figure(figsize=(10, 6))
plt.bar(categories, values)
plt.title('Basic Bar Chart - how2matplotlib.com')
plt.xlabel('Categories')
plt.ylabel('Values')
plt.show()
Output:
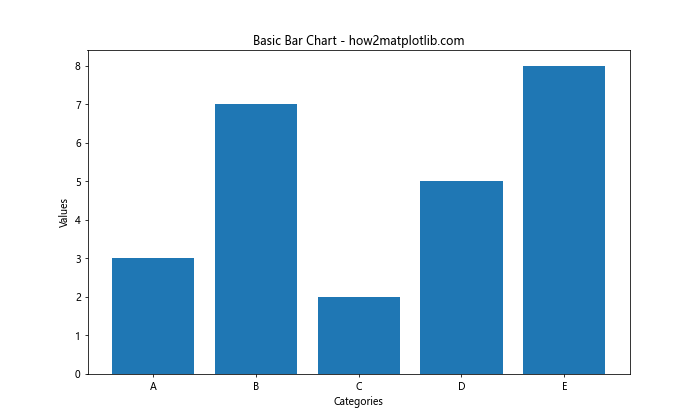
在这个例子中,我们首先导入必要的库:matplotlib.pyplot和numpy。然后,我们定义了类别和对应的值。使用plt.bar()函数创建柱状图,其中第一个参数是x轴的类别,第二个参数是对应的值。最后,我们设置了图表标题、x轴标签和y轴标签,并使用plt.show()显示图表。
2. 自定义柱状图颜色
你可以通过设置color参数来自定义柱子的颜色,使图表更具吸引力。
import matplotlib.pyplot as plt

categories = ['Apple', 'Banana', 'Orange', 'Grape', 'Pear']
values = [4, 7, 3, 6, 5]

plt.figure(figsize=(10, 6))
plt.bar(categories, values, color=['red', 'yellow', 'orange', 'purple', 'green'])
plt.title('Customized Color Bar Chart - how2matplotlib.com')
plt.xlabel('Fruits')
plt.ylabel('Quantity')
plt.show()
Output:
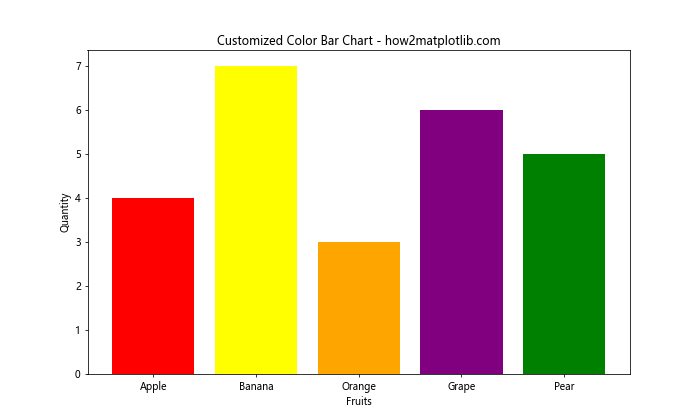
在这个例子中,我们为每个柱子指定了不同的颜色。你可以使用颜色名称、RGB值或十六进制代码来定义颜色。
3. 水平柱状图
有时,水平方向的柱状图可能更适合你的数据展示需求,特别是当类别名称较长时。
import matplotlib.pyplot as plt

categories = ['Category A', 'Category B', 'Category C', 'Category D', 'Category E']
values = [15, 30, 25, 22, 18]

plt.figure(figsize=(10, 6))
plt.barh(categories, values)
plt.title('Horizontal Bar Chart - how2matplotlib.com')
plt.xlabel('Values')
plt.ylabel('Categories')
plt.show()
Output:
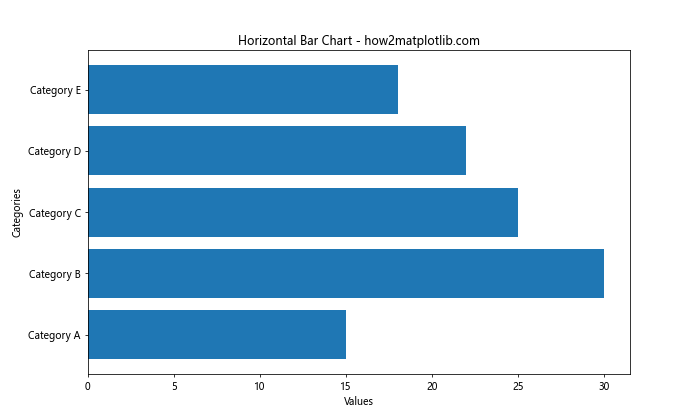
这里我们使用plt.barh()函数来创建水平柱状图。注意x轴和y轴的标签也相应地进行了调整。
4. 堆叠柱状图
堆叠柱状图用于展示多个系列的数据,每个系列的值堆叠在一起。
import matplotlib.pyplot as plt
import numpy as np

categories = ['A', 'B', 'C', 'D']
men_means = [20, 35, 30, 35]
women_means = [25, 32, 34, 20]

x = np.arange(len(categories))
width = 0.35

fig, ax = plt.subplots(figsize=(10, 6))
ax.bar(x, men_means, width, label='Men')
ax.bar(x, women_means, width, bottom=men_means, label='Women')

ax.set_ylabel('Scores')
ax.set_title('Stacked Bar Chart - how2matplotlib.com')
ax.set_xticks(x)
ax.set_xticklabels(categories)
ax.legend()

plt.show()
Output:
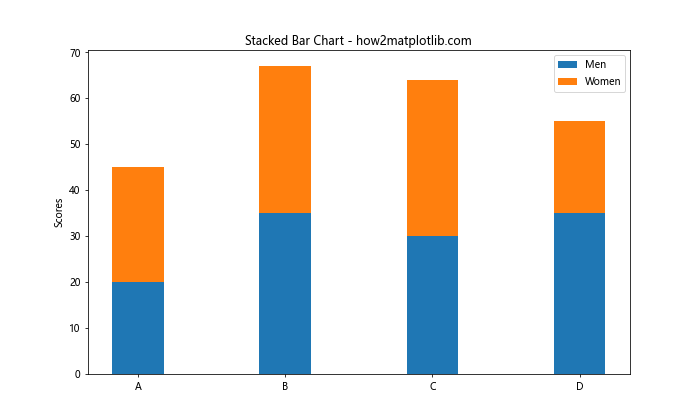
在这个例子中,我们创建了两个数据系列(男性和女性的得分)。使用bottom参数将女性的数据堆叠在男性数据之上。我们还添加了图例来区分不同的数据系列。
5. 分组柱状图
分组柱状图用于并排比较多个数据系列。
import matplotlib.pyplot as plt
import numpy as np

categories = ['Group A', 'Group B', 'Group C', 'Group D']
men_means = [20, 35, 30, 35]
women_means = [25, 32, 34, 20]

x = np.arange(len(categories))
width = 0.35

fig, ax = plt.subplots(figsize=(12, 6))
rects1 = ax.bar(x - width/2, men_means, width, label='Men')
rects2 = ax.bar(x + width/2, women_means, width, label='Women')

ax.set_ylabel('Scores')
ax.set_title('Grouped Bar Chart - how2matplotlib.com')
ax.set_xticks(x)
ax.set_xticklabels(categories)
ax.legend()

plt.show()
Output:
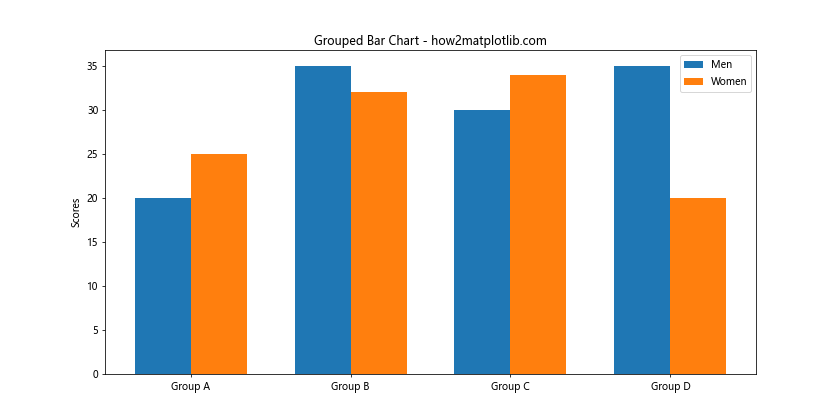
在这个例子中,我们通过调整柱子的位置(x - width/2和x + width/2)来创建分组效果。这样,每个类别下都有两个并排的柱子,分别代表男性和女性的数据。
6. 添加数值标签
为了使数据更加清晰,我们可以在每个柱子上添加数值标签。
import matplotlib.pyplot as plt
import numpy as np

categories = ['A', 'B', 'C', 'D', 'E']
values = [15, 30, 25, 22, 18]

fig, ax = plt.subplots(figsize=(10, 6))
bars = ax.bar(categories, values)

ax.set_ylabel('Values')
ax.set_title('Bar Chart with Value Labels - how2matplotlib.com')

for bar in bars:
    height = bar.get_height()
    ax.text(bar.get_x() + bar.get_width()/2., height,
            f'{height}',
            ha='center', va='bottom')

plt.show()
Output:
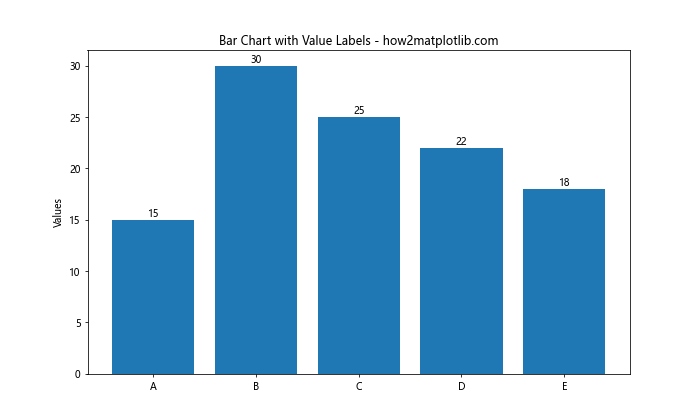
这个例子展示了如何在每个柱子上方添加对应的数值。我们遍历每个柱子,获取其高度,然后使用ax.text()函数在适当的位置添加文本。
7. 自定义柱状图样式
Matplotlib提供了多种方式来自定义柱状图的外观,包括边框颜色、填充样式等。
import matplotlib.pyplot as plt
import numpy as np

categories = ['Category 1', 'Category 2', 'Category 3', 'Category 4']
values = [25, 40, 30, 55]

fig, ax = plt.subplots(figsize=(10, 6))
bars = ax.bar(categories, values, edgecolor='black', linewidth=2,
              color='lightblue', hatch='//', alpha=0.8)

ax.set_ylabel('Values')
ax.set_title('Customized Bar Chart Style - how2matplotlib.com')
ax.spines['top'].set_visible(False)
ax.spines['right'].set_visible(False)

plt.show()
Output:
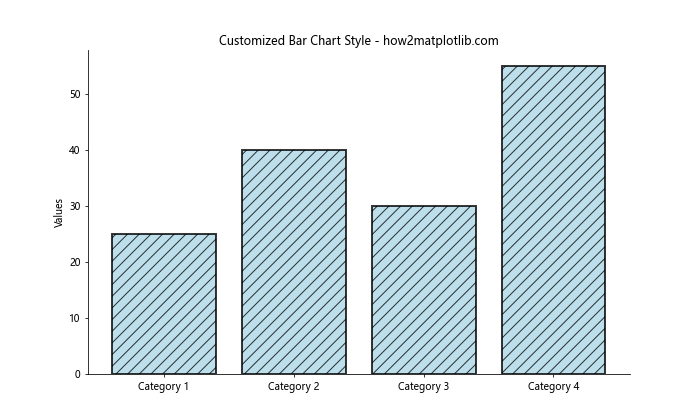
在这个例子中,我们设置了黑色边框(edgecolor='black'),增加了边框宽度(linewidth=2),使用了浅蓝色填充(color='lightblue'),添加了斜线填充样式(hatch='//'),并设置了透明度(alpha=0.8)。我们还移除了顶部和右侧的坐标轴线条。
8. 误差条
在某些情况下,你可能需要在柱状图上显示误差范围。Matplotlib允许你轻松地添加误差条。
import matplotlib.pyplot as plt
import numpy as np

categories = ['A', 'B', 'C', 'D']
values = [20, 35, 30, 25]
error = [2, 3, 4, 1]

fig, ax = plt.subplots(figsize=(10, 6))
ax.bar(categories, values, yerr=error, capsize=5,
       color='skyblue', ecolor='red', alpha=0.7)

ax.set_ylabel('Values')
ax.set_title('Bar Chart with Error Bars - how2matplotlib.com')

plt.show()
Output:
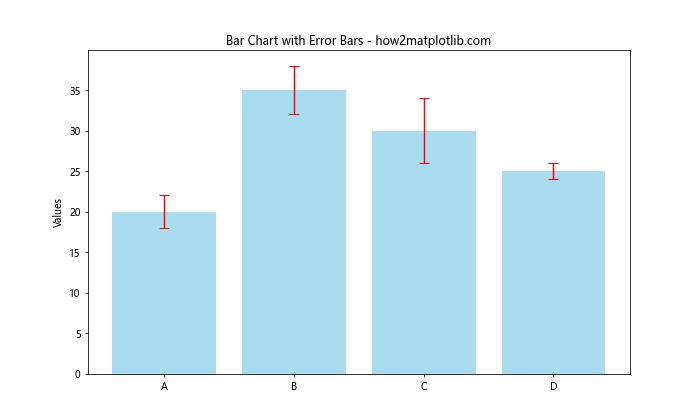
在这个例子中,我们使用yerr参数添加了误差条。capsize参数控制误差条末端横线的长度,ecolor设置误差条的颜色。
9. 多数据系列的比较
当需要比较多个数据系列时,我们可以使用不同的颜色和图例来区分它们。
import matplotlib.pyplot as plt
import numpy as np

categories = ['Category A', 'Category B', 'Category C', 'Category D']
series1 = [10, 15, 12, 18]
series2 = [12, 14, 16, 13]
series3 = [8, 10, 14, 11]

x = np.arange(len(categories))
width = 0.25

fig, ax = plt.subplots(figsize=(12, 6))
rects1 = ax.bar(x - width, series1, width, label='Series 1', color='#ff9999')
rects2 = ax.bar(x, series2, width, label='Series 2', color='#66b3ff')
rects3 = ax.bar(x + width, series3, width, label='Series 3', color='#99ff99')

ax.set_ylabel('Values')
ax.set_title('Multiple Series Comparison - how2matplotlib.com')
ax.set_xticks(x)
ax.set_xticklabels(categories)
ax.legend()

plt.tight_layout()
plt.show()
Output:
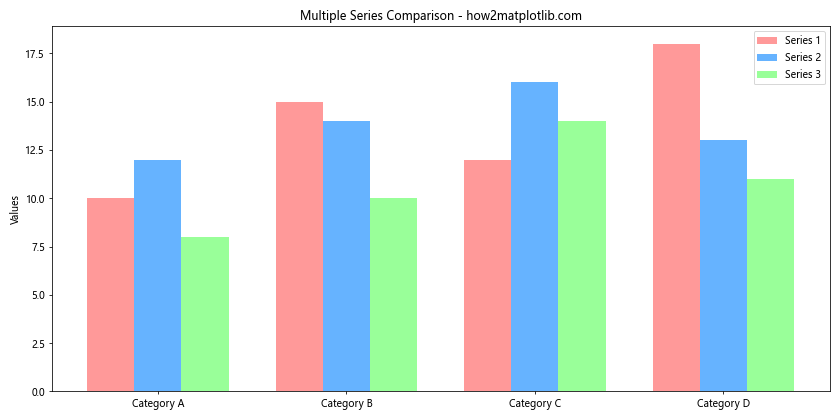
这个例子展示了如何并排显示三个数据系列。我们通过调整每个系列的x坐标位置来创建分组效果,并使用不同的颜色和图例来区分它们。
10. 百分比堆叠柱状图
有时,我们需要展示每个类别中不同部分的占比,这时百分比堆叠柱状图就很有用。
import matplotlib.pyplot as plt
import numpy as np

categories = ['A', 'B', 'C', 'D']
values1 = [20, 35, 30, 35]
values2 = [25, 32, 34, 20]
values3 = [15, 15, 20, 25]

def to_percent(y):
    return [100 * x / sum(y) for x in y]

y1 = to_percent(values1)
y2 = to_percent(values2)
y3 = to_percent(values3)

fig, ax = plt.subplots(figsize=(10, 6))
ax.bar(categories, y1, label='Type 1', color='#ff9999')
ax.bar(categories, y2, bottom=y1, label='Type 2', color='#66b3ff')
ax.bar(categories, y3, bottom=np.array(y1)+np.array(y2), label='Type 3', color='#99ff99')

ax.set_ylabel('Percentage')
ax.set_title('Percentage Stacked Bar Chart - how2matplotlib.com')
ax.legend(loc='upper left', bbox_to_anchor=(1,1))

plt.tight_layout()
plt.show()
Output:
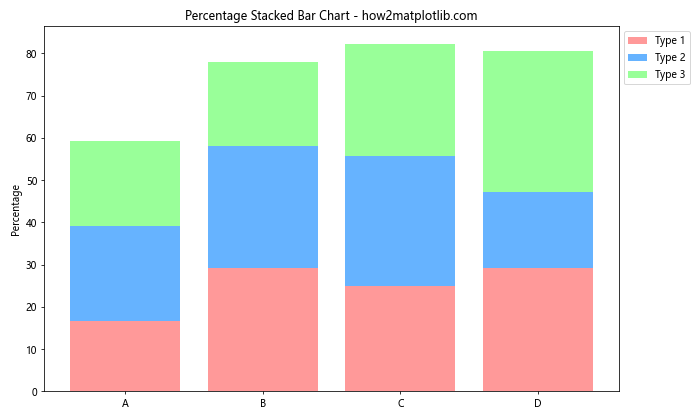
在这个例子中,我们首先将原始数据转换为百分比。然后,我们使用bottom参数来堆叠不同的数据系列,确保每个柱子的总高度都是100%。
11. 双轴柱状图
有时,你可能需要在同一图表中展示具有不同数量级的数据。这时,使用双轴可以很好地解决这个问题。
import matplotlib.pyplot as plt
import numpy as np

categories = ['A', 'B', 'C', 'D', 'E']
values1 = [100, 150, 120, 180, 200]
values2 = [1, 1.5, 1.2, 1.8, 2]

fig, ax1 = plt.subplots(figsize=(10, 6))

color = 'tab:blue'
ax1.set_xlabel('Categories')
ax1.set_ylabel('Values 1', color=color)
ax1.bar(categories, values1, color=color, alpha=0.7)
ax1.tick_params(axis='y', labelcolor=color)

ax2 = ax1.twinx()  # instantiate a second axes that shares the same x-axis

color = 'tab:orange'
ax2.set_ylabel('Values 2', color=color)
ax2.plot(categories, values2, color=color, marker='o', linewidth=2)
ax2.tick_params(axis='y', labelcolor=color)

plt.title('Dual Axis Bar and Line Chart - how2matplotlib.com')
fig.tight_layout()
plt.show()
Output:
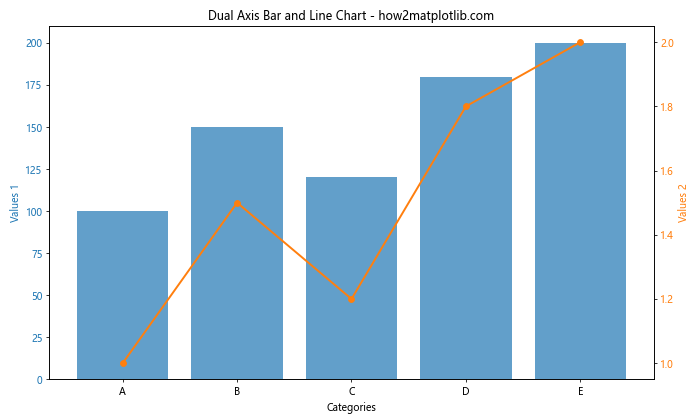
这个例子展示了如何创建一个双轴图表,左侧y轴对应柱状图,右侧y轴对应线图。这种方式允许我们在同一图表中展示不同数量级或单位的数据。
12. 极坐标柱状图
极坐标柱状图是一种独特的可视化方式,特别适合展示周期性数据或比较不同方向的数据。
import matplotlib.pyplot as plt
import numpy as np

categories = ['N', 'NE', 'E', 'SE', 'S', 'SW', 'W', 'NW']
values = [20, 14, 23, 10, 8, 12, 17, 15]

angles = np.linspace(0, 2*np.pi, len(categories), endpoint=False)

fig, ax = plt.subplots(figsize=(8, 8), subplot_kw=dict(projection='polar'))
bars = ax.bar(angles, values, width=0.5, bottom=0.0, alpha=0.5)

ax.set_xticks(angles)
ax.set_xticklabels(categories)
ax.set_title('Polar Bar Chart - how2matplotlib.com')

# 添加数值标签
for bar, angle, value in zip(bars, angles, values):
    ax.text(angle, value, f'{value}', ha='center', va='bottom')

plt.show()
Output:
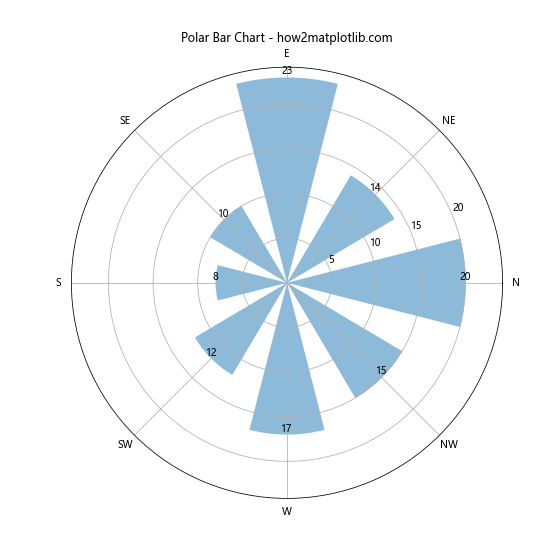
这个例子展示了如何创建极坐标柱状图。我们使用projection='polar'参数来设置极坐标系。这种图表特别适合展示方向性数据,如风向分布或雷达图等。
13. 渐变色柱状图
使用渐变色可以让你的柱状图更具视觉吸引力,同时也可以用来强调某些数据。
import matplotlib.pyplot as plt
import numpy as np
from matplotlib.colors import LinearSegmentedColormap

categories = ['A', 'B', 'C', 'D', 'E']
values = [15, 30, 45, 22, 38]

colors = LinearSegmentedColormap.from_list("", ["lightblue", "darkblue"])
fig, ax = plt.subplots(figsize=(10, 6))

bars = ax.bar(categories, values, color=colors(np.array(values)/max(values)))

ax.set_ylabel('Values')
ax.set_title('Gradient Color Bar Chart - how2matplotlib.com')

for bar in bars:
    height = bar.get_height()
    ax.text(bar.get_x() + bar.get_width()/2., height,
            f'{height}',
            ha='center', va='bottom')

plt.show()
Output:
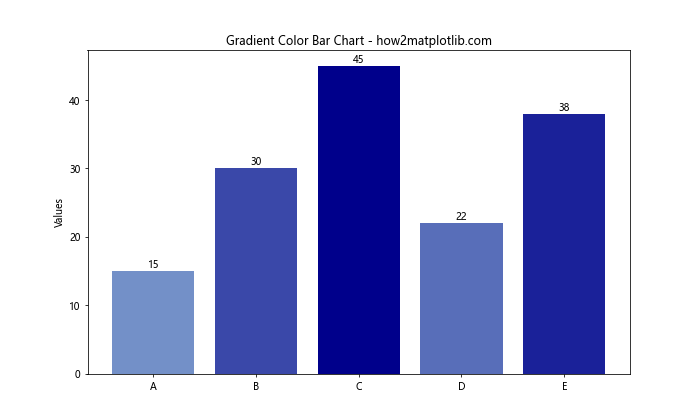
在这个例子中,我们使用LinearSegmentedColormap创建了一个从浅蓝到深蓝的渐变色映射。然后,我们根据每个值相对于最大值的比例来选择颜色。这样,值越大的柱子颜色越深。
14. 带背景色的柱状图
添加背景色可以帮助读者更容易地区分不同的数据组或强调某些特定的类别。
import matplotlib.pyplot as plt
import numpy as np

categories = ['A', 'B', 'C', 'D', 'E', 'F', 'G', 'H']
values = [25, 40, 30, 55, 45, 35, 50, 20]

fig, ax = plt.subplots(figsize=(12, 6))
bars = ax.bar(categories, values, color='skyblue')

ax.set_ylabel('Values')
ax.set_title('Bar Chart with Alternating Background - how2matplotlib.com')

# 添加交替的背景色
for i in range(0, len(categories), 2):
    ax.axvspan(i-0.5, i+0.5, facecolor='lightgray', alpha=0.3)

# 添加数值标签
for bar in bars:
    height = bar.get_height()
    ax.text(bar.get_x() + bar.get_width()/2., height,
            f'{height}',
            ha='center', va='bottom')

plt.show()
Output:
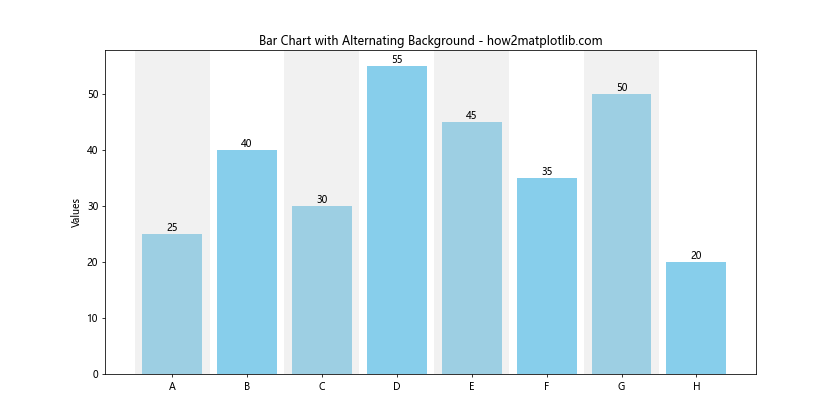
这个例子展示了如何为柱状图添加交替的背景色。我们使用ax.axvspan()函数来创建垂直的背景区域,这有助于区分相邻的类别。
15. 动态更新的柱状图
在某些应用中,你可能需要实时更新数据并刷新图表。以下是一个简单的动态更新柱状图的示例。
import matplotlib.pyplot as plt
import numpy as np
from matplotlib.animation import FuncAnimation

categories = ['A', 'B', 'C', 'D', 'E']
values = [0, 0, 0, 0, 0]

fig, ax = plt.subplots(figsize=(10, 6))
bars = ax.bar(categories, values)

ax.set_ylim(0, 100)
ax.set_title('Dynamic Updating Bar Chart - how2matplotlib.com')

def update(frame):
    for bar in bars:
        bar.set_height(np.random.randint(0, 100))
    return bars

ani = FuncAnimation(fig, update, frames=range(50), interval=200, blit=True)
plt.show()
Output:
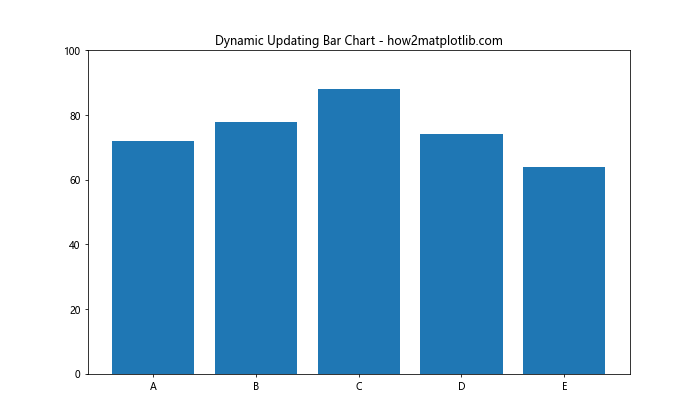
这个例子创建了一个动态更新的柱状图。每200毫秒,柱子的高度会随机变化。这种类型的图表在实时数据可视化中非常有用。
16. 带误差条的分组柱状图
当你需要比较多个组的数据并同时显示误差范围时,带误差条的分组柱状图是一个很好的选择。
import matplotlib.pyplot as plt
import numpy as np

categories = ['Group 1', 'Group 2', 'Group 3', 'Group 4']
men_means = [20, 35, 30, 35]
women_means = [25, 32, 34, 20]
men_std = [2, 3, 4, 1]
women_std = [3, 5, 2, 3]

x = np.arange(len(categories))
width = 0.35

fig, ax = plt.subplots(figsize=(12, 6))
rects1 = ax.bar(x - width/2, men_means, width, yerr=men_std, label='Men', capsize=5)
rects2 = ax.bar(x + width/2, women_means, width, yerr=women_std, label='Women', capsize=5)

ax.set_ylabel('Scores')
ax.set_title('Grouped Bar Chart with Error Bars - how2matplotlib.com')
ax.set_xticks(x)
ax.set_xticklabels(categories)
ax.legend()

plt.tight_layout()
plt.show()
Output:
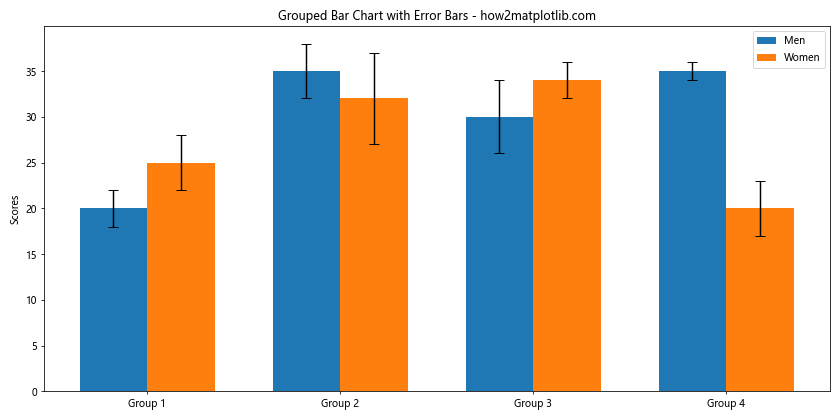
这个例子展示了如何创建带有误差条的分组柱状图。我们使用yerr参数来添加误差条,capsize参数控制误差条顶端横线的长度。这种图表在科学研究和数据分析中经常使用,可以同时展示平均值和数据的变异性。
17. 堆叠百分比柱状图
堆叠百分比柱状图可以帮助你比较不同类别中各部分的相对比例。
import matplotlib.pyplot as plt
import numpy as np

categories = ['A', 'B', 'C', 'D']
bottom = np.zeros(4)
values = [[30, 40, 20, 10],
          [25, 35, 30, 10],
          [45, 25, 15, 15]]
colors = ['#ff9999', '#66b3ff', '#99ff99']
labels = ['Type 1', 'Type 2', 'Type 3']

fig, ax = plt.subplots(figsize=(10, 6))

for i, value in enumerate(values):
    percentage = [v/sum(value)*100 for v in value]
    ax.bar(categories, percentage, bottom=bottom, label=labels[i], color=colors[i])
    bottom += percentage

ax.set_ylabel('Percentage')
ax.set_title('Stacked Percentage Bar Chart - how2matplotlib.com')
ax.legend(loc='upper left', bbox_to_anchor=(1,1))
ax.set_ylim(0, 100)

for c in ax.containers:
    ax.bar_label(c, fmt='%.1f%%', label_type='center')

plt.tight_layout()
plt.show()
Output:
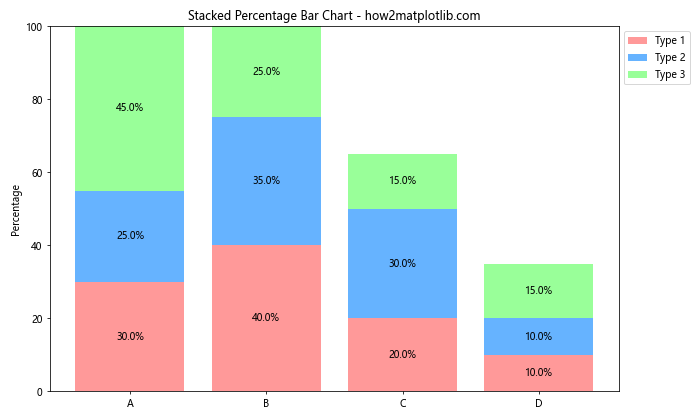
这个例子展示了如何创建堆叠百分比柱状图。我们首先计算每个类别中各部分的百分比,然后使用bottom参数来堆叠这些百分比。我们还使用bar_label函数在每个部分中间添加了百分比标签。
18. 带趋势线的柱状图
有时,在柱状图上添加趋势线可以帮助读者更好地理解数据的整体趋势。
import matplotlib.pyplot as plt
import numpy as np

categories = ['Jan', 'Feb', 'Mar', 'Apr', 'May', 'Jun']
values = [10, 15, 13, 18, 20, 25]

fig, ax = plt.subplots(figsize=(10, 6))
bars = ax.bar(categories, values, color='skyblue')

# 添加趋势线
z = np.polyfit(range(len(categories)), values, 1)
p = np.poly1d(z)
ax.plot(categories, p(range(len(categories))), "r--", linewidth=2)

ax.set_ylabel('Values')
ax.set_title('Bar Chart with Trend Line - how2matplotlib.com')

for bar in bars:
    height = bar.get_height()
    ax.text(bar.get_x() + bar.get_width()/2., height,
            f'{height}',
            ha='center', va='bottom')

plt.show()
Output:
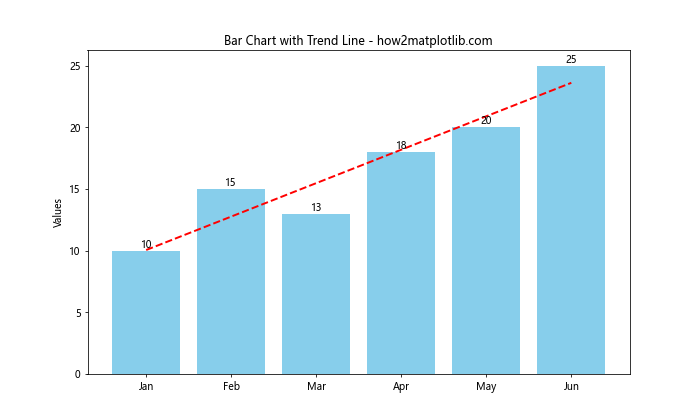
在这个例子中,我们使用np.polyfit和np.poly1d函数来计算并绘制一条线性趋势线。这可以帮助读者快速了解数据的整体走向。
结论
通过本文,我们详细探讨了使用Matplotlib创建各种类型柱状图的方法,从基础的单一系列柱状图到复杂的堆叠百分比柱状图和带趋势线的柱状图。我们学习了如何自定义柱状图的颜色、样式,如何添加误差条和数值标签,以及如何创建动态更新的图表。
柱状图是数据可视化中最常用和最有效的图表类型之一。它们简单直观,易于理解,适用于各种数据类型和比较场景。通过掌握这些技巧,你可以创建出既美观又信息丰富的柱状图,有效地传达你的数据洞察。
记住,好的数据可视化不仅仅是about技术实现,更重要的是选择合适的图表类型和设计来最好地展示你的数据。根据你的具体需求和数据特点,选择最合适的柱状图类型和样式,并适当地使用颜色、标签和其他视觉元素来增强图表的可读性和吸引力。
最后,Matplotlib提供了丰富的自定义选项,本文只是涵盖了其中的一部分。随着你对Matplotlib的深入学习和使用,你会发现更多强大的功能来创建独特和富有洞察力的数据可视化。继续探索,不断实践,你将能够创建出更加专业和有影响力的数据可视化作品。
 极客教程
极客教程