Matplotlib中axvline函数的全面应用指南
Matplotlib是Python中最流行的数据可视化库之一,它提供了丰富的绘图功能。在众多函数中,axvline是一个非常实用的工具,用于在图表中绘制垂直线。本文将深入探讨axvline函数的使用方法、参数设置以及在各种场景下的应用,帮助读者充分掌握这一强大的绘图工具。
1. axvline函数简介
axvline函数是Matplotlib库中的一个重要函数,它用于在图表中绘制垂直线。这个函数属于Axes对象,通常用于标记重要的x轴位置、分隔数据区域或突出显示特定的数据点。
1.1 基本语法
axvline函数的基本语法如下:
ax.axvline(x=0, ymin=0, ymax=1, **kwargs)
其中:
– x:指定垂直线的x坐标位置
– ymin和ymax:指定线条在y轴方向上的起始和结束位置(以轴的比例表示,范围为0到1)
– **kwargs:其他可选参数,如线条颜色、样式等
让我们看一个简单的例子:
import matplotlib.pyplot as plt

fig, ax = plt.subplots()
ax.set_xlim(0, 10)
ax.set_ylim(0, 10)
ax.axvline(x=5, color='r', linestyle='--')
ax.set_title('How2matplotlib.com - Basic axvline Example')
plt.show()
Output:
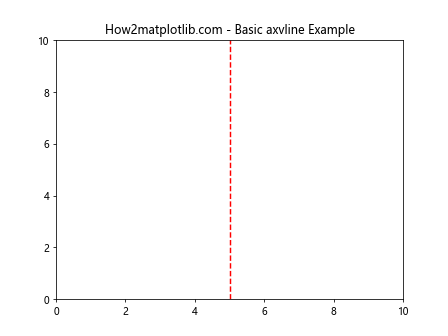
在这个例子中,我们在x=5的位置绘制了一条红色虚线。
2. axvline的常用参数
axvline函数有许多参数可以用来自定义垂直线的外观和行为。让我们详细探讨一些常用参数。
2.1 颜色设置
可以使用color参数来设置线条的颜色:
import matplotlib.pyplot as plt

fig, ax = plt.subplots()
ax.set_xlim(0, 10)
ax.set_ylim(0, 10)
ax.axvline(x=3, color='blue')
ax.axvline(x=6, color='#FF5733')  # 使用十六进制颜色代码
ax.axvline(x=9, color=(0.1, 0.2, 0.5))  # 使用RGB元组
ax.set_title('How2matplotlib.com - axvline Color Examples')
plt.show()
Output:
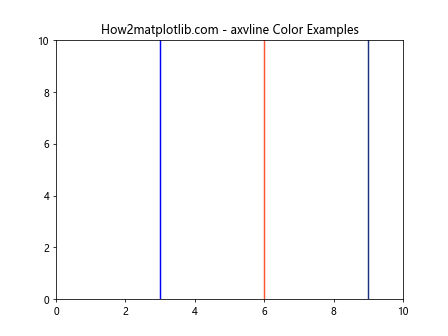
这个例子展示了三种不同的颜色设置方法:使用颜色名称、十六进制颜色代码和RGB元组。
2.2 线条样式
linestyle参数用于设置线条的样式:
import matplotlib.pyplot as plt

fig, ax = plt.subplots()
ax.set_xlim(0, 10)
ax.set_ylim(0, 10)
ax.axvline(x=2, linestyle='-', color='r')  # 实线
ax.axvline(x=4, linestyle='--', color='g')  # 虚线
ax.axvline(x=6, linestyle=':', color='b')  # 点线
ax.axvline(x=8, linestyle='-.', color='m')  # 点划线
ax.set_title('How2matplotlib.com - axvline Linestyle Examples')
plt.show()
Output:
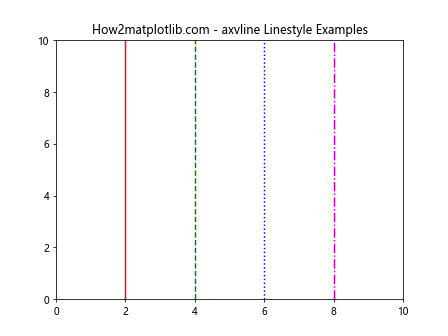
这个例子展示了四种不同的线条样式:实线、虚线、点线和点划线。
2.3 线条宽度
使用linewidth参数可以调整线条的宽度:
import matplotlib.pyplot as plt

fig, ax = plt.subplots()
ax.set_xlim(0, 10)
ax.set_ylim(0, 10)
ax.axvline(x=3, linewidth=1)
ax.axvline(x=5, linewidth=3)
ax.axvline(x=7, linewidth=5)
ax.set_title('How2matplotlib.com - axvline Linewidth Examples')
plt.show()
Output:
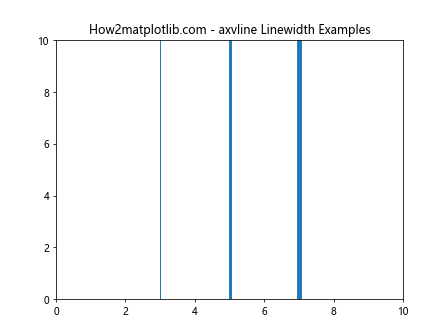
这个例子展示了三种不同宽度的垂直线。
2.4 透明度设置
alpha参数用于设置线条的透明度:
import matplotlib.pyplot as plt

fig, ax = plt.subplots()
ax.set_xlim(0, 10)
ax.set_ylim(0, 10)
ax.axvline(x=3, alpha=1.0, color='r')
ax.axvline(x=5, alpha=0.5, color='g')
ax.axvline(x=7, alpha=0.2, color='b')
ax.set_title('How2matplotlib.com - axvline Alpha Examples')
plt.show()
Output:
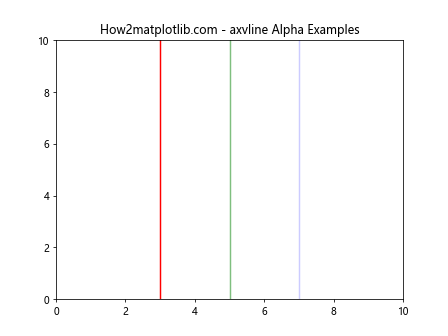
这个例子展示了三条不同透明度的垂直线。
3. axvline的高级应用
除了基本用法,axvline还有一些高级应用,可以帮助我们创建更复杂、更有信息量的图表。
3.1 多条垂直线
我们可以在同一个图表中绘制多条垂直线,用于比较或标记多个位置:
import matplotlib.pyplot as plt
import numpy as np

x = np.linspace(0, 10, 100)
y = np.sin(x)

fig, ax = plt.subplots()
ax.plot(x, y)
ax.axvline(x=np.pi, color='r', linestyle='--', label='π')
ax.axvline(x=2*np.pi, color='g', linestyle='--', label='2π')
ax.axvline(x=3*np.pi, color='b', linestyle='--', label='3π')
ax.legend()
ax.set_title('How2matplotlib.com - Multiple axvline Example')
plt.show()
Output:
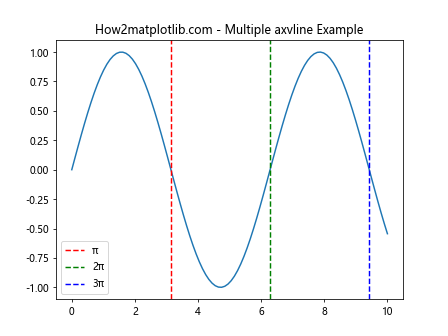
这个例子在正弦波图上标记了π、2π和3π的位置。
3.2 部分垂直线
使用ymin和ymax参数,我们可以绘制部分垂直线:
import matplotlib.pyplot as plt

fig, ax = plt.subplots()
ax.set_xlim(0, 10)
ax.set_ylim(0, 10)
ax.axvline(x=3, ymin=0.2, ymax=0.8, color='r')
ax.axvline(x=6, ymin=0, ymax=0.6, color='g')
ax.axvline(x=9, ymin=0.4, ymax=1, color='b')
ax.set_title('How2matplotlib.com - Partial axvline Examples')
plt.show()
Output:
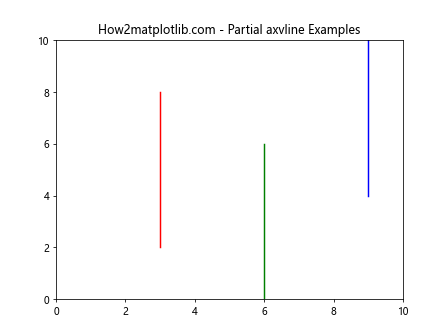
这个例子展示了如何绘制不同长度和位置的部分垂直线。
3.3 结合文本注释
我们可以结合text函数,为垂直线添加文本注释:
import matplotlib.pyplot as plt

fig, ax = plt.subplots()
ax.set_xlim(0, 10)
ax.set_ylim(0, 10)
ax.axvline(x=5, color='r', linestyle='--')
ax.text(5.1, 9, 'Important Point', rotation=90, va='top')
ax.set_title('How2matplotlib.com - axvline with Text Annotation')
plt.show()
Output:
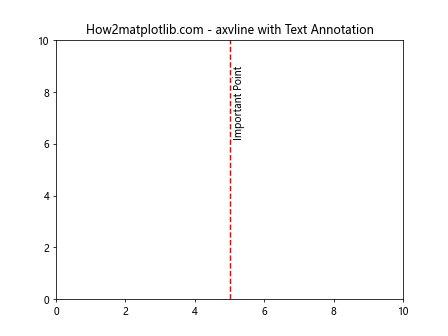
这个例子在垂直线旁边添加了一个旋转90度的文本注释。
3.4 在子图中使用axvline
axvline可以在子图中使用,为每个子图添加垂直线:
import matplotlib.pyplot as plt
import numpy as np

fig, (ax1, ax2) = plt.subplots(2, 1, figsize=(8, 8))

x = np.linspace(0, 10, 100)
ax1.plot(x, np.sin(x))
ax1.axvline(x=np.pi, color='r', linestyle='--')
ax1.set_title('How2matplotlib.com - Sine Wave')

ax2.plot(x, np.cos(x))
ax2.axvline(x=np.pi/2, color='g', linestyle='--')
ax2.set_title('How2matplotlib.com - Cosine Wave')

plt.tight_layout()
plt.show()
Output:
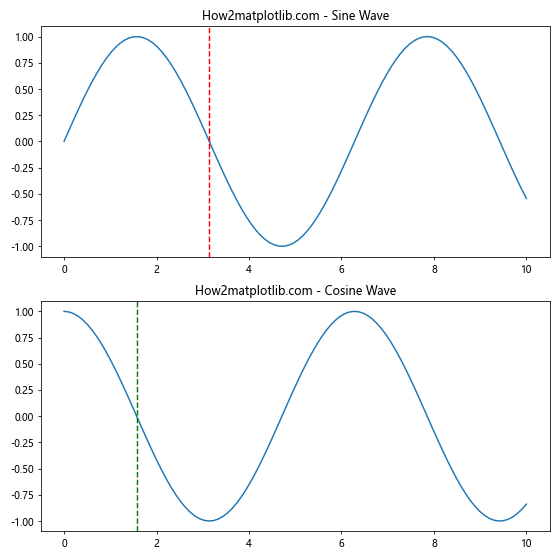
这个例子在两个子图中分别添加了垂直线,标记了正弦波和余弦波的特殊点。
4. axvline在数据分析中的应用
axvline函数在数据分析中有广泛的应用,可以帮助我们更好地理解和展示数据。
4.1 标记平均值
在统计分析中,我们经常需要标记数据的平均值:
import matplotlib.pyplot as plt
import numpy as np

data = np.random.normal(5, 2, 1000)
mean = np.mean(data)

fig, ax = plt.subplots()
ax.hist(data, bins=30)
ax.axvline(x=mean, color='r', linestyle='--', label=f'Mean: {mean:.2f}')
ax.legend()
ax.set_title('How2matplotlib.com - Histogram with Mean Line')
plt.show()
Output:
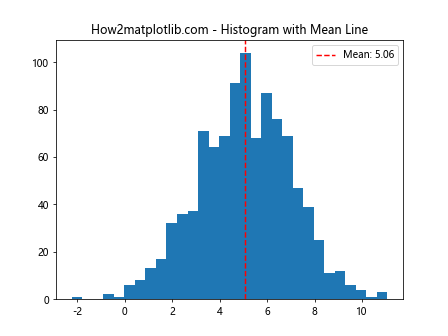
这个例子在直方图上用垂直线标记了数据的平均值。
4.2 标记时间序列中的特定事件
在时间序列分析中,axvline可以用来标记重要事件:
import matplotlib.pyplot as plt
import pandas as pd
import numpy as np

dates = pd.date_range(start='2023-01-01', end='2023-12-31', freq='D')
values = np.cumsum(np.random.randn(len(dates)))
event_date = pd.Timestamp('2023-07-01')

fig, ax = plt.subplots(figsize=(12, 6))
ax.plot(dates, values)
ax.axvline(x=event_date, color='r', linestyle='--')
ax.text(event_date, ax.get_ylim()[1], 'Important Event', rotation=90, va='top')
ax.set_title('How2matplotlib.com - Time Series with Event Marker')
plt.show()
Output:
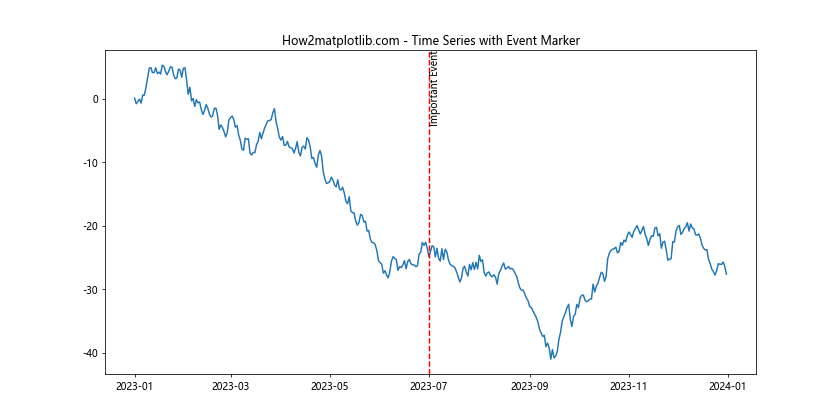
这个例子在时间序列图上标记了一个重要事件的日期。
4.3 在箱线图中标记阈值
在箱线图中,我们可以使用axvline来标记重要的阈值:
import matplotlib.pyplot as plt
import numpy as np

data = [np.random.normal(0, std, 100) for std in range(1, 4)]
fig, ax = plt.subplots()
ax.boxplot(data)
ax.axvline(x=1.5, color='r', linestyle='--', label='Threshold')
ax.legend()
ax.set_title('How2matplotlib.com - Boxplot with Threshold Line')
plt.show()
Output:
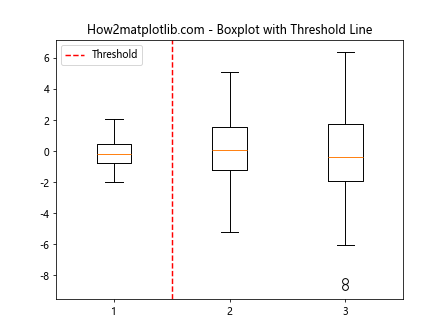
这个例子在箱线图中添加了一条表示阈值的垂直线。
5. axvline的样式定制
除了基本的样式设置,我们还可以进一步定制axvline的外观,使其更好地融入图表设计。
5.1 使用自定义线型
我们可以使用自定义的线型来创建独特的垂直线:
import matplotlib.pyplot as plt

fig, ax = plt.subplots()
ax.set_xlim(0, 10)
ax.set_ylim(0, 10)
ax.axvline(x=5, linestyle=(0, (5, 5)), color='r', linewidth=2)
ax.set_title('How2matplotlib.com - Custom Linestyle axvline')
plt.show()
Output:
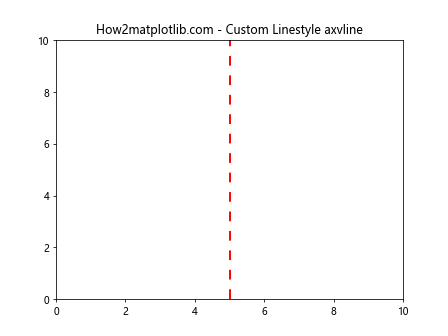
这个例子使用了自定义的虚线样式。
5.2 添加阴影效果
我们可以为垂直线添加阴影效果,使其更加醒目:
import matplotlib.pyplot as plt
import numpy as np

x = np.linspace(0, 10, 100)
y = np.sin(x)

fig, ax = plt.subplots()
ax.plot(x, y)
line = ax.axvline(x=5, color='r', linestyle='--')
ax.axvline(x=5, color='r', alpha=0.2, linewidth=10)
ax.set_title('How2matplotlib.com - axvline with Shadow Effect')
plt.show()
Output:
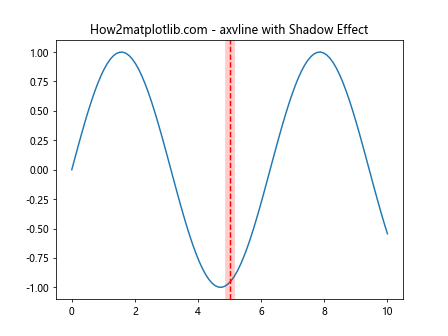
这个例子通过叠加一条宽而透明的线来创建阴影效果。
5.3 使用渐变色
我们可以使用颜色映射来创建渐变色的垂直线:
import matplotlib.pyplot as plt
import numpy as np
from matplotlib.collections import LineCollection

fig, ax = plt.subplots()
ax.set_xlim(0, 10)
ax.set_ylim(0, 10)

x = 5 * np.ones(100)
y = np.linspace(0, 10, 100)
points = np.array([x, y]).T.reshape(-1, 1, 2)
segments = np.concatenate([points[:-1], points[1:]], axis=1)

lc = LineCollection(segments, cmap='viridis')
lc.set_array(y)
ax.add_collection(lc)

ax.set_title('How2matplotlib.com - Gradient Color axvline')
plt.colorbar(lc)
plt.show()
Output:
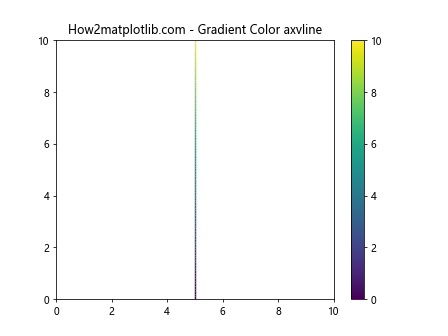
这个例子创建了一条使用颜色映射的渐变色垂直线。
6. axvline在动态图表中的应用
axvline不仅可以用于静态图表,还可以在动态图表中发挥作用。
6.1 动态更新垂直线位置
我们可以创建一个动画,展示垂直线随时间移动:
import matplotlib.pyplot as plt
import numpy as np
from matplotlib.animation import FuncAnimation

fig, ax = plt.subplots()
ax.set_xlim(0, 10)
ax.set_ylim(-1, 1)

x = np.linspace(0, 10, 1000)
y = np.sin(x)
line, = ax.plot(x, y)
vline = ax.axvline(x=0, color='r')

def update(frame):
    vline.set_xdata(frame)
    return vline,

ani = FuncAnimation(fig, update, frames=np.linspace(0, 10, 200), interval=50, blit=True)
ax.set_title('How2matplotlib.com - Animated axvline')
plt.show()
Output:
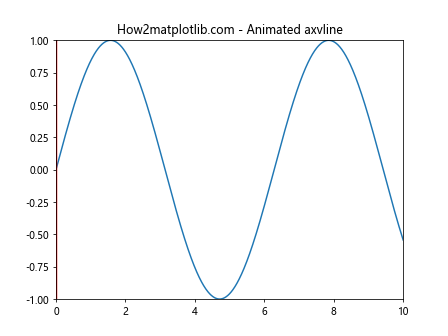
这个例子创建了一个动画,展示了垂直线在正弦波上移动的效果。
6.2 交互式垂直线
我们可以使用Matplotlib的交互式功能,允许用户通过鼠标点击来添加垂直线:
import matplotlib.pyplot as plt
import numpy as np

fig, ax = plt.subplots()
ax.set_xlim(0, 10)
ax.set_ylim(-1, 1)

x = np.linspace(0, 10, 1000)
y = np.sin(x)
ax.plot(x, y)

def on_click(event):
    if event.inaxes == ax:
        ax.axvline(x=event.xdata, color='r', linestyle='--')
        fig.canvas.draw()

fig.canvas.mpl_connect('button_press_event', on_click)
ax.set_title('How2matplotlib.com - Interactive axvline')
plt.show()
Output:
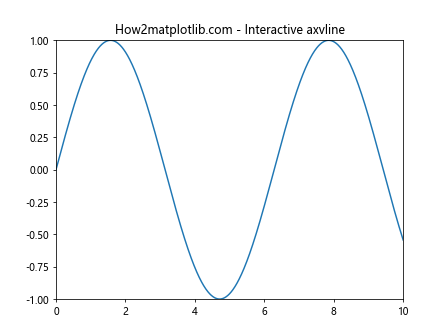
这个例子允许用户通过点击图表来添加垂直线。
7. axvline与其他Matplotlib功能的结合
axvline可以与Matplotlib的其他功能结合使用,创造出更复杂和信息丰富的图表。
7.1 结合axhline创建网格
我们可以结合axvline和axhline创建自定义网格:
import matplotlib.pyplot as plt
import numpy as np

fig, ax = plt.subplots()
ax.set_xlim(0, 10)
ax.set_ylim(0, 10)

for i in range(1, 10):
    ax.axvline(x=i, color='gray', linestyle=':', alpha=0.5)
    ax.axhline(y=i, color='gray', linestyle=':', alpha=0.5)

ax.set_title('How2matplotlib.com - Custom Grid with axvline and axhline')
plt.show()
Output:
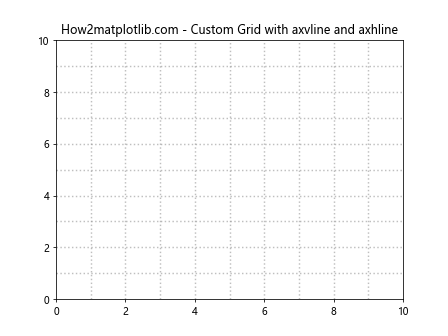
这个例子创建了一个自定义的网格系统。
7.2 与填充区域结合
我们可以使用axvline来标记填充区域的边界:
import matplotlib.pyplot as plt
import numpy as np

x = np.linspace(0, 10, 100)
y = np.sin(x)

fig, ax = plt.subplots()
ax.plot(x, y)
ax.fill_between(x, y, where=(x > 3) & (x < 7), alpha=0.3)
ax.axvline(x=3, color='r', linestyle='--')
ax.axvline(x=7, color='r', linestyle='--')
ax.set_title('How2matplotlib.com - axvline with Filled Region')
plt.show()
Output:
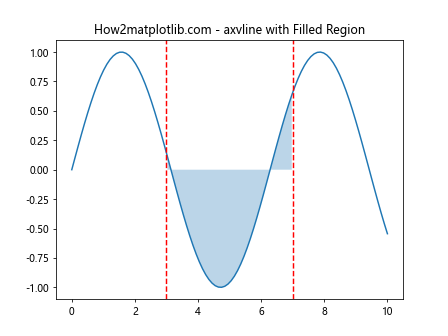
这个例子使用axvline标记了填充区域的起始和结束位置。
7.3 在3D图中使用axvline
虽然axvline主要用于2D图表,但我们也可以在3D图中使用类似的概念:
import matplotlib.pyplot as plt
import numpy as np

fig = plt.figure()
ax = fig.add_subplot(111, projection='3d')

x = np.linspace(-5, 5, 100)
y = np.linspace(-5, 5, 100)
X, Y = np.meshgrid(x, y)
Z = np.sin(np.sqrt(X**2 + Y**2))

ax.plot_surface(X, Y, Z, cmap='viridis')

ax.plot([0, 0], [-5, 5], [-1, 1], color='r', linestyle='--')
ax.plot([-5, 5], [0, 0], [-1, 1], color='g', linestyle='--')

ax.set_title('How2matplotlib.com - 3D Plot with Vertical Lines')
plt.show()
Output:
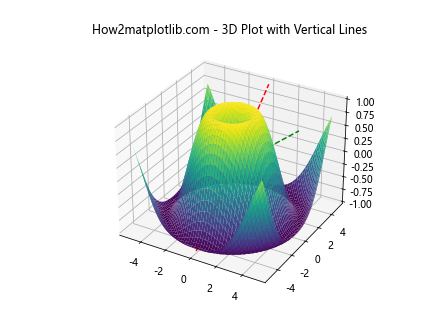
这个例子在3D图中添加了类似axvline的垂直线。
8. axvline在特殊图表类型中的应用
axvline不仅可以用于常见的图表类型,还可以在一些特殊的图表类型中发挥作用。
8.1 在极坐标图中使用axvline
虽然axvline主要用于笛卡尔坐标系,但我们可以在极坐标图中使用类似的概念:
import matplotlib.pyplot as plt
import numpy as np

r = np.arange(0, 2, 0.01)
theta = 2 * np.pi * r

fig, ax = plt.subplots(subplot_kw={'projection': 'polar'})
ax.plot(theta, r)
ax.set_rticks([0.5, 1, 1.5, 2])

for angle in [0, np.pi/2, np.pi, 3*np.pi/2]:
    ax.plot([angle, angle], [0, 2], color='r', linestyle='--')

ax.set_title('How2matplotlib.com - Polar Plot with Radial Lines')
plt.show()
Output:
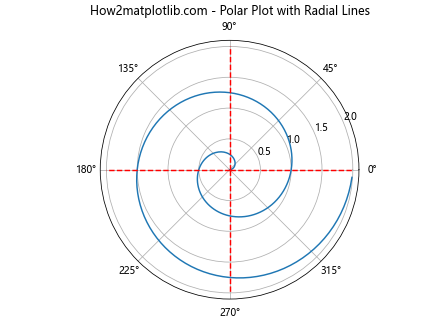
这个例子在极坐标图中添加了类似axvline的径向线。
8.2 在对数坐标图中使用axvline
axvline在对数坐标图中也非常有用:
import matplotlib.pyplot as plt
import numpy as np

fig, ax = plt.subplots()
ax.set_xscale('log')
ax.set_yscale('log')

x = np.logspace(0, 3, 100)
y = x**2

ax.plot(x, y)
ax.axvline(x=10, color='r', linestyle='--')
ax.axvline(x=100, color='g', linestyle='--')

ax.set_title('How2matplotlib.com - Log-Log Plot with axvline')
plt.show()
Output:
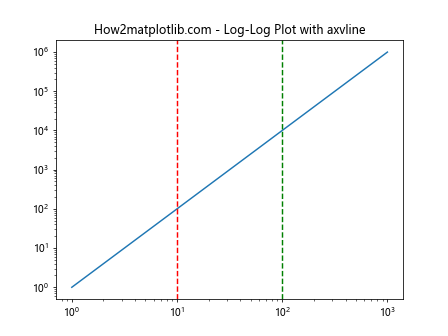
这个例子在对数-对数图中添加了垂直线。
9. axvline的性能考虑
在处理大量数据或创建复杂图表时,性能是一个重要考虑因素。
9.1 多条axvline的替代方法
当需要绘制大量垂直线时,使用vlines函数可能比多次调用axvline更高效:
import matplotlib.pyplot as plt
import numpy as np

fig, ax = plt.subplots()
ax.set_xlim(0, 10)
ax.set_ylim(0, 10)

x_positions = np.arange(0.5, 10, 0.5)
ax.vlines(x_positions, 0, 10, colors='r', linestyles='--', alpha=0.5)

ax.set_title('How2matplotlib.com - Multiple Vertical Lines with vlines')
plt.show()
Output:
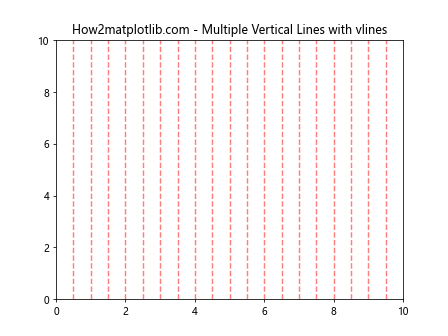
这个例子使用vlines函数一次性绘制多条垂直线。
9.2 动态图表中的优化
在动态图表中,我们可以通过更新线条数据而不是重新绘制来提高性能:
import matplotlib.pyplot as plt
import numpy as np
from matplotlib.animation import FuncAnimation

fig, ax = plt.subplots()
ax.set_xlim(0, 10)
ax.set_ylim(-1, 1)

x = np.linspace(0, 10, 1000)
y = np.sin(x)
line, = ax.plot(x, y)
vline, = ax.plot([0, 0], [-1, 1], color='r')

def update(frame):
    vline.set_xdata([frame, frame])
    return vline,

ani = FuncAnimation(fig, update, frames=np.linspace(0, 10, 200), interval=50, blit=True)
ax.set_title('How2matplotlib.com - Optimized Animated axvline')
plt.show()
Output:

这个例子通过更新线条数据来实现动画效果,而不是重复调用axvline。
10. 总结
axvline函数是Matplotlib库中一个强大而灵活的工具,用于在图表中添加垂直线。它可以用于标记重要位置、分隔数据区域、突出显示特定数据点等多种用途。通过调整各种参数,如颜色、线型、宽度和透明度,我们可以创建出既美观又信息丰富的图表。
axvline不仅可以用于基本的2D图表,还可以应用于各种复杂的图表类型,如3D图、极坐标图和对数图。它还可以与其他Matplotlib功能结合使用,创造出更加复杂和信息丰富的可视化效果。
在实际应用中,axvline在数据分析、时间序列分析、统计可视化等领域都有广泛的应用。通过合理使用axvline,我们可以更好地展示数据的特征和趋势,帮助读者更直观地理解数据背后的信息。
最后,在使用axvline时,我们还需要考虑性能问题,特别是在处理大量数据或创建动态图表时。通过使用适当的替代方法和优化技巧,我们可以在保持图表质量的同时提高程序的效率。
总之,掌握axvline函数的使用,将极大地丰富我们的数据可视化工具箱,帮助我们创建更加专业和有洞察力的图表。
 极客教程
极客教程