Matplotlib中的Axis.set_gid()函数:设置图形元素的全局标识符
参考:Matplotlib.axis.Axis.set_gid() function in Python
Matplotlib是Python中最流行的数据可视化库之一,它提供了丰富的绘图功能和自定义选项。在Matplotlib中,Axis.set_gid()函数是一个非常有用的工具,它允许我们为坐标轴对象设置全局标识符(Global Identifier,简称GID)。本文将深入探讨Axis.set_gid()函数的用法、应用场景以及相关的高级技巧。
1. Axis.set_gid()函数简介
Axis.set_gid()函数是Matplotlib库中axis.Axis类的一个方法。它的主要作用是为坐标轴对象设置一个全局唯一的标识符。这个标识符可以在后续的操作中用来引用和操作特定的坐标轴对象。
函数的基本语法如下:
Axis.set_gid(gid)
其中,gid参数是一个字符串,用于指定要设置的全局标识符。
让我们来看一个简单的示例:
import matplotlib.pyplot as plt

fig, ax = plt.subplots()
ax.plot([1, 2, 3, 4], [1, 4, 2, 3], label='Data from how2matplotlib.com')
ax.xaxis.set_gid('x_axis_how2matplotlib')
ax.yaxis.set_gid('y_axis_how2matplotlib')

plt.show()
Output:
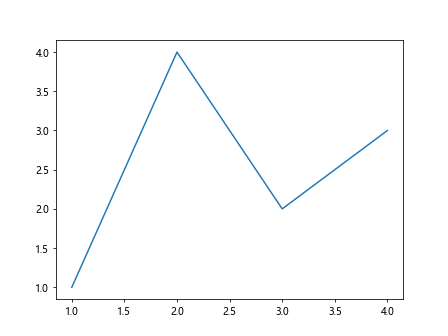
在这个例子中,我们为x轴和y轴分别设置了全局标识符。这些标识符可以在后续的操作中用来引用这些特定的坐标轴。
2. 为什么要使用set_gid()函数?
使用set_gid()函数有几个重要的原因:
- 唯一标识:通过设置GID,我们可以为图形中的每个元素创建一个唯一的标识符。这在处理复杂的图形时特别有用,因为它允许我们精确地引用和操作特定的元素。
-
SVG输出:当将图形保存为SVG格式时,GID会被包含在SVG文件中。这使得我们可以在外部工具中轻松地识别和操作特定的图形元素。
-
交互式应用:在创建交互式可视化应用时,GID可以用来关联用户交互(如点击事件)与特定的图形元素。
-
样式定制:通过GID,我们可以在外部CSS文件中为特定的图形元素定义样式,这在创建网页嵌入式图表时非常有用。
让我们看一个更复杂的例子,展示如何使用GID来自定义坐标轴的样式:
import matplotlib.pyplot as plt

fig, ax = plt.subplots()
ax.plot([1, 2, 3, 4], [1, 4, 2, 3], label='Data from how2matplotlib.com')

ax.xaxis.set_gid('x_axis_how2matplotlib')
ax.yaxis.set_gid('y_axis_how2matplotlib')

ax.xaxis.label.set_gid('x_label_how2matplotlib')
ax.yaxis.label.set_gid('y_label_how2matplotlib')

ax.set_xlabel('X-axis (how2matplotlib.com)')
ax.set_ylabel('Y-axis (how2matplotlib.com)')

plt.savefig('custom_axis.svg')
plt.show()
Output:
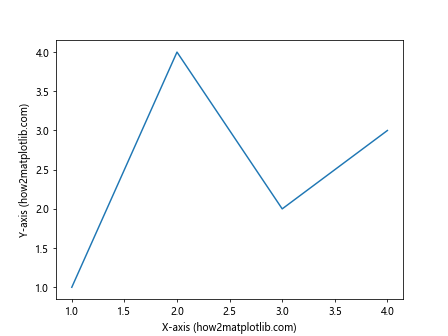
在这个例子中,我们不仅为x轴和y轴设置了GID,还为它们的标签设置了GID。这样,我们就可以在SVG文件中或通过CSS精确地控制这些元素的样式。
3. set_gid()函数的高级应用
3.1 在多子图中使用set_gid()
当我们创建包含多个子图的复杂图形时,set_gid()函数可以帮助我们轻松地管理和操作每个子图的坐标轴。例如:
import matplotlib.pyplot as plt

fig, (ax1, ax2) = plt.subplots(1, 2, figsize=(10, 5))

ax1.plot([1, 2, 3, 4], [1, 4, 2, 3], label='Data 1 from how2matplotlib.com')
ax2.plot([1, 2, 3, 4], [3, 2, 4, 1], label='Data 2 from how2matplotlib.com')

ax1.xaxis.set_gid('x_axis_1_how2matplotlib')
ax1.yaxis.set_gid('y_axis_1_how2matplotlib')
ax2.xaxis.set_gid('x_axis_2_how2matplotlib')
ax2.yaxis.set_gid('y_axis_2_how2matplotlib')

plt.tight_layout()
plt.show()
Output:
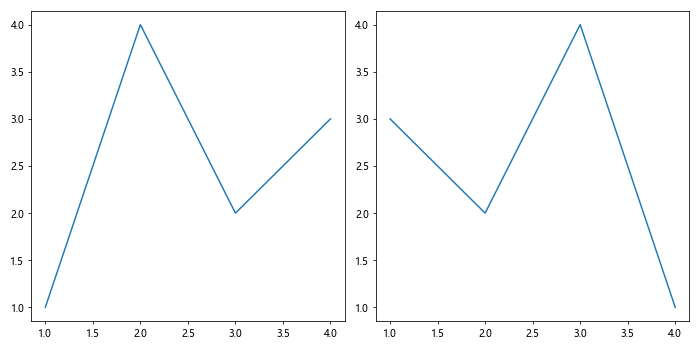
在这个例子中,我们为两个子图的x轴和y轴分别设置了唯一的GID。这使得我们可以在后续的操作中精确地引用和修改每个子图的坐标轴。
3.2 结合事件处理使用set_gid()
set_gid()函数在创建交互式图形时特别有用。我们可以结合Matplotlib的事件处理机制,根据用户的交互来操作特定的图形元素。例如:
import matplotlib.pyplot as plt

fig, ax = plt.subplots()
ax.plot([1, 2, 3, 4], [1, 4, 2, 3], label='Data from how2matplotlib.com')

ax.xaxis.set_gid('x_axis_how2matplotlib')
ax.yaxis.set_gid('y_axis_how2matplotlib')

def on_click(event):
    if event.inaxes:
        if event.inaxes.xaxis.get_gid() == 'x_axis_how2matplotlib':
            print('Clicked on x-axis of how2matplotlib.com')
        elif event.inaxes.yaxis.get_gid() == 'y_axis_how2matplotlib':
            print('Clicked on y-axis of how2matplotlib.com')

fig.canvas.mpl_connect('button_press_event', on_click)

plt.show()
Output:
在这个例子中,我们定义了一个点击事件处理函数,它会检查被点击的坐标轴的GID,并根据GID打印相应的消息。
3.3 在动画中使用set_gid()
当创建动画时,set_gid()函数可以帮助我们跟踪和更新特定的图形元素。例如:
import matplotlib.pyplot as plt
import matplotlib.animation as animation
import numpy as np

fig, ax = plt.subplots()
line, = ax.plot([], [], lw=2)
ax.set_xlim(0, 2*np.pi)
ax.set_ylim(-1, 1)

line.set_gid('animated_line_how2matplotlib')
ax.xaxis.set_gid('x_axis_how2matplotlib')
ax.yaxis.set_gid('y_axis_how2matplotlib')

def init():
    line.set_data([], [])
    return line,

def animate(i):
    x = np.linspace(0, 2*np.pi, 100)
    y = np.sin(x + i/10.0)
    line.set_data(x, y)
    return line,

anim = animation.FuncAnimation(fig, animate, init_func=init,
                               frames=200, interval=20, blit=True)

plt.show()
Output:
在这个动画示例中,我们为动画线条和坐标轴设置了GID。这使得我们可以在动画过程中精确地控制和更新这些元素。
4. set_gid()函数的注意事项
虽然set_gid()函数非常有用,但在使用时也需要注意以下几点:
- 唯一性:GID应该是唯一的。如果多个元素使用相同的GID,可能会导致意外的行为。
-
性能考虑:过度使用GID可能会影响性能,特别是在处理大量图形元素时。只为需要特别控制的元素设置GID。
-
兼容性:不是所有的Matplotlib后端都支持GID。在使用GID时,请确保你的目标输出格式(如SVG)支持GID。
-
命名约定:建议使用有意义的名称作为GID,以便于理解和维护。例如,使用描述性的前缀如
'axis_'、'line_'等。
让我们看一个例子,展示如何合理使用GID:
import matplotlib.pyplot as plt

fig, ax = plt.subplots()

# 主数据线
main_line, = ax.plot([1, 2, 3, 4], [1, 4, 2, 3], label='Main data from how2matplotlib.com')
main_line.set_gid('main_line_how2matplotlib')

# 辅助数据线
aux_line, = ax.plot([1, 2, 3, 4], [2, 3, 1, 4], label='Auxiliary data from how2matplotlib.com')
aux_line.set_gid('aux_line_how2matplotlib')

# 坐标轴
ax.xaxis.set_gid('x_axis_how2matplotlib')
ax.yaxis.set_gid('y_axis_how2matplotlib')

# 图例
legend = ax.legend()
legend.set_gid('legend_how2matplotlib')

plt.show()
Output:
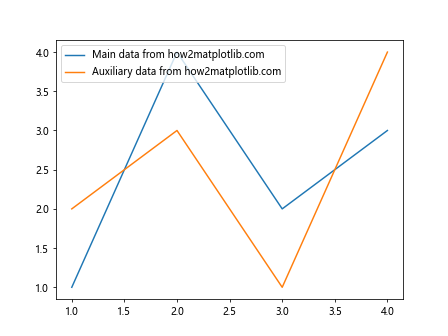
在这个例子中,我们为主要的图形元素设置了有意义的GID,这样可以在后续的操作中轻松地引用和控制这些元素。
5. set_gid()函数与其他Matplotlib功能的结合
set_gid()函数可以与Matplotlib的其他功能结合使用,以创建更复杂和强大的可视化。
5.1 与样式表结合
我们可以将set_gid()与Matplotlib的样式表功能结合使用,以创建可重用的自定义样式:
import matplotlib.pyplot as plt

plt.style.use('seaborn')

fig, ax = plt.subplots()
ax.plot([1, 2, 3, 4], [1, 4, 2, 3], label='Data from how2matplotlib.com')

ax.xaxis.set_gid('x_axis_how2matplotlib')
ax.yaxis.set_gid('y_axis_how2matplotlib')

ax.set_title('Custom styled plot (how2matplotlib.com)')
ax.set_xlabel('X-axis (how2matplotlib.com)')
ax.set_ylabel('Y-axis (how2matplotlib.com)')

plt.show()
在这个例子中,我们使用了’seaborn’样式,并为坐标轴设置了GID。这样,我们就可以在保持整体样式的同时,对特定的坐标轴进行自定义。
5.2 与自定义艺术家对象结合
set_gid()函数不仅可以用于坐标轴,还可以用于自定义的艺术家对象:
import matplotlib.pyplot as plt
import matplotlib.patches as patches

fig, ax = plt.subplots()

circle = patches.Circle((0.5, 0.5), 0.2, fill=False)
circle.set_gid('circle_how2matplotlib')
ax.add_patch(circle)

rectangle = patches.Rectangle((0.2, 0.2), 0.3, 0.4, fill=False)
rectangle.set_gid('rectangle_how2matplotlib')
ax.add_patch(rectangle)

ax.set_xlim(0, 1)
ax.set_ylim(0, 1)
ax.set_aspect('equal')

ax.set_title('Custom shapes with GIDs (how2matplotlib.com)')

plt.show()
Output:
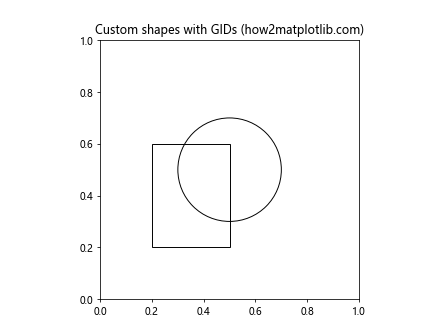
在这个例子中,我们创建了自定义的圆形和矩形对象,并为它们设置了GID。这使得我们可以在后续的操作中精确地控制这些形状。
5.3 在3D图形中使用set_gid()
set_gid()函数也可以在3D图形中使用:
import matplotlib.pyplot as plt
from mpl_toolkits.mplot3d import Axes3D
import numpy as np

fig = plt.figure()
ax = fig.add_subplot(111, projection='3d')

x = np.linspace(-5, 5, 100)
y = np.linspace(-5, 5, 100)
X, Y = np.meshgrid(x, y)
Z = np.sin(np.sqrt(X**2 + Y**2))

surface = ax.plot_surface(X, Y, Z, cmap='viridis')
surface.set_gid('surface_how2matplotlib')

ax.set_xlabel('X-axis (how2matplotlib.com)')
ax.set_ylabel('Y-axis (how2matplotlib.com)')
ax.set_zlabel('Z-axis (how2matplotlib.com)')

ax.xaxis.set_gid('x_axis_3d_how2matplotlib')
ax.yaxis.set_gid('y_axis_3d_how2matplotlib')
ax.zaxis.set_gid('z_axis_3d_how2matplotlib')

plt.show()
Output:
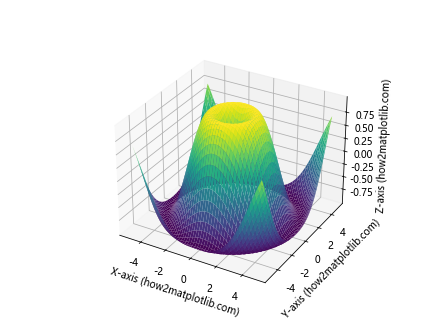
在这个3D图形示例中,我们为表面图和三个坐标轴都设置了GID。这在处理复杂的3D可视化时特别有用。
6. set_gid()函数在实际项目中的应用
在实际的数据可视化项目中,set_gid()函数可以帮助我们创建更加灵活和可维护的图表。以下是一些实际应用的例子:
6.1 创建可交互的仪表板
import matplotlib.pyplot as plt
from matplotlib.backends.backend_tkagg import FigureCanvasTkAgg
import tkinter as tk

def create_dashboard():
    root = tk.Tk()
    root.title('Interactive Dashboard (how2matplotlib.com)')

    fig, (ax1, ax2) = plt.subplots(1, 2, figsize=(10, 5))

    # 第一个子图
    ax1.plot([1, 2, 3, 4], [1, 4, 2, 3], label='Data 1 from how2matplotlib.com')
    ax1.set_title('Chart 1')
    ax1.set_gid('chart1_how2matplotlib')

    # 第二个子图
    ax2.bar(['A', 'B', 'C', 'D'], [3, 1, 4, 2], label='Data 2 from how2matplotlib.com')
    ax2.set_title('Chart 2')
    ax2.set_gid('chart2_how2matplotlib')

    canvas = FigureCanvasTkAgg(fig, master=root)
    canvas.draw()
    canvas.get_tk_widget().pack()

    def on_click(event):
        if event.inaxes:
            gid = event.inaxes.get_gid()
            if gid == 'chart1_how2matplotlib':
                print('Clicked on Chart 1')
            elif gid == 'chart2_how2matplotlib':
                print('Clicked on Chart 2')

    fig.canvas.mpl_connect('button_press_event', on_click)

    root.mainloop()

create_dashboard()
在这个例子中,我们创建了一个简单的交互式仪表板,包含两个图表。通过为每个图表设置GID,我们可以轻松地识别用户点击的是哪个图表。
6.2 创建可自定义的报告生成器
import matplotlib.pyplot as plt
import pandas as pd

def generate_report(data, chart_types):
    fig, axes = plt.subplots(len(chart_types), 1, figsize=(10, 5*len(chart_types)))
    if len(chart_types) == 1:
        axes = [axes]

    for i, (chart_type, ax) in enumerate(zip(chart_types, axes)):
        if chart_type == 'line':
            ax.plot(data['x'], data['y'], label='Line data from how2matplotlib.com')
            ax.set_gid(f'line_chart_{i}_how2matplotlib')
        elif chart_type == 'bar':
            ax.bar(data['x'], data['y'], label='Bar data from how2matplotlib.com')
            ax.set_gid(f'bar_chart_{i}_how2matplotlib')
        elif chart_type == 'scatter':
            ax.scatter(data['x'], data['y'], label='Scatter data from how2matplotlib.com')
            ax.set_gid(f'scatter_chart_{i}_how2matplotlib')

        ax.set_title(f'Chart {i+1}: {chart_type.capitalize()}')
        ax.legend()

    plt.tight_layout()
    plt.savefig('report.png')
    plt.close()

# 示例使用
data = pd.DataFrame({'x': range(1, 6), 'y': [2, 4, 1, 5, 3]})
chart_types = ['line', 'bar', 'scatter']
generate_report(data, chart_types)
这个例子展示了如何创建一个灵活的报告生成器。通过为每个图表设置唯一的GID,我们可以在生成报告后轻松地识别和修改特定的图表。
6.3 创建动态更新的实时数据可视化
import matplotlib.pyplot as plt
import matplotlib.animation as animation
import numpy as np

class RealtimePlot:
    def __init__(self):
        self.fig, self.ax = plt.subplots()
        self.line, = self.ax.plot([], [], lw=2)
        self.ax.set_xlim(0, 100)
        self.ax.set_ylim(-1, 1)
        self.ax.set_title('Real-time Data from how2matplotlib.com')
        self.line.set_gid('realtime_data_how2matplotlib')
        self.xdata, self.ydata = [], []

    def update(self, frame):
        t = frame / 10.0
        y = np.sin(2 * np.pi * t) * np.exp(-t/10.)
        self.xdata.append(frame)
        self.ydata.append(y)
        self.line.set_data(self.xdata, self.ydata)
        return self.line,

    def animate(self):
        anim = animation.FuncAnimation(self.fig, self.update, frames=200,
                                       interval=50, blit=True)
        plt.show()

plot = RealtimePlot()
plot.animate()
Output:

这个例子展示了如何创建一个实时更新的数据可视化。通过为数据线设置GID,我们可以在动画过程中轻松地识别和操作这条线。
7. set_gid()函数的高级技巧
7.1 动态GID生成
在处理大量图形元素时,手动为每个元素设置GID可能会很繁琐。我们可以创建一个函数来动态生成GID:
import matplotlib.pyplot as plt
import uuid

def generate_gid(prefix='element'):
    return f"{prefix}_{uuid.uuid4().hex[:8]}_how2matplotlib"

fig, ax = plt.subplots()

for i in range(5):
    line, = ax.plot([i, i+1], [i, i+1], label=f'Line {i+1}')
    line.set_gid(generate_gid('line'))

ax.set_title('Multiple lines with dynamic GIDs (how2matplotlib.com)')
ax.legend()

plt.show()
Output:
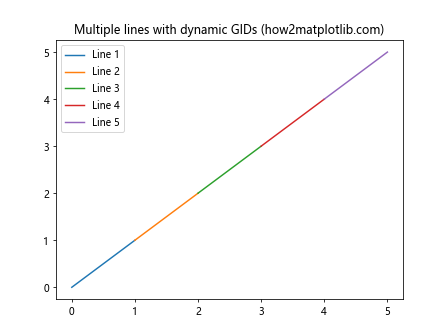
在这个例子中,我们使用uuid模块来生成唯一的GID。这种方法可以确保即使在复杂的图形中,每个元素也有一个唯一的标识符。
7.2 使用GID进行批量样式设置
我们可以利用GID来批量设置具有相同特征的元素的样式:
import matplotlib.pyplot as plt
import re

fig, ax = plt.subplots()

for i in range(3):
    line, = ax.plot([i, i+1], [i, i+1], label=f'Line {i+1}')
    line.set_gid(f'line_{i}_how2matplotlib')

ax.set_title('Lines with different styles (how2matplotlib.com)')
ax.legend()

# 批量设置样式
for artist in ax.get_children():
    if hasattr(artist, 'get_gid'):
        gid = artist.get_gid()
        if gid and re.match(r'line_\d+_how2matplotlib', gid):
            line_number = int(gid.split('_')[1])
            if line_number % 2 == 0:
                artist.set_linestyle('--')
            else:
                artist.set_linestyle(':')

plt.show()
Output:
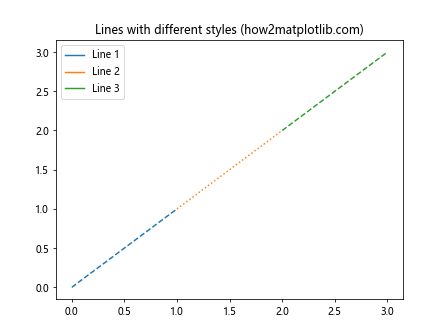
在这个例子中,我们使用正则表达式来匹配特定的GID模式,然后根据线条的编号设置不同的线型。
7.3 使用GID进行图形元素的选择性导出
GID可以用来选择性地导出图形中的特定元素:
import matplotlib.pyplot as plt
import xml.etree.ElementTree as ET

fig, ax = plt.subplots()

line1, = ax.plot([1, 2, 3], [1, 2, 3], label='Line 1')
line1.set_gid('line1_how2matplotlib')

line2, = ax.plot([1, 2, 3], [3, 2, 1], label='Line 2')
line2.set_gid('line2_how2matplotlib')

ax.set_title('Two lines (how2matplotlib.com)')
ax.legend()

# 保存为SVG
plt.savefig('two_lines.svg')

# 解析SVG文件
tree = ET.parse('two_lines.svg')
root = tree.getroot()

# 查找并提取特定GID的元素
for elem in root.iter():
    if 'id' in elem.attrib and elem.attrib['id'] == 'line1_how2matplotlib':
        # 这里可以对找到的元素进行操作,比如修改样式或单独保存
        print("Found line1 element")

plt.show()
Output:
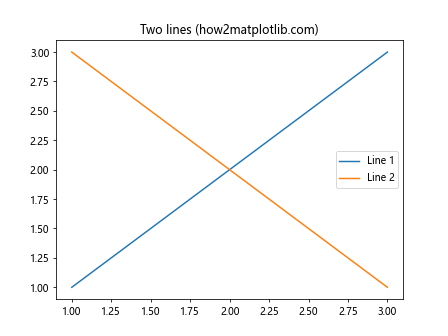
在这个例子中,我们首先将图形保存为SVG格式,然后使用XML解析来查找具有特定GID的元素。这种方法可以用于提取图形中的特定部分,或者在后期处理中修改特定元素的样式。
8. set_gid()函数的最佳实践
在使用set_gid()函数时,以下是一些最佳实践:
- 使用描述性的GID:选择能够清楚描述元素用途的GID名称。例如,
'main_plot_line'比简单的'line1'更有意义。 -
保持一致性:在整个项目中使用一致的GID命名约定。这将使得代码更易于理解和维护。
-
避免重复:确保每个GID都是唯一的。重复的GID可能会导致意外的行为。
-
文档化:在代码注释或文档中记录你使用的GID及其用途。这对于大型项目特别重要。
-
适度使用:不需要为每个元素都设置GID。只为那些需要特别控制或引用的元素设置GID。
-
考虑性能:在处理大量元素时,过度使用GID可能会影响性能。在这种情况下,考虑使用其他方法来组织和管理你的图形元素。
让我们看一个遵循这些最佳实践的例子:
import matplotlib.pyplot as plt

def create_chart(data, chart_type='line'):
    fig, ax = plt.subplots()

    if chart_type == 'line':
        line, = ax.plot(data['x'], data['y'])
        line.set_gid('main_data_line_how2matplotlib')
    elif chart_type == 'scatter':
        scatter = ax.scatter(data['x'], data['y'])
        scatter.set_gid('main_data_scatter_how2matplotlib')

    ax.set_xlabel('X-axis (how2matplotlib.com)')
    ax.set_ylabel('Y-axis (how2matplotlib.com)')
    ax.xaxis.set_gid('x_axis_how2matplotlib')
    ax.yaxis.set_gid('y_axis_how2matplotlib')

    title = ax.set_title(f'{chart_type.capitalize()} Chart (how2matplotlib.com)')
    title.set_gid('chart_title_how2matplotlib')

    return fig, ax

# 使用示例
data = {'x': [1, 2, 3, 4, 5], 'y': [2, 4, 1, 3, 5]}
fig, ax = create_chart(data, 'line')
plt.show()
Output:
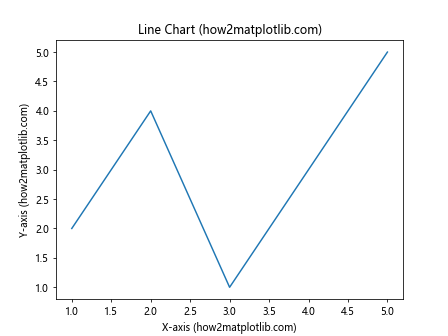
在这个例子中,我们遵循了以下最佳实践:
- 使用描述性的GID,如
'main_data_line_how2matplotlib'。 - 保持一致的命名约定,所有GID都以
'_how2matplotlib'结尾。 - 只为主要元素设置GID,避免过度使用。
- 通过函数参数控制图表类型,使代码更加灵活。
9. 结论
Matplotlib的Axis.set_gid()函数是一个强大的工具,它允许我们为图形元素设置全局唯一的标识符。通过使用GID,我们可以更精确地控制和操作图形中的特定元素,这在创建复杂的可视化、交互式图表和动态更新的图形时特别有用。
本文详细介绍了set_gid()函数的用法、应用场景和高级技巧。我们探讨了如何在多子图、事件处理、动画和3D图形中使用GID,以及如何将GID与其他Matplotlib功能结合使用。我们还讨论了在实际项目中应用GID的方法,如创建交互式仪表板和可自定义的报告生成器。
最后,我们提供了一些使用set_gid()函数的最佳实践,包括使用描述性的GID名称、保持命名一致性、避免重复和适度使用GID等。
通过掌握set_gid()函数及其相关技巧,你可以创建更加灵活、可维护和功能丰富的数据可视化。无论是简单的静态图表还是复杂的交互式可视化,GID都能帮助你更好地组织和控制图形元素,从而提高工作效率和可视化质量。
 极客教程
极客教程