Matplotlib中的axis.Axis.get_path_effects()函数详解与应用
参考:Matplotlib.axis.Axis.get_path_effects() function in Python
Matplotlib是Python中最流行的数据可视化库之一,它提供了丰富的绘图功能和自定义选项。在Matplotlib中,axis.Axis.get_path_effects()函数是一个非常有用的工具,用于获取轴(Axis)对象上应用的路径效果(Path Effects)。本文将深入探讨这个函数的用法、特性以及在实际绘图中的应用。
1. 什么是axis.Axis.get_path_effects()函数?
axis.Axis.get_path_effects()是Matplotlib库中Axis类的一个方法。这个函数的主要作用是返回当前轴对象上应用的路径效果列表。路径效果是一种可以应用于轴标签、刻度标签等元素的视觉效果,可以增强图表的美观性和可读性。
让我们来看一个简单的示例,了解如何使用这个函数:
import matplotlib.pyplot as plt
import matplotlib.patheffects as path_effects

fig, ax = plt.subplots()
ax.set_title("how2matplotlib.com Example")
ax.text(0.5, 0.5, 'Hello, Matplotlib!', ha='center', va='center')

# 获取x轴的路径效果
x_axis_effects = ax.xaxis.get_path_effects()
print("X-axis path effects:", x_axis_effects)

plt.show()
Output:
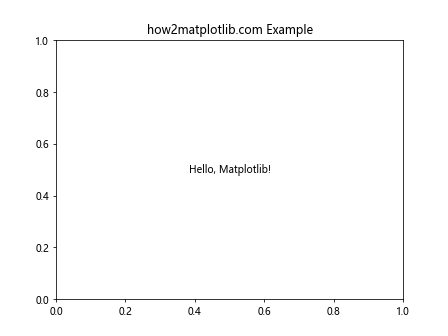
在这个例子中,我们创建了一个简单的图表,并使用get_path_effects()函数获取x轴的路径效果。由于我们没有为x轴设置任何路径效果,所以返回的列表将为空。
2. 路径效果的类型
在深入了解get_path_effects()函数之前,我们需要先了解Matplotlib中常用的路径效果类型。Matplotlib提供了多种路径效果,可以通过matplotlib.patheffects模块访问。以下是一些常见的路径效果:
Normal: 默认效果,不添加任何特殊效果。Stroke: 为文本或线条添加描边效果。withStroke: 结合原始路径和描边效果。SimplePatchShadow: 为对象添加简单的阴影效果。withSimplePatchShadow: 结合原始路径和简单阴影效果。SimpleLineShadow: 为线条添加简单的阴影效果。PathPatchEffect: 使用自定义的补丁(patch)创建效果。
让我们通过一个示例来展示如何应用这些效果:
import matplotlib.pyplot as plt
import matplotlib.patheffects as path_effects

fig, ax = plt.subplots()
ax.set_title("how2matplotlib.com Path Effects")

text = ax.text(0.5, 0.5, 'Hello, Matplotlib!', ha='center', va='center', fontsize=20)
text.set_path_effects([path_effects.withStroke(linewidth=3, foreground='red')])

# 获取文本对象的路径效果
text_effects = text.get_path_effects()
print("Text path effects:", text_effects)

plt.show()
Output:

在这个例子中,我们为文本添加了一个红色的描边效果,并使用get_path_effects()函数获取应用的效果。
3. 使用get_path_effects()函数
现在,让我们更深入地探讨get_path_effects()函数的使用方法和特性。
3.1 基本用法
get_path_effects()函数的基本用法非常简单。你只需要在想要查询的轴对象上调用这个方法即可。例如:
import matplotlib.pyplot as plt
import matplotlib.patheffects as path_effects

fig, ax = plt.subplots()
ax.set_title("how2matplotlib.com Basic Usage")

# 为x轴标签添加路径效果
ax.xaxis.label.set_path_effects([path_effects.Stroke(linewidth=3, foreground='blue'),
                                 path_effects.Normal()])

# 获取x轴标签的路径效果
x_label_effects = ax.xaxis.label.get_path_effects()
print("X-axis label path effects:", x_label_effects)

plt.show()
Output:
在这个例子中,我们为x轴标签添加了一个蓝色描边效果,然后使用get_path_effects()函数获取应用的效果。
3.2 获取不同元素的路径效果
get_path_effects()函数可以用于获取图表中各种元素的路径效果,包括轴标签、刻度标签、标题等。以下是一个综合示例:
import matplotlib.pyplot as plt
import matplotlib.patheffects as path_effects

fig, ax = plt.subplots()
ax.set_title("how2matplotlib.com Different Elements", path_effects=[path_effects.withStroke(linewidth=2, foreground='green')])

# 为x轴标签添加效果
ax.xaxis.label.set_path_effects([path_effects.Stroke(linewidth=3, foreground='red')])

# 为y轴刻度标签添加效果
for label in ax.yaxis.get_ticklabels():
    label.set_path_effects([path_effects.withSimplePatchShadow()])

# 获取各元素的路径效果
title_effects = ax.title.get_path_effects()
x_label_effects = ax.xaxis.label.get_path_effects()
y_tick_effects = ax.yaxis.get_ticklabels()[0].get_path_effects()

print("Title effects:", title_effects)
print("X-axis label effects:", x_label_effects)
print("Y-axis tick label effects:", y_tick_effects)

plt.show()
Output:
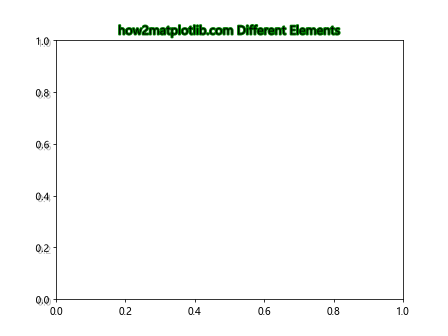
这个例子展示了如何为不同的图表元素添加路径效果,并使用get_path_effects()函数获取这些效果。
3.3 处理多个路径效果
有时,我们可能会为一个元素应用多个路径效果。get_path_effects()函数会返回一个包含所有应用效果的列表。例如:
import matplotlib.pyplot as plt
import matplotlib.patheffects as path_effects

fig, ax = plt.subplots()
ax.set_title("how2matplotlib.com Multiple Effects")

text = ax.text(0.5, 0.5, 'Multiple Effects', ha='center', va='center', fontsize=20)
text.set_path_effects([
    path_effects.Stroke(linewidth=3, foreground='red'),
    path_effects.Normal(),
    path_effects.withSimplePatchShadow(offset=(2, -2), shadow_rgbFace='blue', alpha=0.6)
])

# 获取文本对象的路径效果
text_effects = text.get_path_effects()
print("Text path effects:", text_effects)
print("Number of effects:", len(text_effects))

plt.show()
Output:
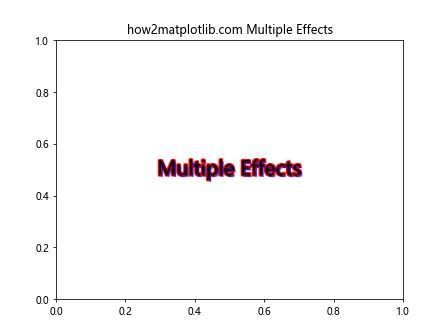
在这个例子中,我们为文本应用了多个路径效果,包括描边、正常渲染和阴影效果。使用get_path_effects()函数可以获取所有应用的效果。
4. 实际应用场景
了解了get_path_effects()函数的基本用法后,让我们探讨一些实际的应用场景,看看这个函数如何在实际绘图中发挥作用。
4.1 动态调整路径效果
在某些情况下,你可能需要根据数据或用户输入动态调整路径效果。get_path_effects()函数可以帮助你获取当前的效果,然后进行修改。例如:
import matplotlib.pyplot as plt
import matplotlib.patheffects as path_effects

def update_effect(color):
    current_effects = ax.title.get_path_effects()
    if current_effects:
        new_effect = path_effects.Stroke(linewidth=3, foreground=color)
        ax.title.set_path_effects([new_effect, path_effects.Normal()])
    else:
        ax.title.set_path_effects([path_effects.Stroke(linewidth=3, foreground=color),
                                   path_effects.Normal()])
    plt.draw()

fig, ax = plt.subplots()
ax.set_title("how2matplotlib.com Dynamic Effects")

update_effect('red')
print("Initial effects:", ax.title.get_path_effects())

# 模拟用户交互
update_effect('blue')
print("Updated effects:", ax.title.get_path_effects())

plt.show()
Output:
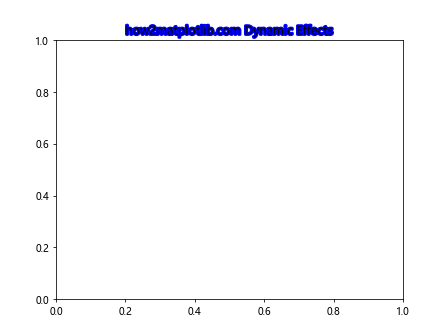
这个例子展示了如何使用get_path_effects()函数来检查当前的效果,并根据需要进行更新。
4.2 复制和转移路径效果
有时,你可能想要将一个元素的路径效果复制到另一个元素上。get_path_effects()函数可以帮助你实现这一点:
import matplotlib.pyplot as plt
import matplotlib.patheffects as path_effects

fig, (ax1, ax2) = plt.subplots(1, 2, figsize=(10, 4))
fig.suptitle("how2matplotlib.com Copy Effects")

# 为第一个子图的标题添加效果
ax1.set_title("Source", path_effects=[path_effects.withStroke(linewidth=3, foreground='red')])

# 获取第一个子图标题的路径效果
source_effects = ax1.title.get_path_effects()

# 将效果应用到第二个子图的标题
ax2.set_title("Destination")
ax2.title.set_path_effects(source_effects)

print("Source effects:", source_effects)
print("Destination effects:", ax2.title.get_path_effects())

plt.show()
Output:
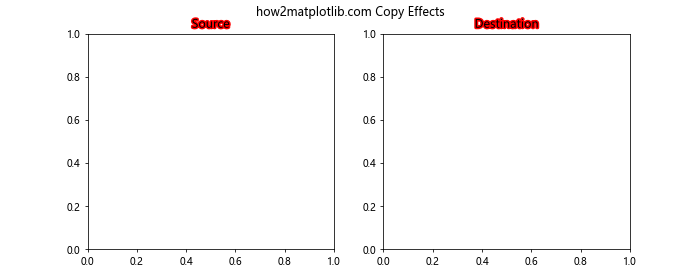
这个例子展示了如何使用get_path_effects()函数获取一个元素的路径效果,并将其应用到另一个元素上。
4.3 路径效果的条件应用
在某些情况下,你可能想要根据某些条件来决定是否应用路径效果。get_path_effects()函数可以帮助你检查当前是否已经应用了效果:
import matplotlib.pyplot as plt
import matplotlib.patheffects as path_effects
import numpy as np

fig, ax = plt.subplots()
ax.set_title("how2matplotlib.com Conditional Effects")

x = np.linspace(0, 10, 100)
y = np.sin(x)

line, = ax.plot(x, y, label='Sine Wave')

# 条件应用路径效果
if not line.get_path_effects():
    line.set_path_effects([path_effects.SimpleLineShadow(), path_effects.Normal()])

print("Line path effects:", line.get_path_effects())

plt.legend()
plt.show()
Output:
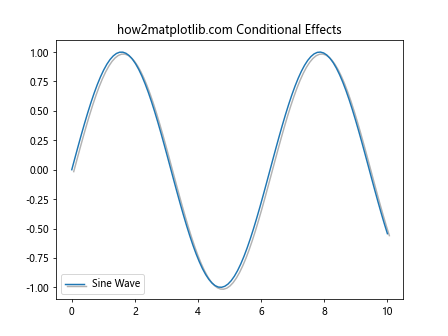
这个例子展示了如何使用get_path_effects()函数来检查是否已经应用了路径效果,并在需要时添加效果。
5. 高级技巧和注意事项
在使用get_path_effects()函数时,有一些高级技巧和注意事项需要了解:
5.1 自定义路径效果
Matplotlib允许你创建自定义的路径效果。在这种情况下,get_path_effects()函数将返回你自定义的效果对象:
import matplotlib.pyplot as plt
import matplotlib.patheffects as path_effects

class CustomEffect(path_effects.AbstractPathEffect):
    def __init__(self, offset=(1, 1), **kwargs):
        super().__init__(**kwargs)
        self._offset = offset

    def draw_path(self, renderer, gc, tpath, affine, rgbFace):
        offset_path = tpath.transformed(affine.translate(self._offset[0], self._offset[1]))
        renderer.draw_path(gc, offset_path, affine, rgbFace)

fig, ax = plt.subplots()
ax.set_title("how2matplotlib.com Custom Effect")

text = ax.text(0.5, 0.5, 'Custom Effect', ha='center', va='center', fontsize=20)
text.set_path_effects([CustomEffect(offset=(3, 3)), path_effects.Normal()])

# 获取文本对象的路径效果
text_effects = text.get_path_effects()
print("Text path effects:", text_effects)

plt.show()
Output:
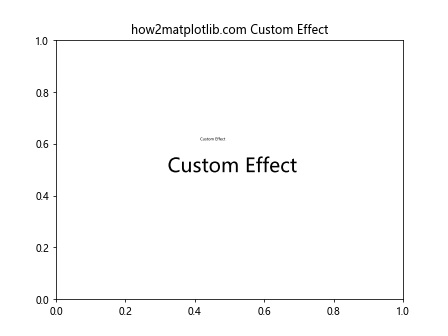
在这个例子中,我们创建了一个自定义的路径效果,并使用get_path_effects()函数获取应用的效果。
5.2 路径效果的性能考虑
虽然路径效果可以大大增强图表的视觉效果,但过度使用可能会影响渲染性能。使用get_path_effects()函数可以帮助你审查和管理应用的效果:
import matplotlib.pyplot as plt
import matplotlib.patheffects as path_effects

fig, ax = plt.subplots()
ax.set_title("how2matplotlib.com Performance Consideration")

# 添加多个文本对象,每个都有路径效果
for i in range(100):
    text = ax.text(i/100, i/100, f'Text {i}', fontsize=8)
    text.set_path_effects([path_effects.withStroke(linewidth=2, foreground='red')])

# 检查应用的效果数量
total_effects = sum(len(text.get_path_effects()) for text in ax.texts)
print(f"Total number of path effects: {total_effects}")

plt.show()
Output:
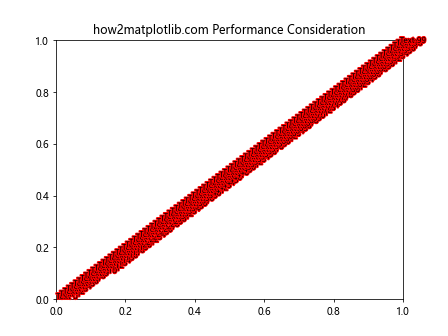
这个例子展示了如何使用get_path_effects()函数来统计应用的路径效果总数,这可以帮助你评估潜在的性能影响。
5.3 路径效果的动画
在创建动画时,你可能需要动态更改路径效果。get_path_effects()函数可以帮助你实现这一点:
import matplotlib.pyplot as plt
import matplotlib.patheffects as path_effects
import matplotlib.animation as animation

fig, ax = plt.subplots()
ax.set_title("how2matplotlib.com Animated Effects")

text = ax.text(0.5, 0.5, 'Animated Text', ha='center', va='center', fontsize=20)

def animate(frame):
    current_effects = text.get_path_effects()
    if current_effects:
        new_effect = path_effects.withStroke(linewidth=frame, foreground='red')
        text.set_path_effects([new_effect, path_effects.Normal()])
    else:
        text.set_path_effects([path_effects.withStroke(linewidth=frame, foreground='red'),
                               path_effects.Normal()])
    return text,

ani = animation.FuncAnimation(fig, animate, frames=range(1, 6), interval=500, blit=True)

plt.show()
Output:

这个例子展示了如何在动画中使用get_path_effects()函数来动态更新文本的路径效果。
6. 常见问题和解决方案
在使用get_path_effects()函数时,你可能会遇到一些常见问题。让我们来看看这些问题及其解决方案:
6.1 返回空列表
有时,get_path_effects()函数可能会返回一个空列表。这通常意味着该元素没有应用任何路径效果。例如:
import matplotlib.pyplot as plt

fig, ax = plt.subplots()
ax.set_title("how2matplotlib.com Empty Effects")

# 获取x轴的路径效果
x_axis_effects = ax.xaxis.get_path_effects()
print("X-axis path effects:", x_axis_effects)

if not x_axis_effects:
    print("No path effects applied to the x-axis.")

plt.show()
Output:
在这个例子中,我们检查了x轴是否有应用的路径效果。如果返回空列表,我们打印一条消息说明没有应用效果。
6.2 效果不可见
有时,你可能已经应用了路径效果,但在图表中看不到效果。这可能是因为效果的参数设置不当。使用get_path_effects()函数可以帮助你检查应用的效果:
import matplotlib.pyplot as plt
import matplotlib.patheffects as path_effects

fig, ax = plt.subplots()
ax.set_title("how2matplotlib.com Invisible Effects")

text = ax.text(0.5, 0.5, 'Invisible Effect?', ha='center', va='center', fontsize=20)
text.set_path_effects([path_effects.withStroke(linewidth=0, foreground='red')])

# 检查应用的效果
text_effects = text.get_path_effects()
print("Applied effects:", text_effects)

if text_effects:
    print("Effect parameters:")
    for effect in text_effects:
        if isinstance(effect, path_effects.withStroke):
            print(f"Linewidth: {effect._linewidth}")
            print(f"Foreground color: {effect._foreground}")

plt.show()
在这个例子中,我们应用了一个描边效果,但将线宽设置为0,导致效果不可见。通过检查效果的参数,我们可以发现问题所在。
6.3 效果叠加顺序问题
当应用多个路径效果时,效果的叠加顺序很重要。get_path_effects()函数返回的列表反映了效果的应用顺序:
import matplotlib.pyplot as plt
import matplotlib.patheffects as path_effects

fig, ax = plt.subplots()
ax.set_title("how2matplotlib.com Effect Order")

text = ax.text(0.5, 0.5, 'Effect Order', ha='center', va='center', fontsize=20)
text.set_path_effects([
    path_effects.Stroke(linewidth=5, foreground='blue'),
    path_effects.Normal(),
    path_effects.Stroke(linewidth=2, foreground='red')
])

# 检查效果顺序
text_effects = text.get_path_effects()
print("Effect order:")
for i, effect in enumerate(text_effects):
    print(f"{i+1}. {effect}")

plt.show()
Output:
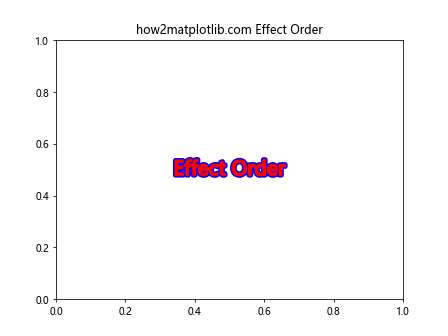
这个例子展示了如何使用get_path_effects()函数来检查路径效果的应用顺序,这可以帮助你理解和调整效果的叠加方式。
7. 与其他Matplotlib功能的集成
get_path_effects()函数可以与Matplotlib的其他功能无缝集成,增强你的数据可视化能力。
7.1 与样式表结合使用
Matplotlib的样式表功能允许你定义和应用预设的绘图样式。你可以在样式表中定义路径效果,然后使用get_path_effects()函数来检查应用的效果:
import matplotlib.pyplot as plt
import matplotlib.patheffects as path_effects

# 定义自定义样式
plt.style.use({
    'axes.titlecolor': 'darkblue',
    'axes.titlepatheffects': [path_effects.withStroke(linewidth=2, foreground='skyblue')]
})

fig, ax = plt.subplots()
ax.set_title("how2matplotlib.com Style Integration")

# 检查标题的路径效果
title_effects = ax.title.get_path_effects()
print("Title path effects:", title_effects)

plt.show()
这个例子展示了如何在样式表中定义路径效果,并使用get_path_effects()函数来验证效果是否正确应用。
7.2 在子图中使用
当使用多个子图时,get_path_effects()函数可以帮助你管理和同步不同子图的路径效果:
import matplotlib.pyplot as plt
import matplotlib.patheffects as path_effects

fig, (ax1, ax2) = plt.subplots(1, 2, figsize=(10, 4))
fig.suptitle("how2matplotlib.com Subplots")

# 为第一个子图设置效果
ax1.set_title("Subplot 1", path_effects=[path_effects.withStroke(linewidth=3, foreground='red')])

# 获取第一个子图的效果并应用到第二个子图
subplot1_effects = ax1.title.get_path_effects()
ax2.set_title("Subplot 2")
ax2.title.set_path_effects(subplot1_effects)

print("Subplot 1 effects:", ax1.title.get_path_effects())
print("Subplot 2 effects:", ax2.title.get_path_effects())

plt.show()
Output:
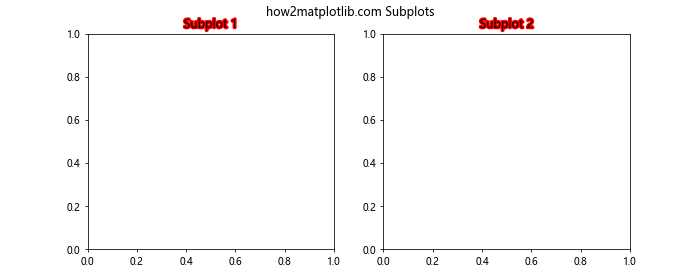
这个例子展示了如何使用get_path_effects()函数来同步多个子图的路径效果。
7.3 与图例结合使用
get_path_effects()函数也可以用于管理图例中的路径效果:
import matplotlib.pyplot as plt
import matplotlib.patheffects as path_effects
import numpy as np

fig, ax = plt.subplots()
ax.set_title("how2matplotlib.com Legend Integration")

x = np.linspace(0, 10, 100)
ax.plot(x, np.sin(x), label='Sine')
ax.plot(x, np.cos(x), label='Cosine')

legend = ax.legend()
legend.get_frame().set_path_effects([path_effects.withSimplePatchShadow()])

# 检查图例框的路径效果
legend_effects = legend.get_frame().get_path_effects()
print("Legend frame effects:", legend_effects)

plt.show()
Output:
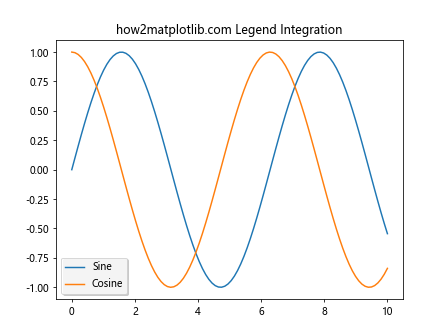
这个例子展示了如何为图例框添加路径效果,并使用get_path_effects()函数来验证应用的效果。
8. 总结
axis.Axis.get_path_effects()函数是Matplotlib中一个强大而灵活的工具,它允许你获取和管理轴对象上应用的路径效果。通过本文的详细介绍和丰富的示例,我们探讨了这个函数的各种用法、特性以及在实际绘图中的应用。
从基本用法到高级技巧,从常见问题的解决到与其他Matplotlib功能的集成,我们全面地覆盖了get_path_effects()函数的方方面面。这个函数不仅可以帮助你检查和调试路径效果,还可以在动态更新、效果复制和条件应用等场景中发挥重要作用。
在实际的数据可视化项目中,合理使用路径效果可以显著提升图表的视觉吸引力和可读性。而get_path_effects()函数则为你提供了一个便捷的方式来管理这些效果,确保你的图表既美观又高效。
通过掌握get_path_effects()函数及其相关技巧,你将能够更加灵活和精确地控制Matplotlib图表中的视觉效果,创造出更加专业和吸引人的数据可视化作品。
 极客教程
极客教程