Matplotlib中的Axis.get_minor_locator()函数:轻松获取次要刻度定位器
参考:Matplotlib.axis.Axis.get_minor_locator() function in Python
Matplotlib是Python中最流行的数据可视化库之一,它提供了丰富的绘图功能和自定义选项。在绘制图表时,刻度是一个非常重要的元素,它们帮助读者理解数据的范围和分布。Matplotlib中的Axis.get_minor_locator()函数是一个强大的工具,用于获取坐标轴的次要刻度定位器。本文将深入探讨这个函数的用法、特性以及在实际绘图中的应用。
1. 什么是次要刻度定位器?
在Matplotlib中,刻度分为主要刻度和次要刻度。主要刻度通常更加突出,并带有刻度标签,而次要刻度则更加细小,通常不带标签。次要刻度定位器是负责确定次要刻度位置的对象。
使用次要刻度可以增加图表的精确度和可读性,特别是在处理大范围数据或需要更精细刻度划分的情况下。
让我们看一个简单的例子,展示主要刻度和次要刻度的区别:
import matplotlib.pyplot as plt
import numpy as np

fig, ax = plt.subplots(figsize=(10, 6))

x = np.linspace(0, 10, 100)
y = np.sin(x)

ax.plot(x, y, label='sin(x)')
ax.set_xlabel('X axis - how2matplotlib.com')
ax.set_ylabel('Y axis - how2matplotlib.com')
ax.set_title('Example of Major and Minor Ticks - how2matplotlib.com')

ax.minorticks_on()

plt.legend()
plt.show()
Output:
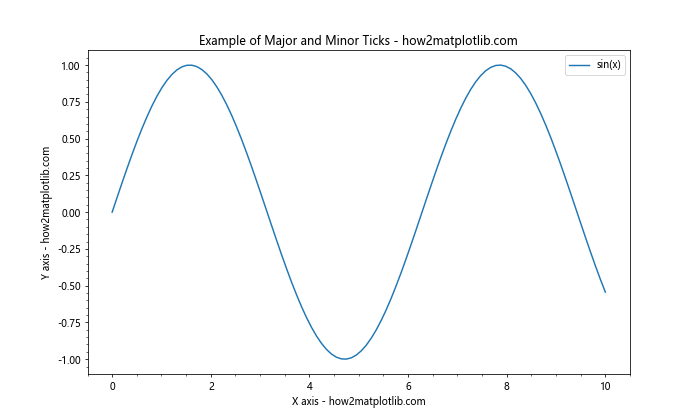
在这个例子中,我们绘制了一个简单的正弦函数图。通过调用ax.minorticks_on(),我们启用了次要刻度。你会注意到x轴和y轴上出现了更小的刻度线,这些就是次要刻度。
2. Axis.get_minor_locator()函数的基本用法
Axis.get_minor_locator()函数是Matplotlib中Axis类的一个方法,用于获取当前轴的次要刻度定位器。这个函数不需要任何参数,它simply返回当前设置的次要刻度定位器对象。
让我们看一个基本的例子:
import matplotlib.pyplot as plt
import numpy as np

fig, ax = plt.subplots(figsize=(10, 6))

x = np.linspace(0, 10, 100)
y = np.sin(x)

ax.plot(x, y)
ax.set_title('Getting Minor Locator - how2matplotlib.com')

minor_locator = ax.xaxis.get_minor_locator()
print(f"Current minor locator: {minor_locator}")

plt.show()
Output:
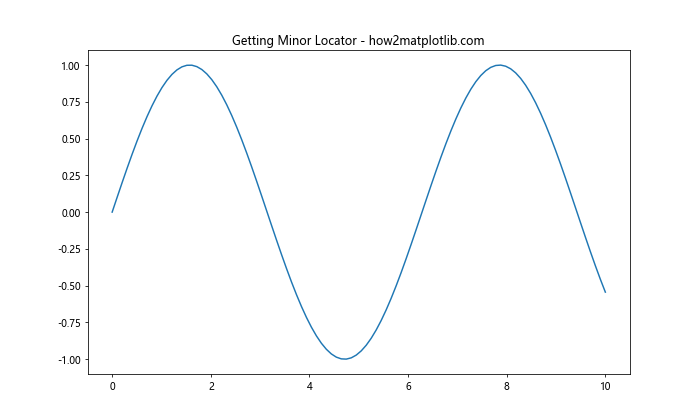
在这个例子中,我们首先创建了一个简单的图表。然后,我们使用ax.xaxis.get_minor_locator()获取x轴的次要刻度定位器。默认情况下,Matplotlib使用AutoMinorLocator作为次要刻度定位器。
3. 常见的次要刻度定位器类型
Matplotlib提供了多种类型的刻度定位器,既可以用于主要刻度,也可以用于次要刻度。以下是一些常见的次要刻度定位器:
- AutoMinorLocator:自动确定次要刻度的位置
- MultipleLocator:按固定间隔设置刻度
- LogLocator:对数刻度定位器
- FixedLocator:手动指定刻度位置
让我们逐一探讨这些定位器的使用方法。
3.1 AutoMinorLocator
AutoMinorLocator是Matplotlib中最常用的次要刻度定位器。它会根据主要刻度的间隔自动确定合适的次要刻度位置。
import matplotlib.pyplot as plt
import numpy as np
from matplotlib.ticker import AutoMinorLocator

fig, ax = plt.subplots(figsize=(10, 6))

x = np.linspace(0, 10, 100)
y = np.sin(x)

ax.plot(x, y)
ax.set_title('AutoMinorLocator Example - how2matplotlib.com')

ax.xaxis.set_minor_locator(AutoMinorLocator())
ax.yaxis.set_minor_locator(AutoMinorLocator())

plt.show()
Output:
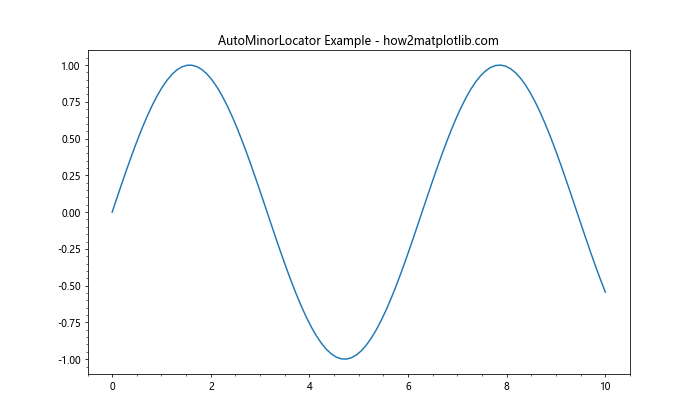
在这个例子中,我们使用AutoMinorLocator()为x轴和y轴设置了自动次要刻度定位器。你会注意到,Matplotlib自动在主要刻度之间添加了适当数量的次要刻度。
3.2 MultipleLocator
MultipleLocator允许你按固定间隔设置刻度。这在你需要精确控制刻度间隔时非常有用。
import matplotlib.pyplot as plt
import numpy as np
from matplotlib.ticker import MultipleLocator

fig, ax = plt.subplots(figsize=(10, 6))

x = np.linspace(0, 10, 100)
y = np.sin(x)

ax.plot(x, y)
ax.set_title('MultipleLocator Example - how2matplotlib.com')

ax.xaxis.set_minor_locator(MultipleLocator(0.5))
ax.yaxis.set_minor_locator(MultipleLocator(0.1))

plt.show()
Output:
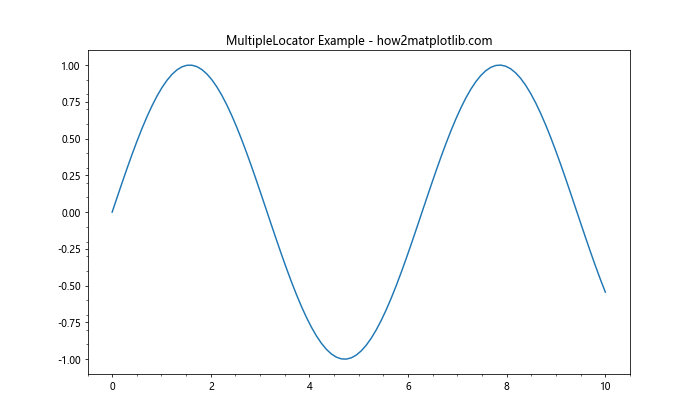
在这个例子中,我们使用MultipleLocator(0.5)为x轴设置了间隔为0.5的次要刻度,使用MultipleLocator(0.1)为y轴设置了间隔为0.1的次要刻度。
3.3 LogLocator
当你处理跨越多个数量级的数据时,LogLocator非常有用。它可以在对数刻度上均匀分布刻度。
import matplotlib.pyplot as plt
import numpy as np
from matplotlib.ticker import LogLocator

fig, ax = plt.subplots(figsize=(10, 6))

x = np.logspace(0, 3, 100)
y = x**2

ax.loglog(x, y)
ax.set_title('LogLocator Example - how2matplotlib.com')

ax.xaxis.set_minor_locator(LogLocator(subs=(2, 3, 4, 5, 6, 7, 8, 9)))
ax.yaxis.set_minor_locator(LogLocator(subs=(2, 3, 4, 5, 6, 7, 8, 9)))

plt.show()
Output:
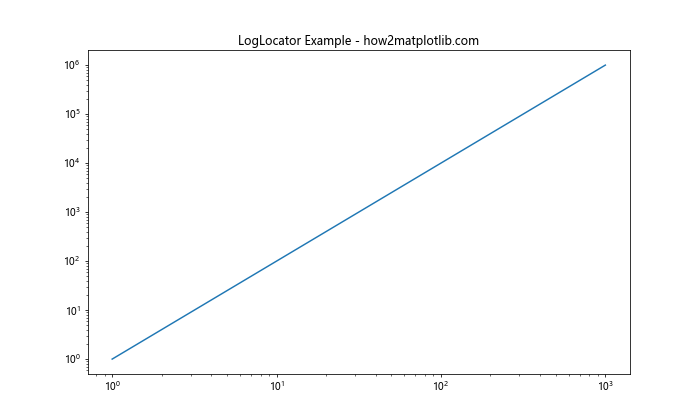
在这个例子中,我们使用LogLocator为对数刻度的x轴和y轴设置次要刻度。subs参数指定了在每个主要刻度之间应该放置哪些次要刻度。
3.4 FixedLocator
如果你需要在特定位置放置次要刻度,FixedLocator是一个很好的选择。它允许你手动指定刻度的确切位置。
import matplotlib.pyplot as plt
import numpy as np
from matplotlib.ticker import FixedLocator

fig, ax = plt.subplots(figsize=(10, 6))

x = np.linspace(0, 10, 100)
y = np.sin(x)

ax.plot(x, y)
ax.set_title('FixedLocator Example - how2matplotlib.com')

minor_ticks = [0.5, 1.5, 2.5, 3.5, 4.5, 5.5, 6.5, 7.5, 8.5, 9.5]
ax.xaxis.set_minor_locator(FixedLocator(minor_ticks))

plt.show()
Output:
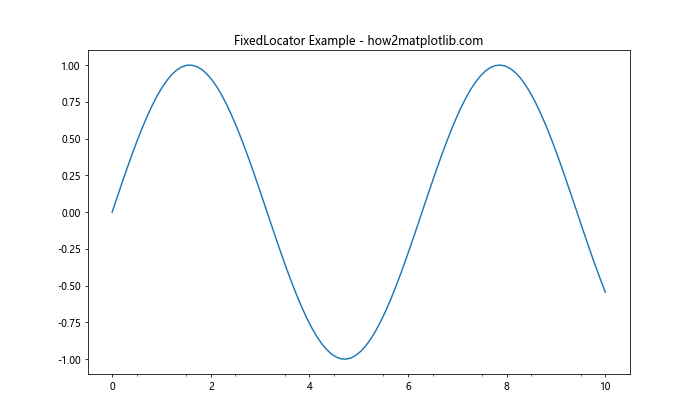
在这个例子中,我们使用FixedLocator在x轴上的特定位置设置了次要刻度。
4. 获取和修改次要刻度定位器
get_minor_locator()函数不仅可以用来获取当前的次要刻度定位器,还可以与其他方法结合使用,以检查和修改次要刻度的设置。
4.1 检查当前的次要刻度定位器
import matplotlib.pyplot as plt
import numpy as np

fig, ax = plt.subplots(figsize=(10, 6))

x = np.linspace(0, 10, 100)
y = np.sin(x)

ax.plot(x, y)
ax.set_title('Checking Current Minor Locator - how2matplotlib.com')

current_locator = ax.xaxis.get_minor_locator()
print(f"Current minor locator: {current_locator}")

plt.show()
Output:
这个例子展示了如何获取并打印当前的次要刻度定位器。
4.2 修改次要刻度定位器的参数
有时,你可能想要修改现有次要刻度定位器的参数,而不是完全替换它。以下是一个例子:
import matplotlib.pyplot as plt
import numpy as np
from matplotlib.ticker import AutoMinorLocator

fig, ax = plt.subplots(figsize=(10, 6))

x = np.linspace(0, 10, 100)
y = np.sin(x)

ax.plot(x, y)
ax.set_title('Modifying Minor Locator Parameters - how2matplotlib.com')

# 获取当前的次要刻度定位器
current_locator = ax.xaxis.get_minor_locator()

# 如果是AutoMinorLocator,修改其参数
if isinstance(current_locator, AutoMinorLocator):
    new_locator = AutoMinorLocator(n=2)  # 在每个主要刻度之间放置2个次要刻度
    ax.xaxis.set_minor_locator(new_locator)

plt.show()
Output:
在这个例子中,我们首先获取当前的次要刻度定位器,然后检查它是否是AutoMinorLocator。如果是,我们创建一个新的AutoMinorLocator实例,并设置它在每个主要刻度之间放置2个次要刻度。
5. 结合get_minor_locator()和其他轴方法
get_minor_locator()函数通常与其他轴方法结合使用,以实现更复杂的刻度定制。
5.1 结合get_minor_formatter()
除了定位器,Matplotlib还使用格式化器来控制刻度标签的显示方式。以下是一个结合使用get_minor_locator()和get_minor_formatter()的例子:
import matplotlib.pyplot as plt
import numpy as np
from matplotlib.ticker import AutoMinorLocator, FormatStrFormatter

fig, ax = plt.subplots(figsize=(10, 6))

x = np.linspace(0, 10, 100)
y = np.sin(x)

ax.plot(x, y)
ax.set_title('Combining Locator and Formatter - how2matplotlib.com')

# 设置次要刻度定位器
ax.xaxis.set_minor_locator(AutoMinorLocator(2))

# 获取并打印次要刻度定位器和格式化器
minor_locator = ax.xaxis.get_minor_locator()
minor_formatter = ax.xaxis.get_minor_formatter()

print(f"Minor locator: {minor_locator}")
print(f"Minor formatter: {minor_formatter}")

# 设置次要刻度格式化器
ax.xaxis.set_minor_formatter(FormatStrFormatter('%.2f'))

plt.show()
Output:
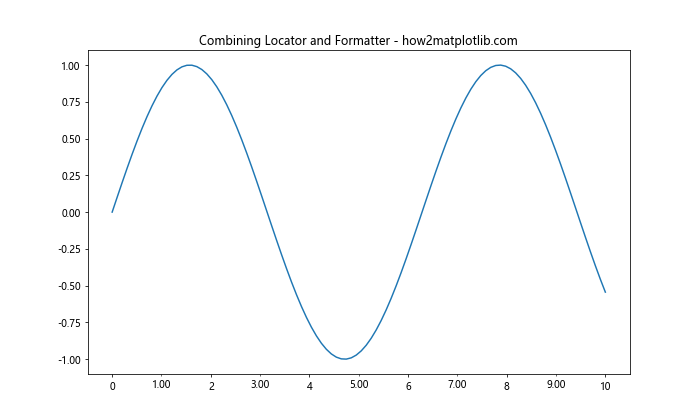
在这个例子中,我们不仅设置了次要刻度定位器,还设置了次要刻度格式化器。我们使用get_minor_locator()和get_minor_formatter()来获取并打印当前的设置。
5.2 结合get_minor_ticks()
get_minor_ticks()方法返回一个包含所有次要刻度对象的列表。我们可以结合get_minor_locator()来检查和修改这些刻度。
import matplotlib.pyplot as plt
import numpy as np
from matplotlib.ticker import AutoMinorLocator

fig, ax = plt.subplots(figsize=(10, 6))

x = np.linspace(0, 10, 100)
y = np.sin(x)

ax.plot(x, y)
ax.set_title('Working with Minor Ticks - how2matplotlib.com')

# 设置次要刻度定位器
ax.xaxis.set_minor_locator(AutoMinorLocator(2))

# 获取次要刻度定位器和刻度
minor_locator = ax.xaxis.get_minor_locator()
minor_ticks = ax.xaxis.get_minor_ticks()

print(f"Minor locator: {minor_locator}")
print(f"Number of minor ticks: {len(minor_ticks)}")

# 修改次要刻度的属性
for tick in minor_ticks:
    tick.tick1line.set_markersize(15)
    tick.tick1line.set_markeredgewidth(2)

plt.show()
Output:
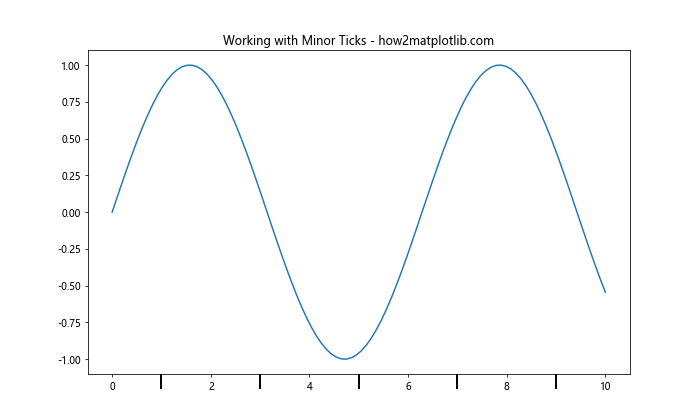
在这个例子中,我们首先设置了次要刻度定位器,然后使用get_minor_locator()和get_minor_ticks()获取定位器和刻度对象。我们打印了定位器信息和次要刻度的数量,然后修改了每个次要刻度的大小和宽度。
6. 在不同类型的图表中使用get_minor_locator()
get_minor_locator()函数可以在各种类型的图表中使用,包括线图、散点图、柱状图等。让我们看一些例子。
6.1 在散点图中使用
import matplotlib.pyplot as plt
import numpy as np
from matplotlib.ticker import MultipleLocator

fig, ax = plt.subplots(figsize=(10, 6))

x = np.random.rand(50) * 10
y = np.random.rand(50) * 10

ax.scatter(x, y)
ax.set_title('Using get_minor_locator() in Scatter Plot - how2matplotlib.com')

# 设置次要刻度定位器
ax.xaxis.set_minor_locator(MultipleLocator(0.5))
ax.yaxis.set_minor_locator(MultipleLocator(0.5))

# 获取并打印次要刻度定位器
x_minor_locator = ax.xaxis.get_minor_locator()
y_minor_locator = ax.yaxis.get_minor_locator()

print(f"X-axis minor locator: {x_minor_locator}")
print(f"Y-axis minor locator: {y_minor_locator}")

plt.show()
Output:
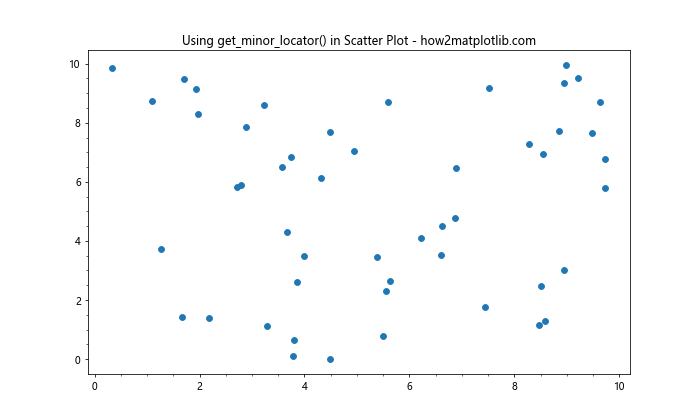
在这个散点图例子中,我们为x轴和y轴设置了间隔为0.5的次要刻度,然后使用get_minor_locator()获取并打印了这些定位器。
6.2 在柱状图中使用
import matplotlib.pyplot as plt
import numpy as np
from matplotlib.ticker import AutoMinorLocator

fig, ax = plt.subplots(figsize=(10, 6))

categories = ['A', 'B', 'C', 'D', 'E']
values = np.random.rand(5) * 10

ax.bar(categories, values)
ax.set_title('Using get_minor_locator() in Bar Chart - how2matplotlib.com')

# 设置y轴次要刻度定位器
ax.yaxis.set_minor_locator(AutoMinorLocator())

# 获取并打印y轴次要刻度定位器
y_minor_locator = ax.yaxis.get_minor_locator()
print(f"Y-axis minor locator: {y_minor_locator}")

plt.show()
Output:
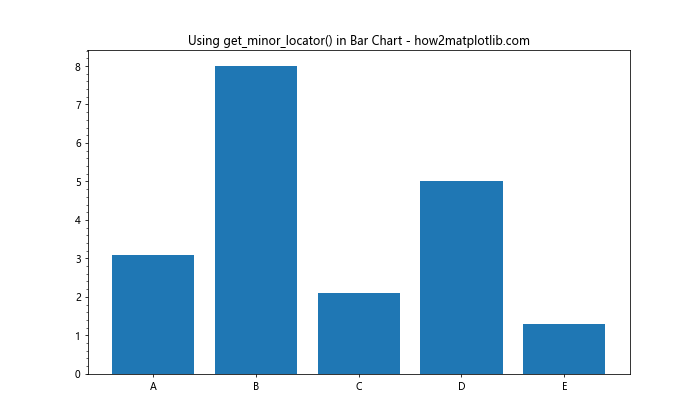
在这个柱状图例子中,我们为y轴设置了自动次要刻度定位器,然后使用get_minor_locator()获取并打印了这个定位器。
7. 自定义次要刻度定位器
虽然Matplotlib提供了多种内置的刻度定位器,但有时你可能需要创建自定义的定位器来满足特定需求。你可以通过继承matplotlib.ticker.Locator类来创建自己的定位器。
以下是一个创建自定义次要刻度定位器的例子:
import matplotlib.pyplot as plt
import numpy as np
from matplotlib.ticker import Locator

class CustomMinorLocator(Locator):
    def __init__(self, num_minors):
        self.num_minors = num_minors

    def __call__(self):
        """Return the locations of the ticks."""
        vmin, vmax = self.axis.get_view_interval()
        return np.linspace(vmin, vmax, self.num_minors)

fig, ax = plt.subplots(figsize=(10, 6))

x = np.linspace(0, 10, 100)
y = np.sin(x)

ax.plot(x, y)
ax.set_title('Custom Minor Locator - how2matplotlib.com')

# 设置自定义次要刻度定位器
ax.xaxis.set_minor_locator(CustomMinorLocator(20))

# 获取并打印次要刻度定位器
minor_locator = ax.xaxis.get_minor_locator()
print(f"Custom minor locator: {minor_locator}")

plt.show()
Output:
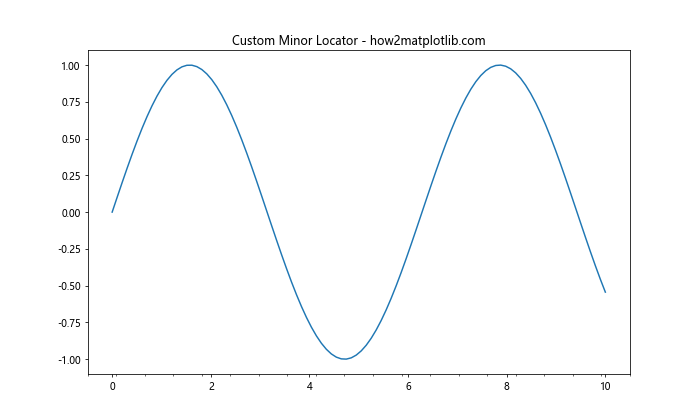
在这个例子中,我们创建了一个名为CustomMinorLocator的自定义定位器,它在给定的视图间隔内均匀分布指定数量的刻度。我们将这个自定义定位器应用到x轴,然后使用get_minor_locator()获取并打印它。
8. 处理日期和时间刻度
当处理日期和时间数据时,Matplotlib提供了专门的定位器和格式化器。get_minor_locator()函数同样适用于这些特殊的定位器。
import matplotlib.pyplot as plt
import numpy as np
from matplotlib.dates import DateFormatter, AutoDateLocator, AutoMinorLocator
from datetime import datetime, timedelta

fig, ax = plt.subplots(figsize=(12, 6))

base = datetime(2023, 1, 1)
dates = [base + timedelta(days=x) for x in range(180)]
values = np.cumsum(np.random.randn(180))

ax.plot(dates, values)
ax.set_title('Date Axis with Minor Locator - how2matplotlib.com')

# 设置主要和次要定位器
ax.xaxis.set_major_locator(AutoDateLocator())
ax.xaxis.set_major_formatter(DateFormatter('%Y-%m-%d'))
ax.xaxis.set_minor_locator(AutoMinorLocator())

# 获取并打印次要刻度定位器
minor_locator = ax.xaxis.get_minor_locator()
print(f"Date axis minor locator: {minor_locator}")

fig.autofmt_xdate()  # 自动格式化日期标签
plt.show()
在这个例子中,我们创建了一个日期时间轴,设置了主要和次要刻度定位器,然后使用get_minor_locator()获取并打印了次要刻度定位器。
9. 在3D图表中使用get_minor_locator()
get_minor_locator()函数也可以在3D图表中使用。以下是一个在3D表面图中使用次要刻度定位器的例子:
import matplotlib.pyplot as plt
import numpy as np
from matplotlib.ticker import MultipleLocator
from mpl_toolkits.mplot3d import Axes3D

fig = plt.figure(figsize=(12, 8))
ax = fig.add_subplot(111, projection='3d')

X = np.arange(-5, 5, 0.25)
Y = np.arange(-5, 5, 0.25)
X, Y = np.meshgrid(X, Y)
R = np.sqrt(X**2 + Y**2)
Z = np.sin(R)

surf = ax.plot_surface(X, Y, Z, cmap='viridis')
ax.set_title('3D Surface Plot with Minor Locator - how2matplotlib.com')

# 设置次要刻度定位器
ax.xaxis.set_minor_locator(MultipleLocator(0.5))
ax.yaxis.set_minor_locator(MultipleLocator(0.5))
ax.zaxis.set_minor_locator(MultipleLocator(0.1))

# 获取并打印次要刻度定位器
x_minor_locator = ax.xaxis.get_minor_locator()
y_minor_locator = ax.yaxis.get_minor_locator()
z_minor_locator = ax.zaxis.get_minor_locator()

print(f"X-axis minor locator: {x_minor_locator}")
print(f"Y-axis minor locator: {y_minor_locator}")
print(f"Z-axis minor locator: {z_minor_locator}")

plt.show()
Output:
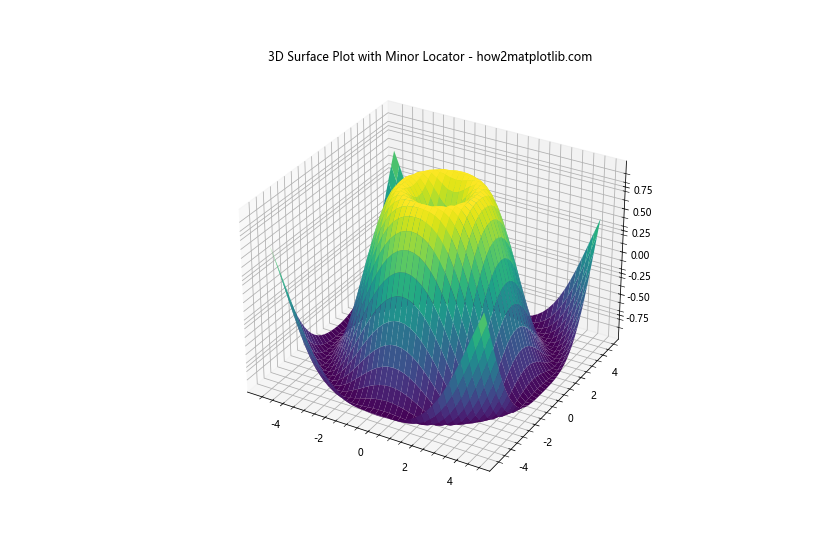
在这个3D表面图例子中,我们为x轴、y轴和z轴设置了不同的次要刻度定位器,然后使用get_minor_locator()获取并打印了这些定位器。
10. 性能考虑
虽然get_minor_locator()函数本身不会对性能产生显著影响,但频繁地更改次要刻度定位器或使用复杂的自定义定位器可能会影响图表的渲染速度,特别是在处理大量数据或创建动画时。
以下是一些优化建议:
- 尽量使用内置的定位器,如
AutoMinorLocator或MultipleLocator,它们经过优化,性能较好。 - 如果使用自定义定位器,确保其
__call__方法的实现尽可能高效。 - 在处理大量数据时,考虑减少次要刻度的数量或完全禁用它们。
- 如果创建动画,可以在初始化时设置次要刻度定位器,而不是在每一帧都重新设置。
结论
Axis.get_minor_locator()函数是Matplotlib中一个强大而灵活的工具,它允许你获取和操作坐标轴的次要刻度定位器。通过合理使用这个函数,你可以精确控制图表的刻度显示,提高数据可视化的质量和可读性。
无论你是创建简单的线图、复杂的统计图表,还是处理时间序列数据或3D可视化,了解如何使用get_minor_locator()函数都将帮助你更好地定制和优化你的图表。记住,刻度的设置应该始终服务于数据的清晰表达,过多或不恰当的刻度可能会分散读者的注意力。
通过本文的详细介绍和丰富的示例,你应该已经掌握了get_minor_locator()函数的使用方法,以及如何将它与其他Matplotlib功能结合使用。继续探索和实践,你将能够创建出更加精确、美观和信息丰富的数据可视化作品。
 极客教程
极客教程