Matplotlib中的axis.Axis.get_label_position()函数详解与应用
参考:Matplotlib.axis.Axis.get_label_position() function in Python
Matplotlib是Python中最流行的数据可视化库之一,它提供了丰富的绘图功能和自定义选项。在Matplotlib中,axis.Axis.get_label_position()函数是一个非常有用的工具,用于获取坐标轴标签的位置信息。本文将深入探讨这个函数的用法、特点以及在实际绘图中的应用。
1. 函数简介
axis.Axis.get_label_position()函数属于Matplotlib库中的axis.Axis类。这个函数的主要作用是返回坐标轴标签的当前位置。对于x轴,可能的返回值是’bottom’或’top’;对于y轴,可能的返回值是’left’或’right’。
让我们从一个简单的例子开始:
import matplotlib.pyplot as plt

fig, ax = plt.subplots()
ax.set_title("How2matplotlib.com - Get Label Position")

x_label_position = ax.xaxis.get_label_position()
y_label_position = ax.yaxis.get_label_position()

print(f"X-axis label position: {x_label_position}")
print(f"Y-axis label position: {y_label_position}")

plt.show()
Output:
在这个例子中,我们创建了一个简单的图形,然后分别获取了x轴和y轴标签的位置。默认情况下,x轴标签位于底部(’bottom’),y轴标签位于左侧(’left’)。
2. 函数语法和参数
axis.Axis.get_label_position()函数的语法非常简单:
Axis.get_label_position()
这个函数不需要任何参数,它直接返回当前轴标签的位置。
3. 返回值解析
函数的返回值是一个字符串,表示轴标签的位置:
- 对于x轴:
- ‘bottom’:标签位于x轴下方
- ‘top’:标签位于x轴上方
- 对于y轴:
- ‘left’:标签位于y轴左侧
- ‘right’:标签位于y轴右侧
4. 实际应用示例
4.1 获取并打印轴标签位置
import matplotlib.pyplot as plt

fig, ax = plt.subplots()
ax.set_title("How2matplotlib.com - Axis Label Positions")

x_pos = ax.xaxis.get_label_position()
y_pos = ax.yaxis.get_label_position()

ax.set_xlabel(f"X-axis (position: {x_pos})")
ax.set_ylabel(f"Y-axis (position: {y_pos})")

plt.plot([1, 2, 3], [1, 4, 9])
plt.show()
Output:
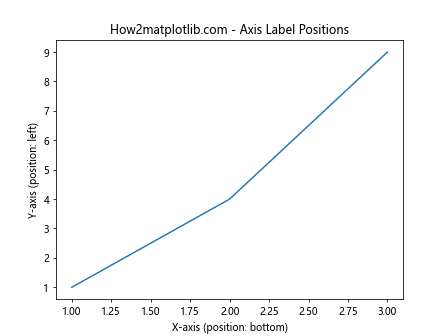
这个例子展示了如何获取轴标签的位置,并将这些信息直接显示在轴标签上。
4.2 改变轴标签位置并验证
import matplotlib.pyplot as plt

fig, (ax1, ax2) = plt.subplots(1, 2, figsize=(10, 4))
fig.suptitle("How2matplotlib.com - Changing Label Positions")

# 默认位置
ax1.set_title("Default Positions")
ax1.set_xlabel(f"X: {ax1.xaxis.get_label_position()}")
ax1.set_ylabel(f"Y: {ax1.yaxis.get_label_position()}")

# 改变位置
ax2.set_title("Changed Positions")
ax2.xaxis.set_label_position('top')
ax2.yaxis.set_label_position('right')
ax2.set_xlabel(f"X: {ax2.xaxis.get_label_position()}")
ax2.set_ylabel(f"Y: {ax2.yaxis.get_label_position()}")

plt.tight_layout()
plt.show()
Output:
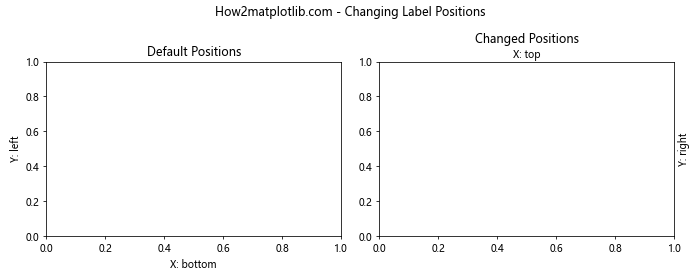
这个例子展示了如何改变轴标签的位置,并使用get_label_position()函数验证更改。
4.3 在多子图中使用
import matplotlib.pyplot as plt

fig, axs = plt.subplots(2, 2, figsize=(10, 8))
fig.suptitle("How2matplotlib.com - Label Positions in Subplots")

for i, ax in enumerate(axs.flat):
    if i % 2 == 0:
        ax.xaxis.set_label_position('top')
        ax.yaxis.set_label_position('right')

    ax.set_xlabel(f"X: {ax.xaxis.get_label_position()}")
    ax.set_ylabel(f"Y: {ax.yaxis.get_label_position()}")
    ax.set_title(f"Subplot {i+1}")

plt.tight_layout()
plt.show()
Output:
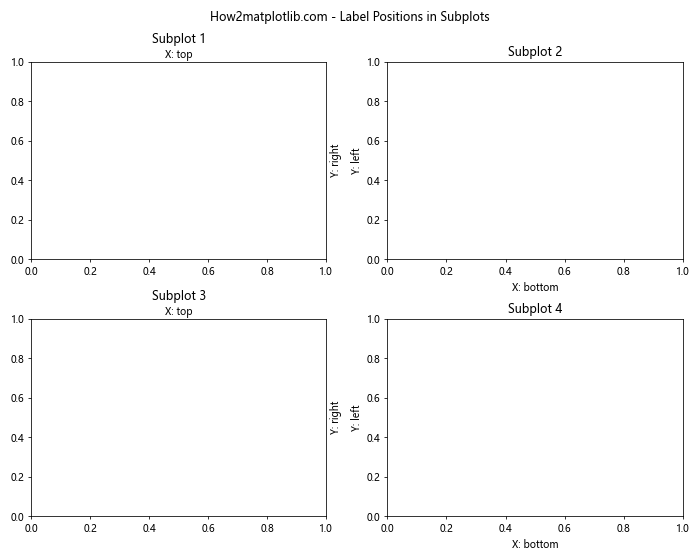
这个例子展示了如何在多个子图中使用get_label_position()函数,并为不同的子图设置不同的标签位置。
5. 与其他函数的配合使用
5.1 结合set_label_position()使用
import matplotlib.pyplot as plt

fig, ax = plt.subplots()
ax.set_title("How2matplotlib.com - Label Position Manipulation")

# 初始位置
print(f"Initial X position: {ax.xaxis.get_label_position()}")
print(f"Initial Y position: {ax.yaxis.get_label_position()}")

# 改变位置
ax.xaxis.set_label_position('top')
ax.yaxis.set_label_position('right')

# 获取新位置
new_x_pos = ax.xaxis.get_label_position()
new_y_pos = ax.yaxis.get_label_position()

ax.set_xlabel(f"New X position: {new_x_pos}")
ax.set_ylabel(f"New Y position: {new_y_pos}")

plt.show()
Output:
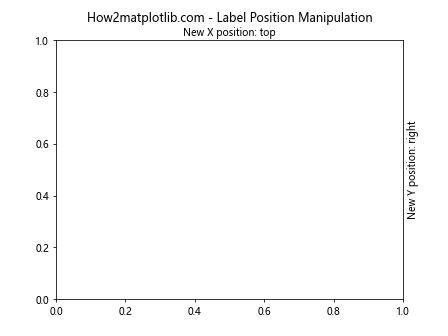
这个例子展示了如何结合set_label_position()和get_label_position()函数来操作和验证轴标签的位置。
5.2 与tick_params()函数结合
import matplotlib.pyplot as plt

fig, ax = plt.subplots()
ax.set_title("How2matplotlib.com - Label and Tick Positions")

# 设置刻度和标签位置
ax.tick_params(axis='x', which='both', top=True, bottom=False, labeltop=True, labelbottom=False)
ax.tick_params(axis='y', which='both', left=False, right=True, labelleft=False, labelright=True)

# 获取并显示标签位置
x_pos = ax.xaxis.get_label_position()
y_pos = ax.yaxis.get_label_position()

ax.set_xlabel(f"X-axis label position: {x_pos}")
ax.set_ylabel(f"Y-axis label position: {y_pos}")

plt.show()
Output:
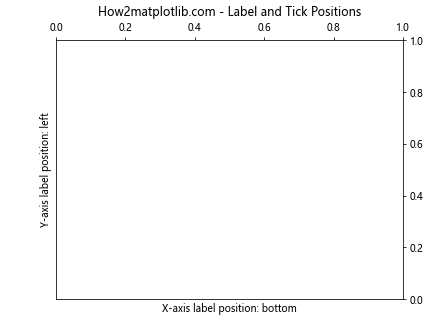
这个例子展示了如何使用tick_params()函数改变刻度和标签的位置,然后使用get_label_position()验证更改。
6. 在不同类型的图表中应用
6.1 在条形图中应用
import matplotlib.pyplot as plt
import numpy as np

fig, ax = plt.subplots()
ax.set_title("How2matplotlib.com - Bar Chart with Custom Label Positions")

x = ['A', 'B', 'C', 'D']
y = np.random.rand(4)

ax.bar(x, y)
ax.xaxis.set_label_position('top')
ax.yaxis.set_label_position('right')

ax.set_xlabel(f"Categories (Label position: {ax.xaxis.get_label_position()})")
ax.set_ylabel(f"Values (Label position: {ax.yaxis.get_label_position()})")

plt.show()
Output:
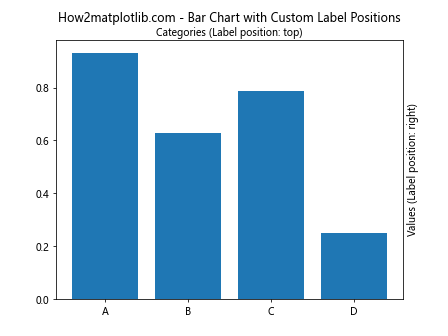
这个例子展示了如何在条形图中自定义轴标签位置并使用get_label_position()函数验证。
6.2 在散点图中应用
import matplotlib.pyplot as plt
import numpy as np

fig, ax = plt.subplots()
ax.set_title("How2matplotlib.com - Scatter Plot with Custom Label Positions")

x = np.random.rand(50)
y = np.random.rand(50)

ax.scatter(x, y)
ax.xaxis.set_label_position('top')
ax.yaxis.set_label_position('right')

ax.set_xlabel(f"X values (Label position: {ax.xaxis.get_label_position()})")
ax.set_ylabel(f"Y values (Label position: {ax.yaxis.get_label_position()})")

plt.show()
Output:
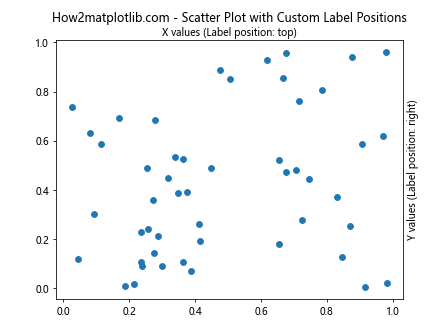
这个例子展示了如何在散点图中自定义轴标签位置并使用get_label_position()函数验证。
7. 处理特殊情况
7.1 处理双轴图
import matplotlib.pyplot as plt
import numpy as np

fig, ax1 = plt.subplots()
ax1.set_title("How2matplotlib.com - Dual Axis Plot")

x = np.linspace(0, 10, 100)
y1 = np.sin(x)
y2 = np.cos(x)

ax1.plot(x, y1, 'b-', label='sin(x)')
ax1.set_xlabel(f"X (position: {ax1.xaxis.get_label_position()})")
ax1.set_ylabel(f"sin(x) (position: {ax1.yaxis.get_label_position()})", color='b')

ax2 = ax1.twinx()
ax2.plot(x, y2, 'r-', label='cos(x)')
ax2.set_ylabel(f"cos(x) (position: {ax2.yaxis.get_label_position()})", color='r')

plt.show()
Output:
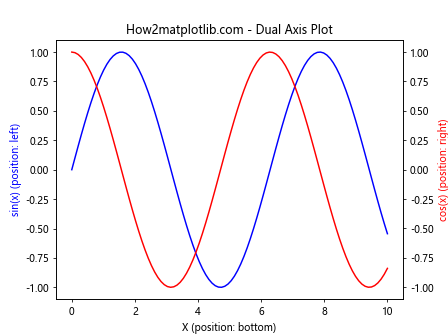
这个例子展示了如何在双轴图中使用get_label_position()函数,并处理两个y轴的标签位置。
7.2 处理极坐标图
import matplotlib.pyplot as plt
import numpy as np

fig, ax = plt.subplots(subplot_kw=dict(projection='polar'))
ax.set_title("How2matplotlib.com - Polar Plot")

r = np.arange(0, 2, 0.01)
theta = 2 * np.pi * r

ax.plot(theta, r)

# 极坐标图中,x轴变为theta轴,y轴变为r轴
theta_pos = ax.xaxis.get_label_position()
r_pos = ax.yaxis.get_label_position()

ax.set_xlabel(f"Theta axis (position: {theta_pos})")
ax.set_ylabel(f"R axis (position: {r_pos})")

plt.show()
Output:
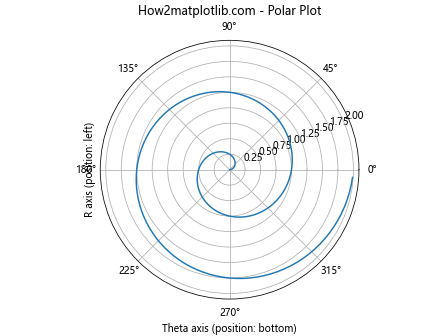
这个例子展示了如何在极坐标图中使用get_label_position()函数,并处理极坐标系中的特殊轴。
8. 高级应用
8.1 动态更新标签位置
import matplotlib.pyplot as plt
import numpy as np

fig, ax = plt.subplots()
ax.set_title("How2matplotlib.com - Dynamic Label Position")

x = np.linspace(0, 10, 100)
y = np.sin(x)

line, = ax.plot(x, y)

def update(frame):
    if frame % 2 == 0:
        ax.xaxis.set_label_position('bottom')
        ax.yaxis.set_label_position('left')
    else:
        ax.xaxis.set_label_position('top')
        ax.yaxis.set_label_position('right')

    ax.set_xlabel(f"X (position: {ax.xaxis.get_label_position()})")
    ax.set_ylabel(f"Y (position: {ax.yaxis.get_label_position()})")
    return line,

from matplotlib.animation import FuncAnimation
ani = FuncAnimation(fig, update, frames=10, interval=1000, blit=True)
plt.show()
Output:
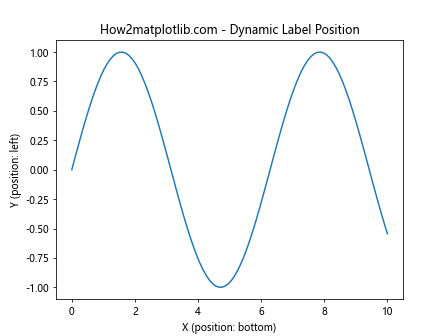
这个例子展示了如何创建一个动画,动态更新轴标签的位置,并使用get_label_position()函数实时显示位置信息。
8.2 自定义轴类
import matplotlib.pyplot as plt
from matplotlib.axis import Axis

class CustomAxis(Axis):
    def get_label_position(self):
        pos = super().get_label_position()
        return f"Custom {pos}"

fig, ax = plt.subplots()
ax.set_title("How2matplotlib.com - Custom Axis Class")

# 替换默认的x轴和y轴
ax.xaxis = CustomAxis(ax, 'bottom')
ax.yaxis = CustomAxis(ax, 'left')

ax.set_xlabel(f"X (position: {ax.xaxis.get_label_position()})")
ax.set_ylabel(f"Y (position: {ax.yaxis.get_label_position()})")

plt.show()
这个例子展示了如何创建一个自定义的轴类,重写get_label_position()方法以返回自定义的位置信息。
9. 常见问题和解决方案
9.1 处理标签重叠
import matplotlib.pyplot as plt
import numpy as np

fig, ax = plt.subplots(figsize=(8, 6))
ax.set_title("How2matplotlib.com - Handling Label Overlap")

x = np.linspace(0, 10, 100)
y = np.sin(x)

ax.plot(x, y)
ax.xaxis.set_label_position('top')
ax.yaxis.set_label_position('right')

x_pos = ax.xaxis.get_label_position()
y_pos = ax.yaxis.get_label_position()

ax.set_xlabel(f"X (position: {x_pos})", labelpad=10)
ax.set_ylabel(f"Y (position: {y_pos})", labelpad=10)

plt.tight_layout()
plt.show()
Output:
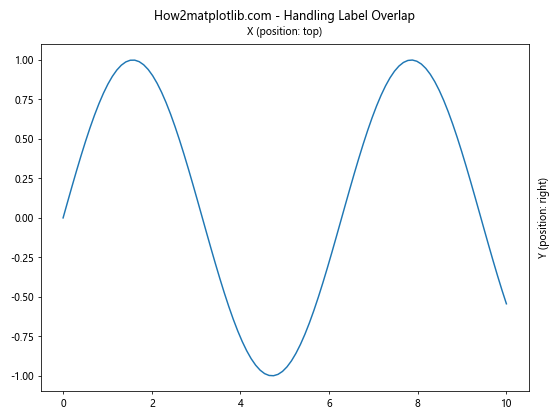
这个例子展示了如何处理标签重叠的问题,通过使用labelpad参数来增加标签与轴的距离。
9.2 处理多语言标签
import matplotlib.pyplot as plt
import numpy as np

fig, ax = plt.subplots()
ax.set_title("How2matplotlib.com - Multilingual Labels")

x = np.linspace(0, 10, 100)
y = np.sin(x)ax.plot(x, y)

# 设置中文标签
ax.set_xlabel(f"X轴 (位置: {ax.xaxis.get_label_position()})")
ax.set_ylabel(f"Y轴 (位置: {ax.yaxis.get_label_position()})")

# 使用Unicode字符
ax.set_title("Многоязычные метки (Multilingual Labels)")

plt.show()
这个例子展示了如何处理多语言标签,包括中文和其他Unicode字符。
10. 性能考虑
虽然get_label_position()函数本身的性能开销很小,但在处理大量图表或进行频繁更新时,仍然需要注意一些性能问题:
10.1 缓存标签位置
import matplotlib.pyplot as plt
import numpy as np

fig, axs = plt.subplots(2, 2, figsize=(10, 8))
fig.suptitle("How2matplotlib.com - Caching Label Positions")

# 缓存标签位置
x_positions = {}
y_positions = {}

for i, ax in enumerate(axs.flat):
    x = np.linspace(0, 10, 100)
    y = np.sin(x + i)
    ax.plot(x, y)

    # 只在第一次调用时获取位置
    if i not in x_positions:
        x_positions[i] = ax.xaxis.get_label_position()
    if i not in y_positions:
        y_positions[i] = ax.yaxis.get_label_position()

    ax.set_xlabel(f"X (pos: {x_positions[i]})")
    ax.set_ylabel(f"Y (pos: {y_positions[i]})")

plt.tight_layout()
plt.show()
Output:
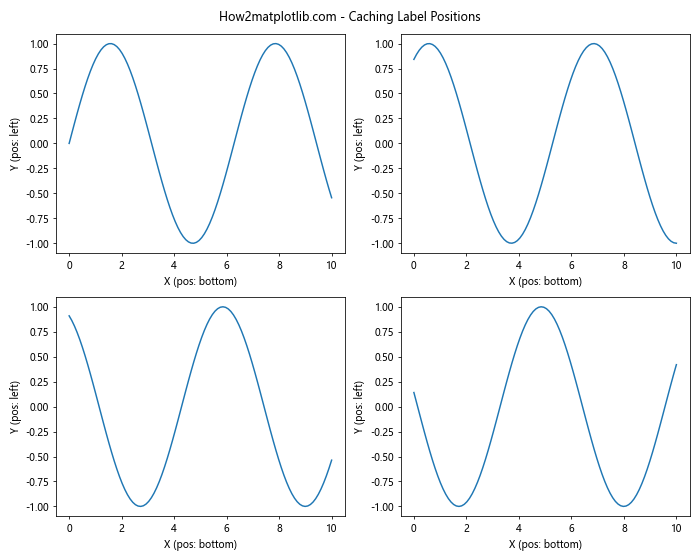
这个例子展示了如何通过缓存标签位置来减少重复调用get_label_position()函数的次数,从而提高性能。
11. 与其他Matplotlib功能的集成
11.1 结合legend使用
import matplotlib.pyplot as plt
import numpy as np

fig, ax = plt.subplots()
ax.set_title("How2matplotlib.com - Integration with Legend")

x = np.linspace(0, 10, 100)
y1 = np.sin(x)
y2 = np.cos(x)

ax.plot(x, y1, label='sin(x)')
ax.plot(x, y2, label='cos(x)')

ax.legend(title=f"Legend (X label pos: {ax.xaxis.get_label_position()})")

ax.set_xlabel(f"X (position: {ax.xaxis.get_label_position()})")
ax.set_ylabel(f"Y (position: {ax.yaxis.get_label_position()})")

plt.show()
Output:
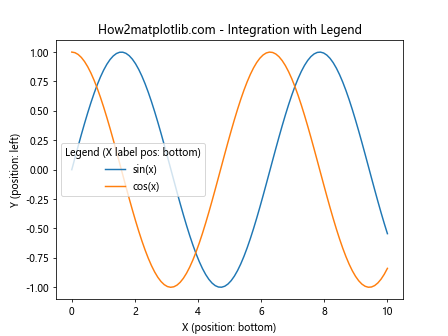
这个例子展示了如何将get_label_position()函数与图例(legend)功能结合使用。
11.2 在3D图中应用
import matplotlib.pyplot as plt
import numpy as np

fig = plt.figure()
ax = fig.add_subplot(111, projection='3d')
ax.set_title("How2matplotlib.com - 3D Plot Label Positions")

x = np.linspace(-5, 5, 100)
y = np.linspace(-5, 5, 100)
X, Y = np.meshgrid(x, y)
Z = np.sin(np.sqrt(X**2 + Y**2))

ax.plot_surface(X, Y, Z)

ax.set_xlabel(f"X (position: {ax.xaxis.get_label_position()})")
ax.set_ylabel(f"Y (position: {ax.yaxis.get_label_position()})")
ax.set_zlabel(f"Z (position: {ax.zaxis.get_label_position()})")

plt.show()
Output:
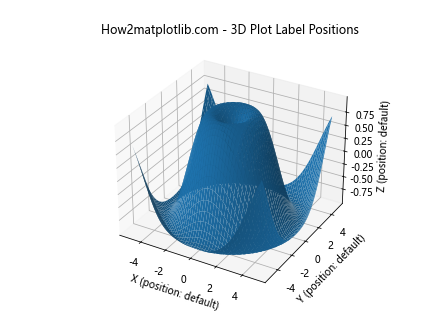
这个例子展示了如何在3D图中使用get_label_position()函数,包括处理z轴的标签位置。
12. 自定义样式和主题
12.1 使用自定义样式
import matplotlib.pyplot as plt
import numpy as np

plt.style.use('seaborn')

fig, ax = plt.subplots()
ax.set_title("How2matplotlib.com - Custom Style")

x = np.linspace(0, 10, 100)
y = np.sin(x)

ax.plot(x, y)

ax.set_xlabel(f"X (style: seaborn, position: {ax.xaxis.get_label_position()})")
ax.set_ylabel(f"Y (style: seaborn, position: {ax.yaxis.get_label_position()})")

plt.show()
这个例子展示了如何在使用自定义样式的同时,应用get_label_position()函数。
12.2 创建自定义主题
import matplotlib.pyplot as plt
import numpy as np

# 创建自定义主题
plt.style.use('default')
plt.rcParams.update({
    'font.family': 'serif',
    'font.size': 12,
    'axes.labelcolor': 'darkgreen',
    'xtick.color': 'darkblue',
    'ytick.color': 'darkblue',
})

fig, ax = plt.subplots()
ax.set_title("How2matplotlib.com - Custom Theme")

x = np.linspace(0, 10, 100)
y = np.sin(x)

ax.plot(x, y)

ax.set_xlabel(f"X (custom theme, position: {ax.xaxis.get_label_position()})")
ax.set_ylabel(f"Y (custom theme, position: {ax.yaxis.get_label_position()})")

plt.show()
Output:
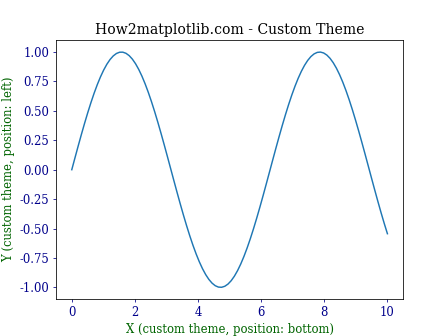
这个例子展示了如何创建自定义主题,并在此基础上使用get_label_position()函数。
13. 在实际项目中的应用
13.1 数据分析报告生成
import matplotlib.pyplot as plt
import numpy as np

def generate_report(data, filename):
    fig, (ax1, ax2) = plt.subplots(2, 1, figsize=(10, 12))
    fig.suptitle("How2matplotlib.com - Data Analysis Report")

    # 绘制折线图
    ax1.plot(data)
    ax1.set_title("Time Series Data")
    ax1.set_xlabel(f"Time (position: {ax1.xaxis.get_label_position()})")
    ax1.set_ylabel(f"Value (position: {ax1.yaxis.get_label_position()})")

    # 绘制直方图
    ax2.hist(data, bins=20)
    ax2.set_title("Data Distribution")
    ax2.set_xlabel(f"Value (position: {ax2.xaxis.get_label_position()})")
    ax2.set_ylabel(f"Frequency (position: {ax2.yaxis.get_label_position()})")

    plt.tight_layout()
    plt.savefig(filename)
    plt.close()

# 模拟数据
data = np.random.randn(1000).cumsum()

# 生成报告
generate_report(data, "data_analysis_report.png")

print("Report generated successfully.")
这个例子展示了如何在实际的数据分析报告生成过程中使用get_label_position()函数,以确保标签位置信息正确显示。
13.2 交互式数据探索工具
import matplotlib.pyplot as plt
import numpy as np
from matplotlib.widgets import RadioButtons

fig, ax = plt.subplots()
ax.set_title("How2matplotlib.com - Interactive Data Exploration")

x = np.linspace(0, 10, 100)
y = np.sin(x)
line, = ax.plot(x, y)

# 创建单选按钮
rax = plt.axes([0.05, 0.7, 0.15, 0.15])
radio = RadioButtons(rax, ('sin', 'cos', 'tan'))

def update_function(label):
    if label == 'sin':
        y = np.sin(x)
    elif label == 'cos':
        y = np.cos(x)
    else:
        y = np.tan(x)
    line.set_ydata(y)
    ax.set_ylim(min(y), max(y))

    # 更新标签位置信息
    ax.set_xlabel(f"X (position: {ax.xaxis.get_label_position()})")
    ax.set_ylabel(f"Y (position: {ax.yaxis.get_label_position()})")

    fig.canvas.draw_idle()

radio.on_clicked(update_function)

plt.show()
Output:
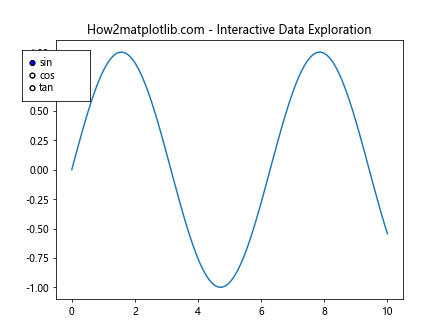
这个例子展示了如何在交互式数据探索工具中使用get_label_position()函数,以实时更新标签位置信息。
14. 总结
通过本文的详细介绍和丰富的示例,我们深入探讨了Matplotlib中axis.Axis.get_label_position()函数的各个方面。这个函数虽然简单,但在实际应用中却非常有用,特别是在需要精确控制和动态调整图表布局时。
我们学习了如何:
1. 获取和解释轴标签的位置信息
2. 在不同类型的图表中应用这个函数
3. 结合其他Matplotlib功能使用
4. 处理特殊情况和常见问题
5. 在实际项目中应用这个函数
通过掌握get_label_position()函数,我们可以更好地控制图表的外观,提高数据可视化的质量和可读性。在数据分析、科学研究、报告生成等各种场景中,这个函数都能发挥重要作用。
 极客教程
极客教程