Matplotlib中的axis.Axis.get_agg_filter()函数详解与应用
参考:Matplotlib.axis.Axis.get_agg_filter() function in Python
Matplotlib是Python中最流行的数据可视化库之一,它提供了丰富的绘图功能和自定义选项。在Matplotlib中,axis.Axis.get_agg_filter()函数是一个重要的方法,用于获取轴对象的聚合滤镜。本文将深入探讨这个函数的用法、特性以及在实际绘图中的应用。
1. axis.Axis.get_agg_filter()函数简介
axis.Axis.get_agg_filter()是Matplotlib库中Axis类的一个方法。这个函数的主要作用是返回当前轴对象设置的聚合滤镜。聚合滤镜是一种用于图形渲染的技术,可以对绘图元素应用各种视觉效果,如模糊、阴影等。
1.1 基本语法
import matplotlib.pyplot as plt

fig, ax = plt.subplots()
agg_filter = ax.xaxis.get_agg_filter()
print(f"Aggregate filter for x-axis: {agg_filter}")
plt.title("how2matplotlib.com - Get Agg Filter Example")
plt.show()
Output:

在这个例子中,我们创建了一个图形和轴对象,然后使用get_agg_filter()方法获取x轴的聚合滤镜。通常情况下,如果没有特别设置,这个方法会返回None。
1.2 返回值
get_agg_filter()方法返回一个可调用对象(通常是一个函数)或None。如果返回一个函数,这个函数应该接受一个渲染器作为参数,并返回一个滤镜函数。
2. 设置和获取聚合滤镜
虽然get_agg_filter()方法本身只是获取聚合滤镜,但要理解它的作用,我们需要先了解如何设置聚合滤镜。
2.1 设置聚合滤镜
import matplotlib.pyplot as plt
import numpy as np

def my_filter(renderer):
    return lambda x, y: np.sin(x) + y

fig, ax = plt.subplots()
ax.xaxis.set_agg_filter(my_filter)
ax.plot([1, 2, 3, 4], [1, 4, 2, 3])
plt.title("how2matplotlib.com - Set Agg Filter Example")
plt.show()

print(f"Agg filter: {ax.xaxis.get_agg_filter()}")
在这个例子中,我们定义了一个简单的滤镜函数my_filter,并使用set_agg_filter()方法将其应用到x轴上。然后,我们可以使用get_agg_filter()来验证滤镜是否被正确设置。
2.2 获取并使用聚合滤镜
import matplotlib.pyplot as plt

fig, ax = plt.subplots()
ax.plot([1, 2, 3, 4], [1, 4, 2, 3])

agg_filter = ax.xaxis.get_agg_filter()
if agg_filter:
    renderer = fig.canvas.get_renderer()
    filter_func = agg_filter(renderer)
    # 使用filter_func进行进一步处理
else:
    print("No aggregate filter set for x-axis")

plt.title("how2matplotlib.com - Use Agg Filter Example")
plt.show()
Output:

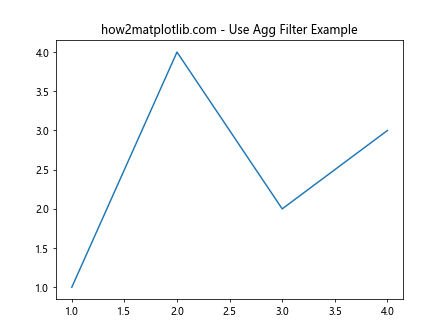
这个例子展示了如何获取聚合滤镜并在需要时使用它。如果设置了滤镜,我们可以获取渲染器并应用滤镜函数。
3. 聚合滤镜的应用场景
聚合滤镜在Matplotlib中有多种应用场景,主要用于增强图形的视觉效果或实现特定的渲染效果。
3.1 模糊效果
import matplotlib.pyplot as plt
import numpy as np
from scipy.ndimage import gaussian_filter

def blur_filter(renderer):
    def filter_func(x, y):
        return gaussian_filter(y, sigma=1)
    return filter_func

fig, ax = plt.subplots()
x = np.linspace(0, 10, 100)
y = np.sin(x)
ax.plot(x, y)
ax.xaxis.set_agg_filter(blur_filter)
plt.title("how2matplotlib.com - Blur Filter Example")
plt.show()
这个例子展示了如何使用高斯模糊滤镜来模糊x轴。虽然get_agg_filter()不直接参与这个过程,但它可以用来验证滤镜是否被正确应用。
3.2 阴影效果
import matplotlib.pyplot as plt
import numpy as np

def shadow_filter(renderer):
    def filter_func(x, y):
        return np.column_stack((x + 0.1, y - 0.1))
    return filter_func

fig, ax = plt.subplots()
x = np.linspace(0, 10, 100)
y = np.sin(x)
ax.plot(x, y)
ax.xaxis.set_agg_filter(shadow_filter)
plt.title("how2matplotlib.com - Shadow Filter Example")
plt.show()
这个例子创建了一个简单的阴影效果,通过稍微偏移x轴的位置来实现。同样,get_agg_filter()可以用来确认这个滤镜是否被正确设置。
4. 在复杂图形中使用get_agg_filter()
在更复杂的图形中,get_agg_filter()可以用来检查和管理多个轴的滤镜设置。
4.1 多子图滤镜管理
import matplotlib.pyplot as plt
import numpy as np

def custom_filter(renderer):
    return lambda x, y: np.sin(x) + y

fig, axs = plt.subplots(2, 2)
for i, ax in enumerate(axs.flat):
    ax.plot(np.random.rand(10))
    if i % 2 == 0:
        ax.xaxis.set_agg_filter(custom_filter)

for i, ax in enumerate(axs.flat):
    filter = ax.xaxis.get_agg_filter()
    print(f"Subplot {i+1} x-axis filter: {filter}")

plt.suptitle("how2matplotlib.com - Multiple Subplots Agg Filter")
plt.tight_layout()
plt.show()
这个例子创建了一个2×2的子图网格,并对偶数编号的子图应用了自定义滤镜。然后使用get_agg_filter()来检查每个子图的滤镜设置。
4.2 动态滤镜切换
import matplotlib.pyplot as plt
import numpy as np

def filter1(renderer):
    return lambda x, y: np.sin(x) + y

def filter2(renderer):
    return lambda x, y: np.cos(x) + y

fig, ax = plt.subplots()
x = np.linspace(0, 10, 100)
line, = ax.plot(x, np.sin(x))

current_filter = 'none'

def toggle_filter(event):
    global current_filter
    if current_filter == 'none':
        ax.xaxis.set_agg_filter(filter1)
        current_filter = 'filter1'
    elif current_filter == 'filter1':
        ax.xaxis.set_agg_filter(filter2)
        current_filter = 'filter2'
    else:
        ax.xaxis.set_agg_filter(None)
        current_filter = 'none'
    print(f"Current filter: {ax.xaxis.get_agg_filter()}")
    fig.canvas.draw()

plt.connect('button_press_event', toggle_filter)
plt.title("how2matplotlib.com - Dynamic Filter Switching")
plt.show()
Output:

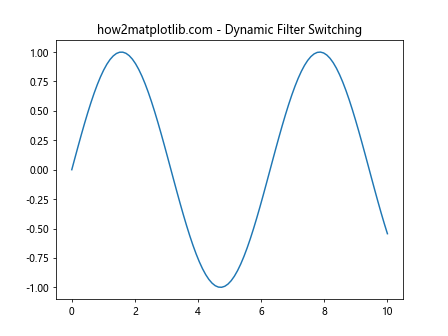
这个例子展示了如何动态切换滤镜。每次点击图形时,会在不同的滤镜之间切换,并使用get_agg_filter()来确认当前的滤镜设置。
5. get_agg_filter()与其他Matplotlib功能的结合
get_agg_filter()函数可以与Matplotlib的其他功能结合使用,以创建更复杂和有趣的可视化效果。
5.1 结合动画效果
import matplotlib.pyplot as plt
import matplotlib.animation as animation
import numpy as np

def time_varying_filter(t):
    def filter_func(renderer):
        return lambda x, y: np.sin(x + t) + y
    return filter_func

fig, ax = plt.subplots()
x = np.linspace(0, 2*np.pi, 100)
line, = ax.plot(x, np.sin(x))

def animate(frame):
    ax.xaxis.set_agg_filter(time_varying_filter(frame * 0.1))
    print(f"Frame {frame}, Filter: {ax.xaxis.get_agg_filter()}")
    return line,

ani = animation.FuncAnimation(fig, animate, frames=50, interval=100, blit=True)
plt.title("how2matplotlib.com - Animated Agg Filter")
plt.show()
这个例子创建了一个动画,其中x轴的滤镜随时间变化。我们使用get_agg_filter()来跟踪每一帧的滤镜变化。
5.2 自适应滤镜
import matplotlib.pyplot as plt
import numpy as np

def adaptive_filter(renderer):
    def filter_func(x, y):
        return np.where(y > 0.5, y + 0.1, y - 0.1)
    return filter_func

fig, ax = plt.subplots()
x = np.linspace(0, 10, 100)
y = np.sin(x)
ax.plot(x, y)
ax.xaxis.set_agg_filter(adaptive_filter)

print(f"Adaptive filter set: {ax.xaxis.get_agg_filter()}")

plt.title("how2matplotlib.com - Adaptive Agg Filter")
plt.show()
这个例子展示了一个自适应滤镜,根据y值的大小来调整效果。get_agg_filter()用于确认滤镜已被正确设置。
6. get_agg_filter()在自定义可视化中的应用
在创建自定义可视化时,get_agg_filter()可以用来检查和管理复杂的滤镜设置。
6.1 创建自定义图例
import matplotlib.pyplot as plt
import numpy as np

def custom_legend_filter(renderer):
    def filter_func(x, y):
        return x + 0.05, y + 0.05
    return filter_func

fig, ax = plt.subplots()
x = np.linspace(0, 10, 100)
ax.plot(x, np.sin(x), label='Sin')
ax.plot(x, np.cos(x), label='Cos')

legend = ax.legend()
for text in legend.get_texts():
    text.set_agg_filter(custom_legend_filter)

print("Legend text filters:")
for text in legend.get_texts():
    print(f"- {text.get_agg_filter()}")

plt.title("how2matplotlib.com - Custom Legend with Agg Filter")
plt.show()
这个例子为图例文本应用了自定义滤镜,并使用get_agg_filter()来验证设置。
6.2 交互式滤镜选择器
import matplotlib.pyplot as plt
import numpy as np
from matplotlib.widgets import RadioButtons

def filter1(renderer):
    return lambda x, y: np.sin(x) + y

def filter2(renderer):
    return lambda x, y: np.cos(x) + y

fig, ax = plt.subplots()
x = np.linspace(0, 10, 100)
line, = ax.plot(x, np.sin(x))

rax = plt.axes([0.05, 0.7, 0.15, 0.15])
radio = RadioButtons(rax, ('No Filter', 'Filter 1', 'Filter 2'))

def filter_function(label):
    if label == 'Filter 1':
        ax.xaxis.set_agg_filter(filter1)
    elif label == 'Filter 2':
        ax.xaxis.set_agg_filter(filter2)
    else:
        ax.xaxis.set_agg_filter(None)
    print(f"Selected filter: {ax.xaxis.get_agg_filter()}")
    fig.canvas.draw_idle()

radio.on_clicked(filter_function)

plt.title("how2matplotlib.com - Interactive Filter Selector")
plt.show()
Output:

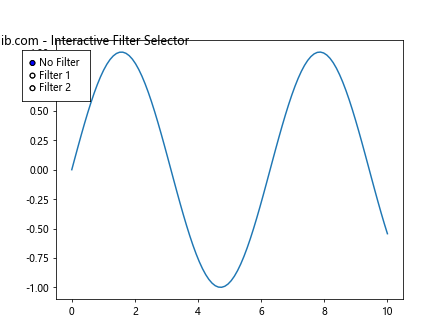
这个例子创建了一个交互式界面,允许用户选择不同的滤镜。get_agg_filter()用于确认当前选择的滤镜。
7. get_agg_filter()在数据分析中的应用
虽然get_agg_filter()主要用于图形渲染,但它也可以在数据分析过程中发挥作用。
7.1 数据异常检测可视化
import matplotlib.pyplot as plt
import numpy as np

def anomaly_filter(threshold):
    def filter_func(renderer):
        def apply_filter(x, y):
            return np.where(np.abs(y) > threshold, 'red', 'blue')
        return apply_filter
    return filter_func

fig, ax = plt.subplots()
x = np.linspace(0, 10, 100)
y = np.sin(x) + np.random.normal(0, 0.1, 100)
y[50] = 2  # 添加一个异常值

scatter = ax.scatter(x, y)
scatter.set_agg_filter(anomaly_filter(1.5))

print(f"Anomaly detection filter: {scatter.get_agg_filter()}")

plt.title("how2matplotlib.com - Anomaly Detection with Agg Filter")
plt.show()
这个例子使用聚合滤镜来突出显示数据中的异常值。get_agg_filter()用于确认异常检测滤镜已被正确应用。
7.2 数据趋势可视化
import matplotlib.pyplot as plt
import numpy as np

def trend_filter(window_size):
    def filter_func(renderer):
        def apply_filter(x, y):
            trend = np.convolve(y, np.ones(window_size)/window_size, mode='same')
            return x, trend
        return apply_filter
    return filter_func

fig, ax = plt.subplots()
x = np.linspace(0, 10, 100)
y = np.sin(x) + np.random.normal(0, 0.2, 100)

line, = ax.plot(x, y, alpha=0.5)
trend_line, = ax.plot(x, y)
trend_line.set_agg_filter(trend_filter(10))

print(f"Trend filter: {trend_line.get_agg_filter()}")

plt.title("how2matplotlib.com - Data Trend Visualization with Agg Filter")
plt.show()
这个例子使用聚合滤镜来显示数据的趋势线。get_agg_filter()用于确认趋势滤镜已被正确应用到趋势线上。
8. get_agg_filter()的性能考虑
虽然聚合滤镜可以创造出有趣的视觉效果,但它们可能会影响绘图的性能。使用get_agg_filter()可以帮助我们管理和优化滤镜的使用。
8.1 滤镜性能监控
import matplotlib.pyplot as plt
import numpy as np
import time

def time_consuming_filter(renderer):
    time.sleep(0.1)  # 模拟耗时操作
    return lambda x, y: np.sin(x) + y

fig, ax = plt.subplots()
x = np.linspace(0, 10, 100)
y = np.sin(x)

start_time = time.time()
ax.plot(x, y)
ax.xaxis.set_agg_filter(time_consuming_filter)
end_time = time.time()

print(f"Time taken to apply filter: {end_time - start_time:.2f} seconds")
print(f"Applied filter: {ax.xaxis.get_agg_filter()}")

plt.title("how2matplotlib.com - Filter Performance Monitoring")
plt.show()
这个例子演示了如何监控滤镜的性能影响。通过测量应用滤镜前后的时间差,我们可以评估滤镜的性能开销。
8.2 条件性滤镜应用
import matplotlib.pyplot as plt
import numpy as np

def conditional_filter(threshold):
    def filter_func(renderer):
        def apply_filter(x, y):
            return np.where(y > threshold, y * 1.1, y)
        return apply_filter
    return filter_func

fig, ax = plt.subplots()
x = np.linspace(0, 10, 1000)
y = np.sin(x)

ax.plot(x, y)

if len(x) > 500:
    ax.xaxis.set_agg_filter(conditional_filter(0.5))
    print(f"Filter applied: {ax.xaxis.get_agg_filter()}")
else:
    print("No filter applied due to small data size")

plt.title("how2matplotlib.com - Conditional Filter Application")
plt.show()
这个例子展示了如何根据数据的特性有条件地应用滤镜。只有当数据点数量超过一定阈值时,才应用滤镜,从而优化性能。
9. get_agg_filter()在自定义Matplotlib组件中的应用
当创建自定义的Matplotlib组件时,get_agg_filter()方法可以用来管理和检查这些组件的滤镜设置。
9.1 自定义轴类
import matplotlib.pyplot as plt
from matplotlib.axis import Axis
import numpy as np

class CustomAxis(Axis):
    def __init__(self, *args, **kwargs):
        super().__init__(*args, **kwargs)
        self._custom_filter = None

    def set_custom_filter(self, filter_func):
        self._custom_filter = filter_func
        self.set_agg_filter(filter_func)

    def get_custom_filter(self):
        return self._custom_filter

fig, ax = plt.subplots()
custom_xaxis = CustomAxis(ax, 'x')
ax.xaxis = custom_xaxis

def custom_filter(renderer):
    return lambda x, y: np.sin(x) + y

custom_xaxis.set_custom_filter(custom_filter)

print(f"Custom filter: {custom_xaxis.get_custom_filter()}")
print(f"Agg filter: {custom_xaxis.get_agg_filter()}")

ax.plot([1, 2, 3, 4], [1, 4, 2, 3])
plt.title("how2matplotlib.com - Custom Axis with Agg Filter")
plt.show()
这个例子创建了一个自定义的轴类,它扩展了标准的Axis类,并添加了自定义滤镜的功能。我们可以使用get_agg_filter()来验证滤镜是否正确应用。
9.2 自定义图例
import matplotlib.pyplot as plt
import matplotlib.patches as patches

class CustomLegend(plt.Legend):
    def __init__(self, *args, **kwargs):
        super().__init__(*args, **kwargs)
        self._legend_filter = None

    def set_legend_filter(self, filter_func):
        self._legend_filter = filter_func
        for text in self.get_texts():
            text.set_agg_filter(filter_func)

    def get_legend_filter(self):
        return self._legend_filter

fig, ax = plt.subplots()
line, = ax.plot([1, 2, 3, 4], [1, 4, 2, 3], label='Data')

def legend_filter(renderer):
    return lambda x, y: (x + 0.05, y + 0.05)

custom_legend = CustomLegend(ax, [line], ['Data'])
custom_legend.set_legend_filter(legend_filter)
ax.add_artist(custom_legend)

print(f"Legend filter: {custom_legend.get_legend_filter()}")
for text in custom_legend.get_texts():
    print(f"Text filter: {text.get_agg_filter()}")

plt.title("how2matplotlib.com - Custom Legend with Agg Filter")
plt.show()
这个例子创建了一个自定义的图例类,它允许为图例文本设置特定的滤镜。我们使用get_agg_filter()来确认滤镜已正确应用到每个图例文本上。
10. get_agg_filter()在高级可视化技术中的应用
get_agg_filter()方法在一些高级的可视化技术中也能发挥重要作用,特别是在需要精细控制渲染过程的场景中。
10.1 创建水印效果
import matplotlib.pyplot as plt
import numpy as np

def watermark_filter(text):
    def filter_func(renderer):
        def apply_filter(x, y):
            fig = plt.gcf()
            ax = plt.gca()
            bbox = ax.get_window_extent().transformed(fig.dpi_scale_trans.inverted())
            width, height = bbox.width, bbox.height
            plt.text(0.5, 0.5, text, ha='center', va='center', alpha=0.1,
                     transform=ax.transAxes, fontsize=40)
            return x, y
        return apply_filter
    return filter_func

fig, ax = plt.subplots()
x = np.linspace(0, 10, 100)
y = np.sin(x)
ax.plot(x, y)

ax.set_agg_filter(watermark_filter("how2matplotlib.com"))

print(f"Watermark filter: {ax.get_agg_filter()}")

plt.title("Watermark Effect with Agg Filter")
plt.show()
这个例子展示了如何使用聚合滤镜来创建水印效果。get_agg_filter()用于确认水印滤镜已被正确应用。
10.2 创建热图叠加效果
import matplotlib.pyplot as plt
import numpy as np

def heatmap_overlay_filter(heatmap_data):
    def filter_func(renderer):
        def apply_filter(x, y):
            ax = plt.gca()
            extent = ax.get_xlim() + ax.get_ylim()
            ax.imshow(heatmap_data, extent=extent, alpha=0.5, cmap='hot')
            return x, y
        return apply_filter
    return filter_func

fig, ax = plt.subplots()
x = np.linspace(0, 10, 100)
y = np.sin(x)
ax.plot(x, y)

heatmap = np.random.rand(20, 20)
ax.set_agg_filter(heatmap_overlay_filter(heatmap))

print(f"Heatmap overlay filter: {ax.get_agg_filter()}")

plt.title("how2matplotlib.com - Heatmap Overlay with Agg Filter")
plt.show()
这个例子演示了如何使用聚合滤镜来创建热图叠加效果。get_agg_filter()用于确认热图叠加滤镜已被正确应用。
结论
axis.Axis.get_agg_filter()函数是Matplotlib中一个强大而灵活的工具,它允许我们检查和管理轴对象的聚合滤镜设置。通过本文的详细介绍和丰富的示例,我们看到了这个函数在各种场景下的应用,从基本的滤镜设置到复杂的可视化效果创建。
这个函数不仅可以用于简单的滤镜管理,还可以在动画、交互式可视化、数据分析和高级渲染技术中发挥重要作用。通过合理使用get_agg_filter(),我们可以创建更丰富、更有表现力的数据可视化,同时也能更好地控制和优化图形的渲染过程。
在实际应用中,建议谨慎使用聚合滤镜,因为它们可能会影响渲染性能。使用get_agg_filter()来监控和管理滤镜的使用是一个良好的实践。此外,将get_agg_filter()与其他Matplotlib功能结合使用,可以创建出更加复杂和独特的可视化效果。
总之,掌握axis.Axis.get_agg_filter()函数及其相关用法,将极大地增强您使用Matplotlib创建高质量数据可视化的能力。无论是进行日常的数据分析,还是创建复杂的科学可视化,这个函数都是一个值得深入了解和灵活运用的工具。
 极客教程
极客教程