Matplotlib中如何使用Axes.get_figure()方法获取Figure对象
参考:Matplotlib.axes.Axes.get_figure() in Python
Matplotlib是Python中最流行的绘图库之一,它提供了丰富的绘图功能和灵活的API。在Matplotlib中,Figure和Axes是两个核心概念。Figure代表整个图形窗口,而Axes则是图形中的一个绘图区域。在某些情况下,我们可能需要从Axes对象获取其所属的Figure对象,这时就可以使用Axes.get_figure()方法。本文将详细介绍Axes.get_figure()方法的使用,并通过多个示例来展示其在实际绘图中的应用。
1. Axes.get_figure()方法简介
Axes.get_figure()是Matplotlib库中Axes类的一个方法。这个方法的主要作用是返回包含当前Axes对象的Figure对象。换句话说,它允许我们从一个Axes实例获取其父级Figure实例。
这个方法的语法非常简单:
figure = axes.get_figure()
其中,axes是一个Axes对象,figure是返回的Figure对象。
2. 为什么需要使用Axes.get_figure()方法?
在Matplotlib中,我们通常先创建一个Figure对象,然后在这个Figure上添加一个或多个Axes对象。但有时候,我们可能只有Axes对象的引用,而需要对整个Figure进行操作。这时,Axes.get_figure()方法就派上用场了。
以下是一些使用Axes.get_figure()方法的常见场景:
- 调整Figure的大小或属性
- 在Figure上添加新的Axes
- 保存整个Figure
- 在Figure级别添加标题、注释等元素
3. 基本使用示例
让我们从一个简单的例子开始,展示如何使用Axes.get_figure()方法:
import matplotlib.pyplot as plt

# 创建一个Figure和Axes
fig, ax = plt.subplots()

# 在Axes上绘制一些数据
ax.plot([1, 2, 3, 4], [1, 4, 2, 3], label='how2matplotlib.com')

# 使用get_figure()获取Figure对象
figure = ax.get_figure()

# 设置Figure的标题
figure.suptitle('使用Axes.get_figure()方法 - how2matplotlib.com')

plt.show()
Output:
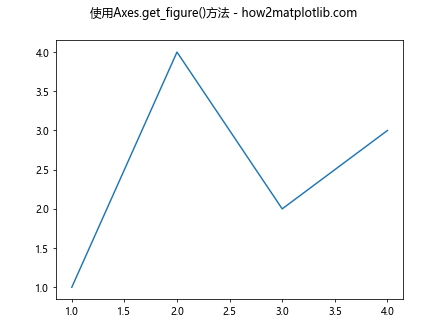
在这个例子中,我们首先创建了一个Figure和Axes,然后在Axes上绘制了一条线。接着,我们使用ax.get_figure()方法获取了Figure对象,并使用这个对象设置了Figure的标题。
4. 调整Figure大小
使用Axes.get_figure()方法,我们可以轻松地调整Figure的大小:
import matplotlib.pyplot as plt

fig, ax = plt.subplots()
ax.plot([1, 2, 3, 4], [1, 4, 2, 3], label='how2matplotlib.com')

# 获取Figure对象并调整大小
figure = ax.get_figure()
figure.set_size_inches(10, 6)

plt.title('调整Figure大小 - how2matplotlib.com')
plt.show()
Output:
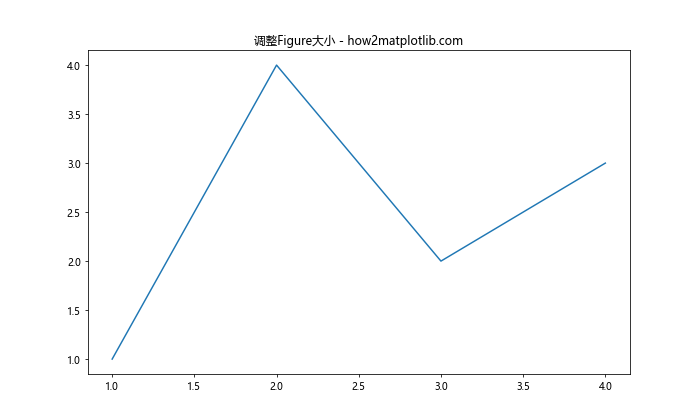
在这个例子中,我们使用get_figure()获取Figure对象,然后调用set_size_inches()方法将Figure的大小设置为10英寸宽、6英寸高。
5. 在Figure上添加新的Axes
有时候,我们可能需要在已有的Figure上添加新的Axes。使用Axes.get_figure()方法,我们可以轻松实现这一点:
import matplotlib.pyplot as plt

fig, ax1 = plt.subplots()
ax1.plot([1, 2, 3, 4], [1, 4, 2, 3], label='how2matplotlib.com')

# 获取Figure对象
figure = ax1.get_figure()

# 在Figure上添加新的Axes
ax2 = figure.add_subplot(212)
ax2.plot([1, 2, 3, 4], [3, 2, 4, 1], label='how2matplotlib.com')

plt.suptitle('在Figure上添加新的Axes - how2matplotlib.com')
plt.tight_layout()
plt.show()
Output:
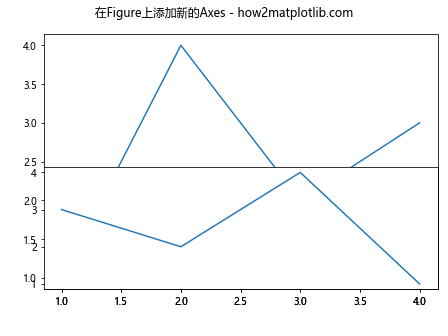
在这个例子中,我们首先创建了一个Figure和一个Axes(ax1)。然后,我们使用get_figure()获取Figure对象,并使用add_subplot()方法在Figure上添加了一个新的Axes(ax2)。
6. 保存整个Figure
Axes.get_figure()方法也可以用于保存整个Figure:
import matplotlib.pyplot as plt

fig, ax = plt.subplots()
ax.plot([1, 2, 3, 4], [1, 4, 2, 3], label='how2matplotlib.com')

# 获取Figure对象并保存
figure = ax.get_figure()
figure.savefig('how2matplotlib_com_figure.png')

plt.title('保存整个Figure - how2matplotlib.com')
plt.show()
Output:
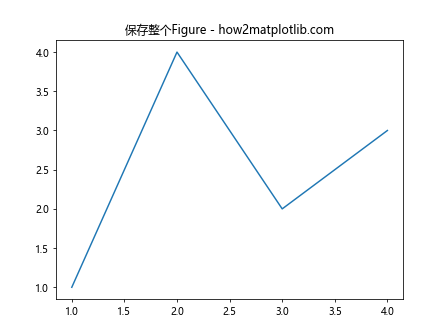
在这个例子中,我们使用get_figure()获取Figure对象,然后调用savefig()方法将整个Figure保存为PNG文件。
7. 在Figure级别添加标题
虽然我们可以使用Axes.set_title()为单个Axes添加标题,但有时我们可能想为整个Figure添加一个主标题。这可以通过Axes.get_figure()方法实现:
import matplotlib.pyplot as plt

fig, (ax1, ax2) = plt.subplots(2, 1)
ax1.plot([1, 2, 3, 4], [1, 4, 2, 3], label='how2matplotlib.com')
ax2.plot([1, 2, 3, 4], [3, 2, 4, 1], label='how2matplotlib.com')

# 获取Figure对象并添加主标题
figure = ax1.get_figure()
figure.suptitle('在Figure级别添加标题 - how2matplotlib.com', fontsize=16)

plt.tight_layout()
plt.show()
Output:
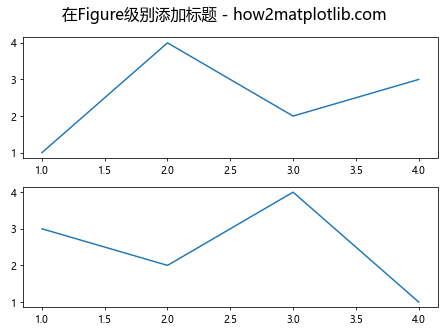
在这个例子中,我们创建了一个包含两个Axes的Figure。然后,我们使用get_figure()获取Figure对象,并使用suptitle()方法为整个Figure添加了一个主标题。
8. 调整Figure的布局
Axes.get_figure()方法还可以用于调整Figure的布局:
import matplotlib.pyplot as plt

fig, (ax1, ax2) = plt.subplots(1, 2, figsize=(10, 4))
ax1.plot([1, 2, 3, 4], [1, 4, 2, 3], label='how2matplotlib.com')
ax2.plot([1, 2, 3, 4], [3, 2, 4, 1], label='how2matplotlib.com')

# 获取Figure对象并调整布局
figure = ax1.get_figure()
figure.tight_layout(pad=3.0)

plt.suptitle('调整Figure的布局 - how2matplotlib.com', fontsize=16)
plt.show()
Output:
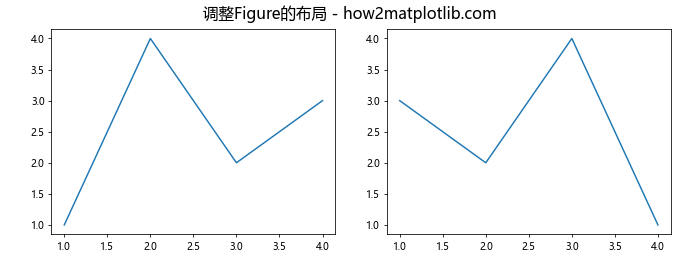
在这个例子中,我们创建了一个包含两个并排Axes的Figure。然后,我们使用get_figure()获取Figure对象,并调用tight_layout()方法来自动调整布局,增加了子图之间的间距。
9. 添加Figure级别的图例
有时,我们可能想为整个Figure添加一个统一的图例,而不是为每个Axes单独添加。这可以通过Axes.get_figure()方法实现:
import matplotlib.pyplot as plt

fig, (ax1, ax2) = plt.subplots(1, 2, figsize=(10, 4))
ax1.plot([1, 2, 3, 4], [1, 4, 2, 3], label='Data 1')
ax2.plot([1, 2, 3, 4], [3, 2, 4, 1], label='Data 2')

# 获取Figure对象并添加Figure级别的图例
figure = ax1.get_figure()
handles, labels = [], []
for ax in figure.axes:
    for h, l in zip(*ax.get_legend_handles_labels()):
        handles.append(h)
        labels.append(l)
figure.legend(handles, labels, loc='lower center', bbox_to_anchor=(0.5, -0.05), ncol=2)

plt.suptitle('添加Figure级别的图例 - how2matplotlib.com', fontsize=16)
plt.tight_layout()
plt.show()
Output:
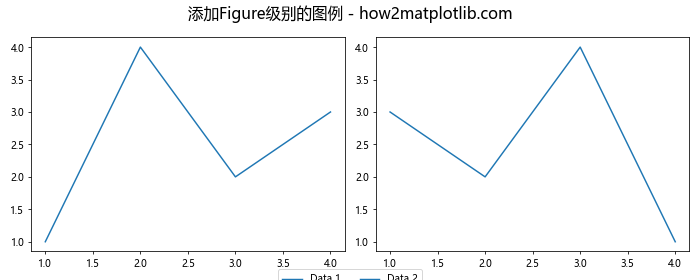
在这个例子中,我们创建了一个包含两个Axes的Figure。然后,我们使用get_figure()获取Figure对象,收集所有Axes的图例句柄和标签,并使用figure.legend()方法为整个Figure添加了一个统一的图例。
10. 在Figure上添加文本注释
使用Axes.get_figure()方法,我们可以在Figure级别添加文本注释:
import matplotlib.pyplot as plt

fig, ax = plt.subplots()
ax.plot([1, 2, 3, 4], [1, 4, 2, 3], label='how2matplotlib.com')

# 获取Figure对象并添加文本注释
figure = ax.get_figure()
figure.text(0.5, 0.02, 'how2matplotlib.com', ha='center', va='center')

plt.title('在Figure上添加文本注释')
plt.tight_layout()
plt.show()
Output:
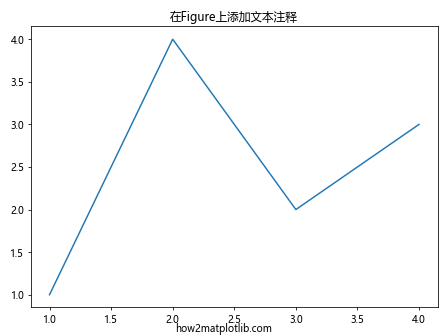
在这个例子中,我们使用get_figure()获取Figure对象,然后调用figure.text()方法在Figure的底部添加了一个文本注释。
11. 调整Figure的背景色
我们可以使用Axes.get_figure()方法来调整整个Figure的背景色:
import matplotlib.pyplot as plt

fig, ax = plt.subplots()
ax.plot([1, 2, 3, 4], [1, 4, 2, 3], label='how2matplotlib.com')

# 获取Figure对象并设置背景色
figure = ax.get_figure()
figure.patch.set_facecolor('#f0f0f0')

plt.title('调整Figure的背景色 - how2matplotlib.com')
plt.tight_layout()
plt.show()
Output:
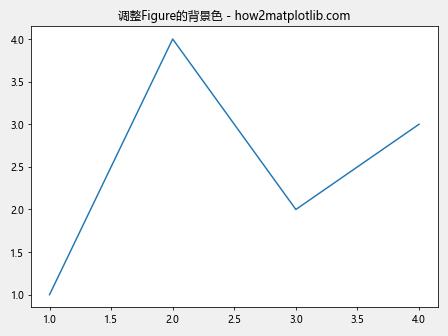
在这个例子中,我们使用get_figure()获取Figure对象,然后通过figure.patch.set_facecolor()方法设置了Figure的背景色为浅灰色。
12. 在Figure上添加水印
使用Axes.get_figure()方法,我们可以在整个Figure上添加水印:
import matplotlib.pyplot as plt

fig, ax = plt.subplots()
ax.plot([1, 2, 3, 4], [1, 4, 2, 3], label='how2matplotlib.com')

# 获取Figure对象并添加水印
figure = ax.get_figure()
figure.text(0.5, 0.5, 'how2matplotlib.com', fontsize=40, color='gray',
            ha='center', va='center', alpha=0.5, rotation=30)

plt.title('在Figure上添加水印')
plt.tight_layout()
plt.show()
Output:
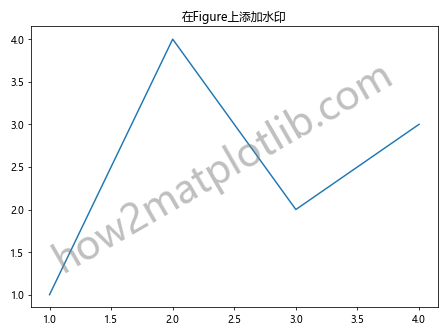
在这个例子中,我们使用get_figure()获取Figure对象,然后调用figure.text()方法在Figure的中心添加了一个半透明的水印文本。
13. 调整Figure的DPI
DPI(每英寸点数)决定了Figure的分辨率。我们可以使用Axes.get_figure()方法来调整Figure的DPI:
import matplotlib.pyplot as plt

fig, ax = plt.subplots()
ax.plot([1, 2, 3, 4], [1, 4, 2, 3], label='how2matplotlib.com')

# 获取Figure对象并设置DPI
figure = ax.get_figure()
figure.set_dpi(300)

plt.title('调整Figure的DPI - how2matplotlib.com')
plt.tight_layout()
plt.show()
Output:
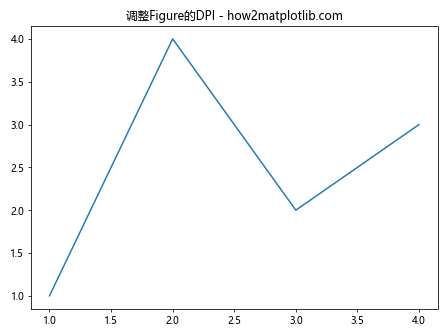
在这个例子中,我们使用get_figure()获取Figure对象,然后通过figure.set_dpi()方法将Figure的DPI设置为300,这将产生一个更高分辨率的图像。
14. 在Figure上添加子图标题
虽然我们可以为每个Axes单独设置标题,但有时我们可能想为一组子图添加一个总标题。这可以通过Axes.get_figure()方法实现:
import matplotlib.pyplot as plt

fig, (ax1, ax2) = plt.subplots(1, 2, figsize=(10, 4))
ax1.plot([1, 2, 3, 4], [1, 4, 2, 3], label='how2matplotlib.com')
ax2.plot([1, 2, 3, 4], [3, 2, 4, 1], label='how2matplotlib.com')

# 获取Figure对象并添加子图标题
figure = ax1.get_figure()
figure.suptitle('主标题 - how2matplotlib.com', fontsize=16)
figure.text(0.5, 0.04, '子图标题', ha='center', va='center', fontsize=14)

plt.tight_layout()
plt.show()
Output:
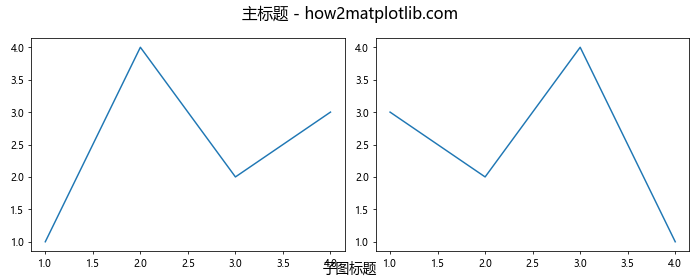
在这个例子中,我们创建了一个包含两个Axes的Figure。然后,我们使用get_figure()获取Figure对象,使用suptitle()方法添加了一个主标题,并使用figure.text()方法在Figure底部添加了一个子图标题。
15. 调整Figure的边距
使用Axes.get_figure()方法,我们可以调整Figure的边距:
import matplotlib.pyplot as plt

fig, ax = plt.subplots()
ax.plot([1, 2, 3, 4], [1, 4, 2,3], label='how2matplotlib.com')

# 获取Figure对象并调整边距
figure = ax.get_figure()
figure.subplots_adjust(left=0.2, right=0.8, top=0.8, bottom=0.2)

plt.title('调整Figure的边距 - how2matplotlib.com')
plt.show()
Output:
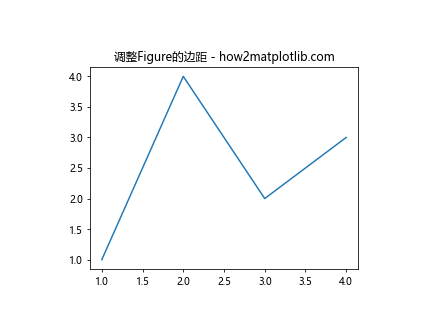
在这个例子中,我们使用get_figure()获取Figure对象,然后通过figure.subplots_adjust()方法调整了Figure的边距,使得绘图区域在Figure中更加居中。
16. 在Figure上添加多个图例
有时,我们可能需要在Figure上添加多个图例,每个图例对应不同的Axes。这可以通过Axes.get_figure()方法实现:
import matplotlib.pyplot as plt

fig, (ax1, ax2) = plt.subplots(1, 2, figsize=(10, 4))
ax1.plot([1, 2, 3, 4], [1, 4, 2, 3], label='Data 1')
ax2.plot([1, 2, 3, 4], [3, 2, 4, 1], label='Data 2')

# 获取Figure对象并添加多个图例
figure = ax1.get_figure()
legend1 = ax1.legend(loc='upper left')
legend2 = ax2.legend(loc='upper right')
figure.legends.extend([legend1, legend2])

plt.suptitle('在Figure上添加多个图例 - how2matplotlib.com', fontsize=16)
plt.tight_layout()
plt.show()
Output:
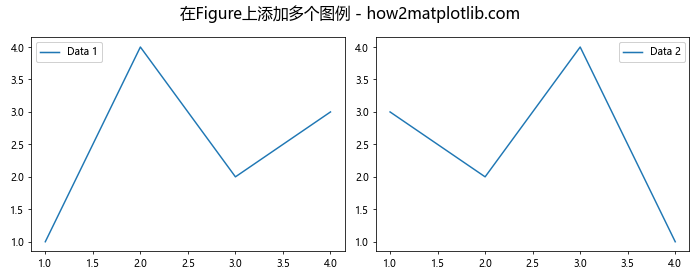
在这个例子中,我们创建了一个包含两个Axes的Figure。然后,我们使用get_figure()获取Figure对象,为每个Axes创建了一个图例,并将这些图例添加到Figure的legends列表中。
17. 使用Figure级别的颜色映射
我们可以使用Axes.get_figure()方法在Figure级别设置颜色映射:
import matplotlib.pyplot as plt
import numpy as np

fig, (ax1, ax2) = plt.subplots(1, 2, figsize=(10, 4))
data1 = np.random.rand(10, 10)
data2 = np.random.rand(10, 10)

# 获取Figure对象并设置颜色映射
figure = ax1.get_figure()
cmap = plt.get_cmap('viridis')
im1 = ax1.imshow(data1, cmap=cmap)
im2 = ax2.imshow(data2, cmap=cmap)

figure.colorbar(im1, ax=ax1, label='Values')
figure.colorbar(im2, ax=ax2, label='Values')

plt.suptitle('使用Figure级别的颜色映射 - how2matplotlib.com', fontsize=16)
plt.tight_layout()
plt.show()
Output:
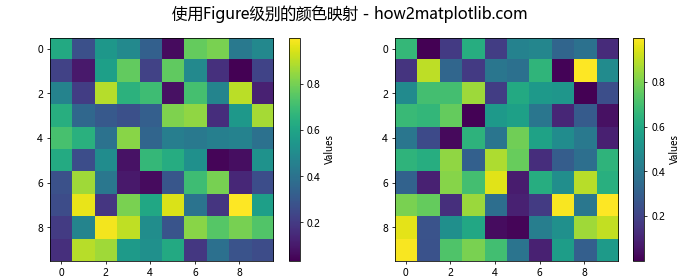
在这个例子中,我们创建了两个热图,并使用get_figure()获取Figure对象。然后,我们为两个Axes设置了相同的颜色映射,并在Figure级别添加了颜色条。
18. 在Figure上添加箭头注释
使用Axes.get_figure()方法,我们可以在Figure级别添加箭头注释:
import matplotlib.pyplot as plt

fig, ax = plt.subplots()
ax.plot([1, 2, 3, 4], [1, 4, 2, 3], label='how2matplotlib.com')

# 获取Figure对象并添加箭头注释
figure = ax.get_figure()
figure.text(0.2, 0.2, 'Important point', ha='center', va='center')
figure.annotate('', xy=(0.3, 0.3), xytext=(0.2, 0.2),
                arrowprops=dict(facecolor='black', shrink=0.05),
                xycoords='figure fraction', textcoords='figure fraction')

plt.title('在Figure上添加箭头注释 - how2matplotlib.com')
plt.tight_layout()
plt.show()
在这个例子中,我们使用get_figure()获取Figure对象,然后使用figure.text()添加了一个文本注释,并使用figure.annotate()添加了一个指向特定点的箭头。
19. 在Figure上添加自定义绘图
有时,我们可能需要在Figure上添加一些自定义的绘图元素。这可以通过Axes.get_figure()方法实现:
import matplotlib.pyplot as plt
import matplotlib.patches as patches

fig, ax = plt.subplots()
ax.plot([1, 2, 3, 4], [1, 4, 2, 3], label='how2matplotlib.com')

# 获取Figure对象并添加自定义绘图
figure = ax.get_figure()
rect = patches.Rectangle((0.1, 0.1), 0.2, 0.2, fill=False, transform=figure.transFigure)
figure.patches.append(rect)

plt.title('在Figure上添加自定义绘图 - how2matplotlib.com')
plt.tight_layout()
plt.show()
Output:
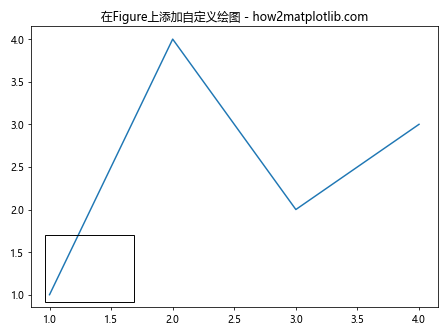
在这个例子中,我们使用get_figure()获取Figure对象,然后创建了一个矩形patch并将其添加到Figure的patches列表中。这个矩形将显示在Figure的左下角。
20. 使用Figure级别的事件处理
最后,我们可以使用Axes.get_figure()方法来设置Figure级别的事件处理:
import matplotlib.pyplot as plt

fig, ax = plt.subplots()
ax.plot([1, 2, 3, 4], [1, 4, 2, 3], label='how2matplotlib.com')

# 获取Figure对象并设置事件处理
figure = ax.get_figure()

def on_click(event):
    if event.button == 1:
        print(f"Clicked at position: ({event.xdata}, {event.ydata})")

figure.canvas.mpl_connect('button_press_event', on_click)

plt.title('使用Figure级别的事件处理 - how2matplotlib.com')
plt.tight_layout()
plt.show()
Output:
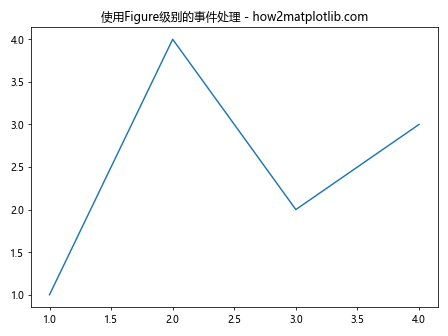
在这个例子中,我们使用get_figure()获取Figure对象,然后使用figure.canvas.mpl_connect()方法设置了一个鼠标点击事件的处理函数。当用户在Figure上点击时,会打印出点击的坐标。
总结
通过以上20个示例,我们详细探讨了Axes.get_figure()方法的各种应用场景。这个方法为我们提供了一种从Axes对象获取Figure对象的便捷方式,使我们能够在Figure级别进行各种操作,如调整大小、添加标题、设置布局、添加注释等。
Axes.get_figure()方法的灵活性使得我们可以在不同的绘图层次之间自如切换,从而创建更复杂、更精细的可视化效果。无论是简单的单图还是复杂的多子图布局,Axes.get_figure()都是一个强大的工具,能够帮助我们更好地控制和定制Matplotlib图形。
在实际应用中,我们可能会根据具体需求组合使用这些技术。例如,我们可能需要在一个复杂的多子图布局中调整Figure大小,添加全局标题,设置统一的颜色映射,并添加Figure级别的图例。通过灵活运用Axes.get_figure()方法,我们可以轻松实现这些复杂的需求,创建出既美观又信息丰富的数据可视化作品。
总之,掌握Axes.get_figure()方法及其相关应用,将极大地提升我们使用Matplotlib进行数据可视化的能力和效率。
 极客教程
极客教程