Matplotlib中使用Artist.set_animated()实现高效动画效果
参考:Matplotlib.artist.Artist.set_animated() in Python
Matplotlib是Python中广泛使用的数据可视化库,它提供了丰富的绘图功能和灵活的自定义选项。在Matplotlib中,Artist是所有可视化元素的基类,包括线条、文本、图像等。本文将深入探讨Matplotlib中的Artist.set_animated()方法,这是一个用于优化动画性能的重要工具。我们将详细介绍其用法、原理和应用场景,并通过多个示例代码来展示如何在实际项目中使用这个方法。
1. Artist.set_animated()方法简介
Artist.set_animated()是Matplotlib中Artist类的一个方法,用于设置某个图形元素是否为动画对象。当一个Artist被设置为动画对象时,Matplotlib会对其进行特殊处理,以提高动画的渲染效率。
1.1 基本语法
import matplotlib.pyplot as plt
import numpy as np

fig, ax = plt.subplots()
line, = ax.plot(np.random.rand(10), label='how2matplotlib.com')
line.set_animated(True)

plt.legend()
plt.show()
Output:
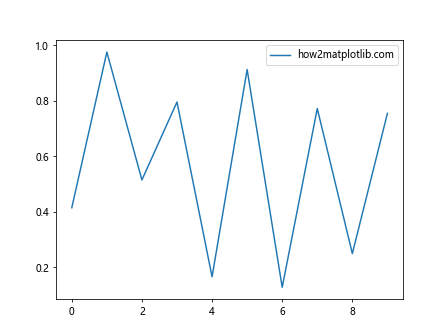
在这个例子中,我们创建了一个简单的折线图,并将线条对象设置为动画对象。set_animated(True)告诉Matplotlib这个线条将在动画中频繁更新。
1.2 工作原理
当一个Artist被设置为动画对象时,Matplotlib会:
- 在初始绘制时跳过这个对象
- 在后续的动画帧中单独绘制这个对象
- 只更新发生变化的部分,而不是重绘整个图形
这种机制可以显著提高动画的性能,特别是在处理复杂图形或高频率更新时。
2. 使用set_animated()优化动画性能
2.1 创建基本动画
让我们从一个简单的动画示例开始,然后逐步优化它:
import matplotlib.pyplot as plt
import matplotlib.animation as animation
import numpy as np

fig, ax = plt.subplots()
x = np.linspace(0, 2*np.pi, 100)
line, = ax.plot(x, np.sin(x))

def animate(frame):
    line.set_ydata(np.sin(x + frame/10))
    return line,

ani = animation.FuncAnimation(fig, animate, frames=200, interval=50, blit=True)
plt.title('Simple Animation - how2matplotlib.com')
plt.show()
Output:
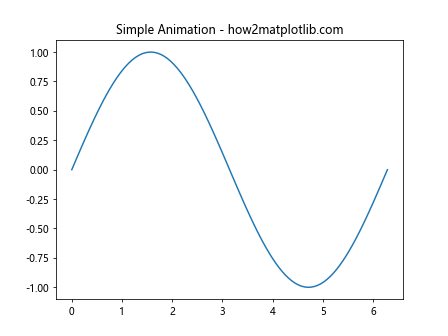
这个例子创建了一个正弦波动画。虽然它已经使用了blit=True来优化性能,但我们还可以进一步改进。
2.2 应用set_animated()
现在,让我们使用set_animated()来优化这个动画:
import matplotlib.pyplot as plt
import matplotlib.animation as animation
import numpy as np

fig, ax = plt.subplots()
x = np.linspace(0, 2*np.pi, 100)
line, = ax.plot(x, np.sin(x))
line.set_animated(True)

def animate(frame):
    line.set_ydata(np.sin(x + frame/10))
    return line,

ani = animation.FuncAnimation(fig, animate, frames=200, interval=50, blit=True)
plt.title('Optimized Animation - how2matplotlib.com')
plt.show()
Output:
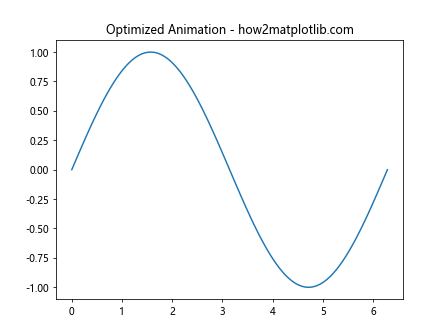
在这个优化版本中,我们添加了line.set_animated(True)。这告诉Matplotlib这条线是动画的一部分,应该被特殊处理以提高性能。
3. set_animated()的高级应用
3.1 多个动画对象
当动画包含多个需要更新的对象时,set_animated()的优势更加明显:
import matplotlib.pyplot as plt
import matplotlib.animation as animation
import numpy as np

fig, ax = plt.subplots()
x = np.linspace(0, 2*np.pi, 100)
line1, = ax.plot(x, np.sin(x), label='Sin')
line2, = ax.plot(x, np.cos(x), label='Cos')

line1.set_animated(True)
line2.set_animated(True)

def animate(frame):
    line1.set_ydata(np.sin(x + frame/10))
    line2.set_ydata(np.cos(x + frame/10))
    return line1, line2

ani = animation.FuncAnimation(fig, animate, frames=200, interval=50, blit=True)
plt.title('Multiple Animated Objects - how2matplotlib.com')
plt.legend()
plt.show()
Output:
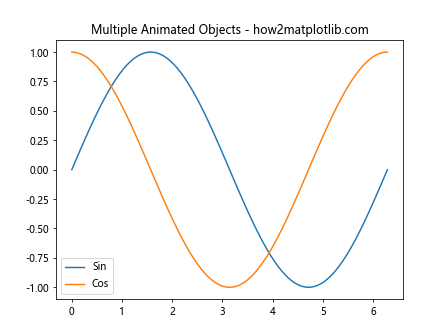
在这个例子中,我们有两条线需要同时更新。通过将它们都设置为动画对象,我们可以确保动画运行得更加流畅。
3.2 动态添加和移除动画对象
set_animated()也可以用于动态控制哪些对象参与动画:
import matplotlib.pyplot as plt
import matplotlib.animation as animation
import numpy as np

fig, ax = plt.subplots()
x = np.linspace(0, 2*np.pi, 100)
line1, = ax.plot(x, np.sin(x), label='Sin')
line2, = ax.plot(x, np.cos(x), label='Cos')

line1.set_animated(True)
line2.set_animated(True)

def animate(frame):
    line1.set_ydata(np.sin(x + frame/10))
    line2.set_ydata(np.cos(x + frame/10))

    if frame % 50 == 0:
        if line2 in ax.lines:
            ax.lines.remove(line2)
            line2.set_animated(False)
        else:
            ax.add_line(line2)
            line2.set_animated(True)

    return line1, line2

ani = animation.FuncAnimation(fig, animate, frames=200, interval=50, blit=True)
plt.title('Dynamic Animation Control - how2matplotlib.com')
plt.legend()
plt.show()
这个例子展示了如何在动画过程中动态添加和移除对象,同时调整它们的动画状态。
4. set_animated()与其他优化技术的结合
4.1 与blitting结合
Blitting是Matplotlib中另一个重要的动画优化技术。它与set_animated()配合使用效果更佳:
import matplotlib.pyplot as plt
import matplotlib.animation as animation
import numpy as np

fig, ax = plt.subplots()
x = np.linspace(0, 2*np.pi, 100)
line, = ax.plot(x, np.sin(x))
line.set_animated(True)

# 创建背景
fig.canvas.draw()
background = fig.canvas.copy_from_bbox(ax.bbox)

def animate(frame):
    # 恢复背景
    fig.canvas.restore_region(background)

    # 更新数据
    line.set_ydata(np.sin(x + frame/10))

    # 重绘动画对象
    ax.draw_artist(line)

    # 更新画布
    fig.canvas.blit(ax.bbox)

ani = animation.FuncAnimation(fig, animate, frames=200, interval=50, blit=False)
plt.title('Blitting with set_animated() - how2matplotlib.com')
plt.show()
Output:
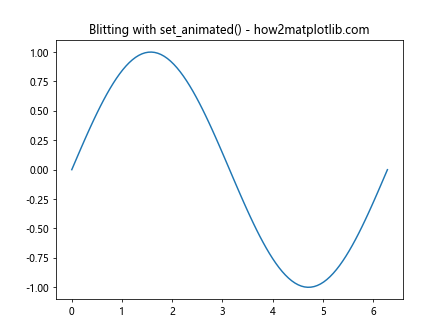
这个例子展示了如何结合使用blitting和set_animated()来创建高效的动画。通过手动管理背景和更新过程,我们可以获得最佳的性能。
4.2 与缓存结合
对于复杂的图形,我们可以使用缓存来进一步优化性能:
import matplotlib.pyplot as plt
import matplotlib.animation as animation
import numpy as np

fig, ax = plt.subplots()
x = np.linspace(0, 2*np.pi, 1000)
line, = ax.plot(x, np.sin(x))
line.set_animated(True)

# 创建缓存
cache = {}

def animate(frame):
    if frame in cache:
        line.set_ydata(cache[frame])
    else:
        new_y = np.sin(x + frame/10)
        cache[frame] = new_y
        line.set_ydata(new_y)
    return line,

ani = animation.FuncAnimation(fig, animate, frames=200, interval=50, blit=True)
plt.title('Caching with set_animated() - how2matplotlib.com')
plt.show()
Output:
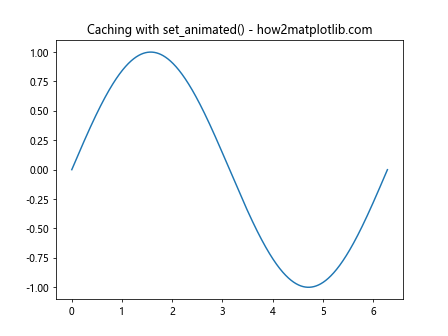
这个例子展示了如何使用缓存来存储预计算的帧,与set_animated()结合使用可以显著提高性能,特别是对于计算密集型的动画。
5. set_animated()的注意事项和最佳实践
5.1 性能考虑
虽然set_animated()可以提高动画性能,但过度使用可能会适得其反:
import matplotlib.pyplot as plt
import matplotlib.animation as animation
import numpy as np

fig, ax = plt.subplots()
lines = [ax.plot(np.random.rand(10))[0] for _ in range(100)]

# 不建议对所有对象都使用set_animated()
for line in lines:
    line.set_animated(True)

def animate(frame):
    for line in lines:
        line.set_ydata(np.random.rand(10))
    return lines

ani = animation.FuncAnimation(fig, animate, frames=100, interval=50, blit=True)
plt.title('Overuse of set_animated() - how2matplotlib.com')
plt.show()
Output:
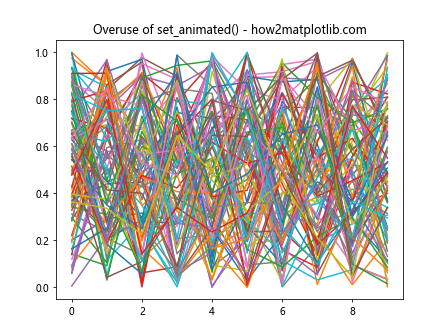
在这个例子中,我们对100条线都使用了set_animated()。虽然这看起来很合理,但实际上可能会导致性能下降,因为Matplotlib需要单独处理每个动画对象。
5.2 选择性使用
更好的做法是只对真正需要频繁更新的对象使用set_animated():
import matplotlib.pyplot as plt
import matplotlib.animation as animation
import numpy as np

fig, ax = plt.subplots()
static_lines = [ax.plot(np.random.rand(10))[0] for _ in range(90)]
animated_lines = [ax.plot(np.random.rand(10))[0] for _ in range(10)]

for line in animated_lines:
    line.set_animated(True)

def animate(frame):
    for line in animated_lines:
        line.set_ydata(np.random.rand(10))
    return animated_lines

ani = animation.FuncAnimation(fig, animate, frames=100, interval=50, blit=True)
plt.title('Selective use of set_animated() - how2matplotlib.com')
plt.show()
Output:
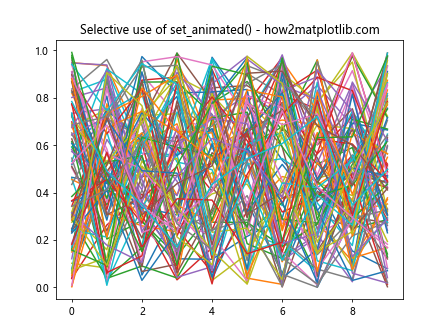
在这个改进的版本中,我们只对10条需要频繁更新的线使用了set_animated(),而将其他90条线保持为静态。这种方法可以在保持良好性能的同时,实现复杂的动画效果。
6. set_animated()在不同类型图表中的应用
6.1 散点图动画
set_animated()不仅适用于线图,也可以用于散点图等其他类型的图表:
import matplotlib.pyplot as plt
import matplotlib.animation as animation
import numpy as np

fig, ax = plt.subplots()
scat = ax.scatter(np.random.rand(100), np.random.rand(100))
scat.set_animated(True)

def animate(frame):
    data = np.random.rand(100, 2)
    scat.set_offsets(data)
    return scat,

ani = animation.FuncAnimation(fig, animate, frames=200, interval=50, blit=True)
plt.title('Animated Scatter Plot - how2matplotlib.com')
plt.show()
Output:
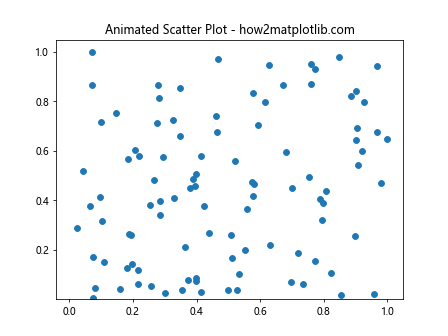
这个例子展示了如何使用set_animated()来创建一个动态的散点图。通过更新散点的位置,我们可以创建出流畅的动画效果。
6.2 柱状图动画
柱状图的动画也可以通过set_animated()来优化:
import matplotlib.pyplot as plt
import matplotlib.animation as animation
import numpy as np

fig, ax = plt.subplots()
x = np.arange(10)
bars = ax.bar(x, np.random.rand(10))

for bar in bars:
    bar.set_animated(True)

def animate(frame):
    heights = np.random.rand(10)
    for bar, h in zip(bars, heights):
        bar.set_height(h)
    return bars

ani = animation.FuncAnimation(fig, animate, frames=200, interval=50, blit=True)
plt.title('Animated Bar Chart - how2matplotlib.com')
plt.show()
Output:
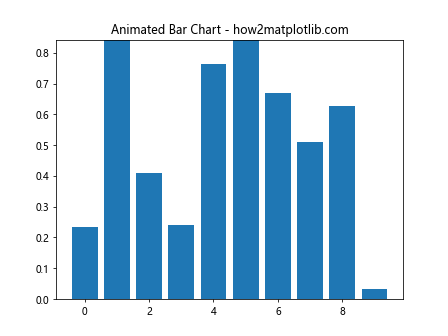
这个例子展示了如何创建一个动态的柱状图。通过设置每个柱子为动画对象,我们可以高效地更新它们的高度。
7. set_animated()在交互式图表中的应用
7.1 结合鼠标事件
set_animated()也可以与交互式功能结合使用:
import matplotlib.pyplot as plt
import numpy as np

fig, ax = plt.subplots()
x = np.linspace(0, 2*np.pi, 100)
line, = ax.plot(x, np.sin(x))
line.set_animated(True)

fig.canvas.draw()
background = fig.canvas.copy_from_bbox(ax.bbox)

def on_move(event):
    if event.inaxes != ax:
        return

    fig.canvas.restore_region(background)

    y = np.sin(x + event.xdata/10)
    line.set_ydata(y)

    ax.draw_artist(line)
    fig.canvas.blit(ax.bbox)

fig.canvas.mpl_connect('motion_notify_event', on_move)
plt.title('Interactive Animation - how2matplotlib.com')
plt.show()
Output:
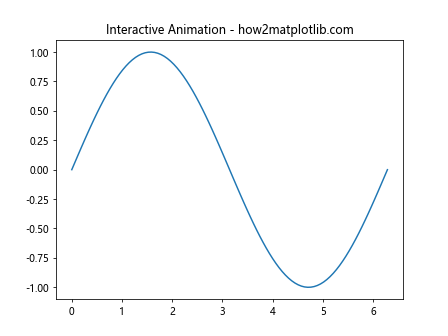
这个例子展示了如何使用set_animated()来创建一个响应鼠标移动的交互式图表。通过结合blitting技术,我们可以实现流畅的实时更新。
7.2 动态添加和删除元素在交互式图表中,我们还可以动态地添加和删除元素,同时使用set_animated()来保持良好的性能:
import matplotlib.pyplot as plt
import numpy as np

fig, ax = plt.subplots()
ax.set_xlim(0, 10)
ax.set_ylim(0, 10)

lines = []

fig.canvas.draw()
background = fig.canvas.copy_from_bbox(ax.bbox)

def on_click(event):
    if event.inaxes != ax:
        return

    x, y = event.xdata, event.ydata
    line, = ax.plot([x], [y], 'ro')
    line.set_animated(True)
    lines.append(line)

    fig.canvas.restore_region(background)
    for line in lines:
        ax.draw_artist(line)
    fig.canvas.blit(ax.bbox)

def on_key(event):
    if event.key == 'c':
        for line in lines:
            line.remove()
        lines.clear()
        fig.canvas.restore_region(background)
        fig.canvas.blit(ax.bbox)

fig.canvas.mpl_connect('button_press_event', on_click)
fig.canvas.mpl_connect('key_press_event', on_key)

plt.title('Dynamic Elements - how2matplotlib.com')
plt.show()
Output:
这个例子允许用户通过点击添加点,并通过按’c’键清除所有点。每个添加的点都被设置为动画对象,以确保高效的更新。
8. set_animated()在复杂动画中的应用
8.1 多层动画
对于包含多个层次的复杂动画,set_animated()可以帮助我们分别管理不同的动画层:
import matplotlib.pyplot as plt
import matplotlib.animation as animation
import numpy as np

fig, ax = plt.subplots()

# 背景层
x = np.linspace(0, 2*np.pi, 100)
background_line, = ax.plot(x, np.sin(x), 'b-', alpha=0.3)

# 动画层
animated_line, = ax.plot([], [], 'r-')
animated_line.set_animated(True)

# 前景层
scatter = ax.scatter([], [], c='g', s=50)
scatter.set_animated(True)

def init():
    animated_line.set_data([], [])
    scatter.set_offsets([])
    return animated_line, scatter

def animate(frame):
    # 更新动画线
    animated_line.set_data(x, np.sin(x + frame/10))

    # 更新散点
    scatter_x = np.random.choice(x, 5)
    scatter_y = np.sin(scatter_x + frame/10)
    scatter.set_offsets(np.column_stack((scatter_x, scatter_y)))

    return animated_line, scatter

ani = animation.FuncAnimation(fig, animate, init_func=init, frames=200, interval=50, blit=True)
plt.title('Multi-layer Animation - how2matplotlib.com')
plt.show()
这个例子展示了如何创建一个包含静态背景、动画线条和动态散点的复杂动画。通过适当使用set_animated(),我们可以确保每一层都得到高效的更新。
8.2 3D动画
set_animated()也可以应用于3D图表,尽管在3D环境中可能需要更多的性能优化:
import matplotlib.pyplot as plt
import matplotlib.animation as animation
import numpy as np
from mpl_toolkits.mplot3d import Axes3D

fig = plt.figure()
ax = fig.add_subplot(111, projection='3d')

# 创建网格
x = np.linspace(-5, 5, 50)
y = np.linspace(-5, 5, 50)
X, Y = np.meshgrid(x, y)

# 初始化曲面
Z = np.sin(np.sqrt(X**2 + Y**2))
surf = ax.plot_surface(X, Y, Z, cmap='viridis')

# 设置动画属性
surf.set_animated(True)

def animate(frame):
    Z = np.sin(np.sqrt(X**2 + Y**2) + frame/10)
    ax.clear()
    surf = ax.plot_surface(X, Y, Z, cmap='viridis')
    ax.set_zlim(-1, 1)
    return surf,

ani = animation.FuncAnimation(fig, animate, frames=200, interval=50, blit=False)
plt.title('3D Animated Surface - how2matplotlib.com')
plt.show()
Output:
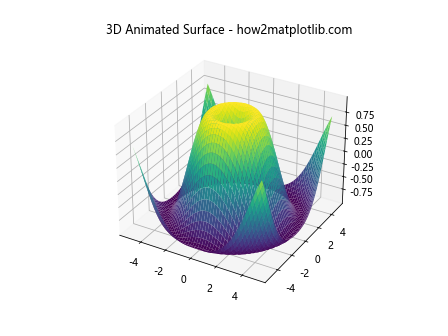
这个例子创建了一个动态的3D曲面图。虽然3D动画通常比2D动画更加复杂,但set_animated()仍然可以帮助提高性能。
9. set_animated()的高级技巧
9.1 动态调整动画状态
在某些情况下,我们可能需要在动画过程中动态调整对象的动画状态:
import matplotlib.pyplot as plt
import matplotlib.animation as animation
import numpy as np

fig, ax = plt.subplots()
x = np.linspace(0, 2*np.pi, 100)
lines = [ax.plot(x, np.sin(x + i/5))[0] for i in range(5)]

for line in lines:
    line.set_animated(True)

def animate(frame):
    for i, line in enumerate(lines):
        if frame % 50 == i * 10:
            line.set_animated(not line.get_animated())
        if line.get_animated():
            line.set_ydata(np.sin(x + (frame + i)/10))
    return lines

ani = animation.FuncAnimation(fig, animate, frames=200, interval=50, blit=True)
plt.title('Dynamic Animation Status - how2matplotlib.com')
plt.show()
Output:
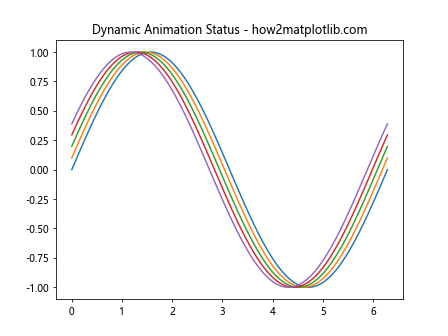
这个例子展示了如何在动画过程中动态改变线条的动画状态。这种技术可以用于创建复杂的动画效果,同时保持良好的性能。
9.2 自定义绘图函数
对于非常特殊的动画需求,我们可以创建自定义的绘图函数,并结合set_animated()使用:
import matplotlib.pyplot as plt
import matplotlib.animation as animation
import numpy as np

class CustomArtist:
    def __init__(self, ax):
        self.ax = ax
        self.points = ax.plot([], [], 'ro')[0]
        self.line = ax.plot([], [], 'b-')[0]
        self.points.set_animated(True)
        self.line.set_animated(True)

    def set_data(self, x, y):
        self.points.set_data(x, y)
        self.line.set_data(x, y)

    def draw(self):
        self.ax.draw_artist(self.points)
        self.ax.draw_artist(self.line)

fig, ax = plt.subplots()
ax.set_xlim(0, 2*np.pi)
ax.set_ylim(-1, 1)

custom_artist = CustomArtist(ax)

fig.canvas.draw()
background = fig.canvas.copy_from_bbox(ax.bbox)

def animate(frame):
    fig.canvas.restore_region(background)

    x = np.linspace(0, 2*np.pi, 20)
    y = np.sin(x + frame/10)
    custom_artist.set_data(x, y)
    custom_artist.draw()

    fig.canvas.blit(ax.bbox)

ani = animation.FuncAnimation(fig, animate, frames=200, interval=50, blit=False)
plt.title('Custom Drawing Function - how2matplotlib.com')
plt.show()
Output:
这个例子创建了一个自定义的Artist类,它包含一组点和一条线。通过自定义绘图函数,我们可以精确控制动画的每个方面,同时利用set_animated()来优化性能。
10. 总结与最佳实践
在本文中,我们深入探讨了Matplotlib中Artist.set_animated()方法的使用。这个方法是创建高效动画的关键工具之一。以下是一些使用set_animated()的最佳实践:
- 只对需要频繁更新的对象使用
set_animated()。 - 结合blitting技术来获得最佳性能。
- 对于复杂的动画,考虑使用缓存来存储预计算的帧。
- 在交互式图表中,结合鼠标和键盘事件使用
set_animated()可以创建流畅的用户体验。 - 对于3D动画,要谨慎使用
set_animated(),因为3D渲染本身就很耗资源。 - 在动画过程中可以动态调整对象的动画状态,以实现复杂的效果。
- 对于特殊需求,可以创建自定义的Artist类和绘图函数,并结合
set_animated()使用。
通过合理使用set_animated(),我们可以显著提高Matplotlib动画的性能,创建出流畅、高效的数据可视化效果。无论是简单的线图动画,还是复杂的交互式3D图表,set_animated()都是一个强大的工具,能够帮助我们充分发挥Matplotlib的潜力。
在实际应用中,建议根据具体需求和性能测试结果来决定是否使用set_animated()以及如何使用。通过不断实践和优化,你将能够创建出既美观又高效的数据可视化动画。
 极客教程
极客教程