Matplotlib中Artist对象的get_gid()方法详解与应用
参考:Matplotlib.artist.Artist.get_gid() in Python
Matplotlib是Python中最流行的数据可视化库之一,它提供了丰富的绘图功能和灵活的自定义选项。在Matplotlib的架构中,Artist对象扮演着重要的角色,它是所有可视化元素的基类。本文将深入探讨Artist对象的get_gid()方法,这是一个用于获取图形元素唯一标识符的重要函数。我们将通过详细的解释和丰富的示例代码,帮助您全面理解get_gid()方法的使用和应用场景。
1. Artist对象简介
在深入了解get_gid()方法之前,我们需要先简要介绍Artist对象。在Matplotlib中,几乎所有可以在图形中看到的元素都是Artist对象的实例。这包括Figure、Axes以及线条、文本、标记等基本绘图元素。
Artist对象可以分为两类:
1. 基本Artist:如Line2D、Rectangle、Text等,用于绘制基本图形元素。
2. 容器Artist:如Figure、Axes、Axis等,用于组织和管理其他Artist对象。
下面是一个简单的示例,展示了如何创建一个基本的Artist对象:
import matplotlib.pyplot as plt
import matplotlib.lines as mlines

fig, ax = plt.subplots()
line = mlines.Line2D([0, 1], [0, 1], lw=2, color='red')
ax.add_line(line)
ax.set_xlim(0, 1)
ax.set_ylim(0, 1)
ax.set_title('How to use Artist in Matplotlib - how2matplotlib.com')
plt.show()
Output:
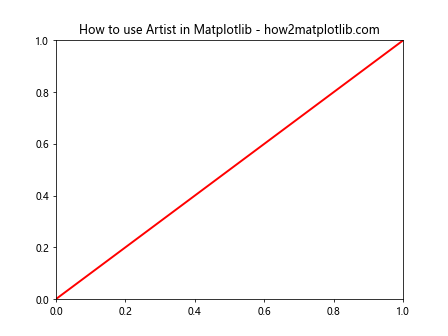
在这个例子中,我们创建了一个Line2D对象,它是一个基本的Artist对象,用于绘制直线。
2. get_gid()方法概述
get_gid()是Artist类的一个方法,用于获取图形元素的组标识符(Group ID)。每个Artist对象都可以被赋予一个唯一的gid,这个gid可以用于后续的元素选择、样式设置或交互操作。
get_gid()方法的基本语法如下:
gid = artist.get_gid()
其中,artist是任何Artist对象的实例。如果该对象有设置gid,get_gid()将返回这个gid字符串;如果没有设置,则返回None。
下面是一个简单的示例,展示了如何使用get_gid()方法:
import matplotlib.pyplot as plt

fig, ax = plt.subplots()
line = ax.plot([0, 1], [0, 1], label='Line 1')[0]
line.set_gid('my_line')

print(f"The gid of the line is: {line.get_gid()}")
ax.set_title('Using get_gid() in Matplotlib - how2matplotlib.com')
plt.show()
Output:
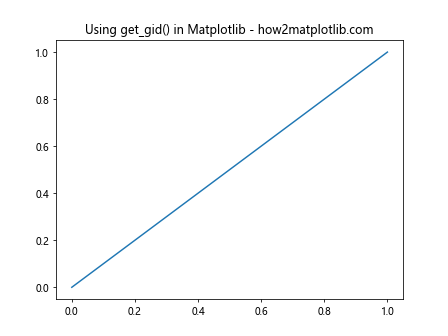
在这个例子中,我们创建了一条线,并为其设置了gid。然后我们使用get_gid()方法获取并打印这个gid。
3. 设置gid
虽然get_gid()方法用于获取gid,但在使用它之前,我们通常需要先设置gid。这可以通过set_gid()方法完成。以下是一个更详细的例子,展示了如何为多个Artist对象设置和获取gid:
import matplotlib.pyplot as plt

fig, ax = plt.subplots()

# 创建并设置多个Artist对象的gid
line1 = ax.plot([0, 1], [0, 1], 'r-', label='Line 1')[0]
line1.set_gid('red_line')

line2 = ax.plot([0, 1], [1, 0], 'b--', label='Line 2')[0]
line2.set_gid('blue_line')

text = ax.text(0.5, 0.5, 'Center Text', ha='center', va='center')
text.set_gid('center_text')

# 获取并打印各个对象的gid
print(f"Line 1 gid: {line1.get_gid()}")
print(f"Line 2 gid: {line2.get_gid()}")
print(f"Text gid: {text.get_gid()}")

ax.set_title('Setting and Getting gids - how2matplotlib.com')
ax.legend()
plt.show()
Output:
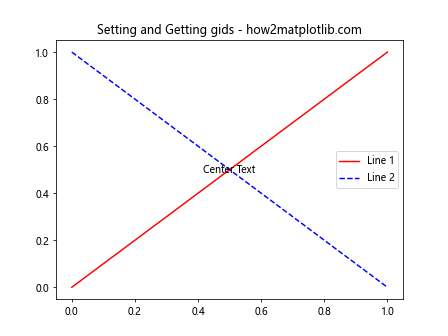
在这个例子中,我们为两条线和一个文本对象设置了不同的gid,然后使用get_gid()方法获取并打印这些gid。
4. gid的应用场景
gid的设置和获取在很多场景下都非常有用。以下是一些常见的应用场景:
4.1 元素选择和样式修改
通过gid,我们可以方便地选择特定的图形元素并修改其样式。例如:
import matplotlib.pyplot as plt

fig, ax = plt.subplots()

# 创建多个线条并设置gid
for i in range(5):
    line = ax.plot([0, 1], [i, i], label=f'Line {i+1}')[0]
    line.set_gid(f'line_{i+1}')

# 通过gid选择特定线条并修改样式
for artist in ax.get_children():
    if isinstance(artist, plt.Line2D) and artist.get_gid() == 'line_3':
        artist.set_color('red')
        artist.set_linewidth(3)

ax.set_title('Selecting and Modifying Elements by gid - how2matplotlib.com')
ax.legend()
plt.show()
Output:
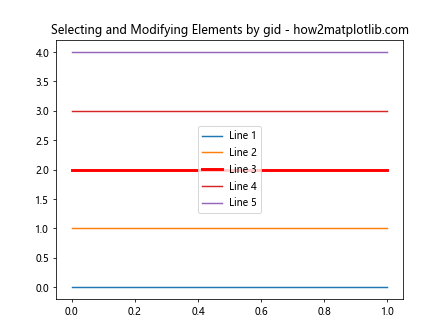
在这个例子中,我们创建了5条线,并为每条线设置了唯一的gid。然后,我们通过检查gid来选择特定的线条(这里是’line_3’),并修改其颜色和线宽。
4.2 交互式操作
gid在创建交互式图表时也非常有用。我们可以使用gid来识别用户点击或悬停的特定元素。以下是一个简单的示例:
import matplotlib.pyplot as plt

fig, ax = plt.subplots()

# 创建多个点并设置gid
for i in range(5):
    point = ax.plot(i, i, 'o', markersize=10)[0]
    point.set_gid(f'point_{i+1}')

def on_pick(event):
    artist = event.artist
    if artist.get_gid():
        print(f"Clicked on {artist.get_gid()}")

fig.canvas.mpl_connect('pick_event', on_pick)

ax.set_title('Interactive Plot with gid - how2matplotlib.com')
plt.show()
Output:
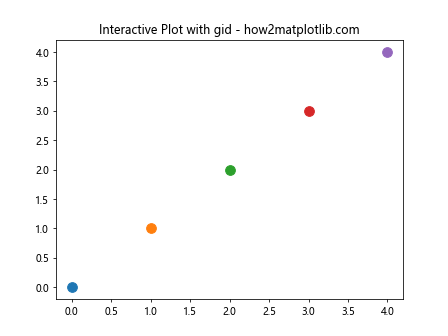
在这个例子中,我们创建了5个点,并为每个点设置了唯一的gid。然后我们定义了一个on_pick函数,当用户点击某个点时,会打印出该点的gid。
4.3 动画制作
在创建动画时,gid可以帮助我们跟踪和更新特定的图形元素。下面是一个简单的动画示例:
import matplotlib.pyplot as plt
import matplotlib.animation as animation
import numpy as np

fig, ax = plt.subplots()

# 创建多个线条并设置gid
lines = []
for i in range(3):
    line, = ax.plot([], [], label=f'Line {i+1}')
    line.set_gid(f'line_{i+1}')
    lines.append(line)

ax.set_xlim(0, 2*np.pi)
ax.set_ylim(-1, 1)

def animate(frame):
    for line in lines:
        if line.get_gid() == 'line_1':
            line.set_data(np.linspace(0, 2*np.pi, 100), np.sin(2 * np.pi * (frame/100 + np.linspace(0, 1, 100))))
        elif line.get_gid() == 'line_2':
            line.set_data(np.linspace(0, 2*np.pi, 100), np.cos(2 * np.pi * (frame/100 + np.linspace(0, 1, 100))))
        elif line.get_gid() == 'line_3':
            line.set_data(np.linspace(0, 2*np.pi, 100), 0.5 * np.sin(4 * np.pi * (frame/100 + np.linspace(0, 1, 100))))
    return lines

ani = animation.FuncAnimation(fig, animate, frames=100, interval=50, blit=True)

ax.set_title('Animation with gid - how2matplotlib.com')
ax.legend()
plt.show()
Output:
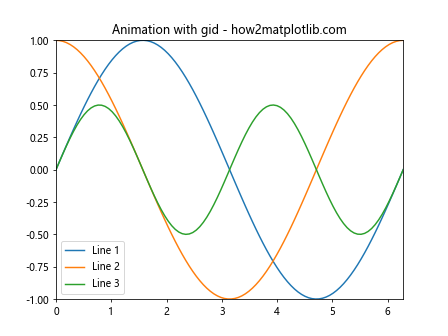
在这个动画中,我们创建了三条线,并为每条线设置了唯一的gid。在animate函数中,我们根据每条线的gid来更新其数据,从而创建不同的动画效果。
5. get_gid()在复杂图表中的应用
在复杂的图表中,get_gid()方法可以帮助我们更好地组织和管理大量的图形元素。以下是一个较为复杂的示例,展示了如何在多子图的情况下使用get_gid():
import matplotlib.pyplot as plt
import numpy as np

fig, axs = plt.subplots(2, 2, figsize=(12, 10))
fig.suptitle('Complex Plot with gid - how2matplotlib.com')

# 子图1:散点图
x1 = np.random.rand(50)
y1 = np.random.rand(50)
scatter = axs[0, 0].scatter(x1, y1, c=np.random.rand(50), s=500*np.random.rand(50))
scatter.set_gid('main_scatter')
axs[0, 0].set_title('Scatter Plot')

# 子图2:柱状图
x2 = ['A', 'B', 'C', 'D', 'E']
y2 = np.random.randint(0, 100, 5)
bars = axs[0, 1].bar(x2, y2)
for i, bar in enumerate(bars):
    bar.set_gid(f'bar_{i+1}')
axs[0, 1].set_title('Bar Plot')

# 子图3:折线图
x3 = np.linspace(0, 10, 100)
y3 = np.sin(x3)
line, = axs[1, 0].plot(x3, y3)
line.set_gid('sine_curve')
axs[1, 0].set_title('Line Plot')

# 子图4:饼图
sizes = [15, 30, 45, 10]
labels = ['A', 'B', 'C', 'D']
explode = (0, 0.1, 0, 0)
wedges, texts, autotexts = axs[1, 1].pie(sizes, explode=explode, labels=labels, autopct='%1.1f%%')
for i, wedge in enumerate(wedges):
    wedge.set_gid(f'pie_slice_{i+1}')
axs[1, 1].set_title('Pie Chart')

# 打印所有设置了gid的元素
for ax in axs.flat:
    for artist in ax.get_children():
        if artist.get_gid():
            print(f"Found artist with gid: {artist.get_gid()} in {ax.get_title()}")

plt.tight_layout()
plt.show()
Output:
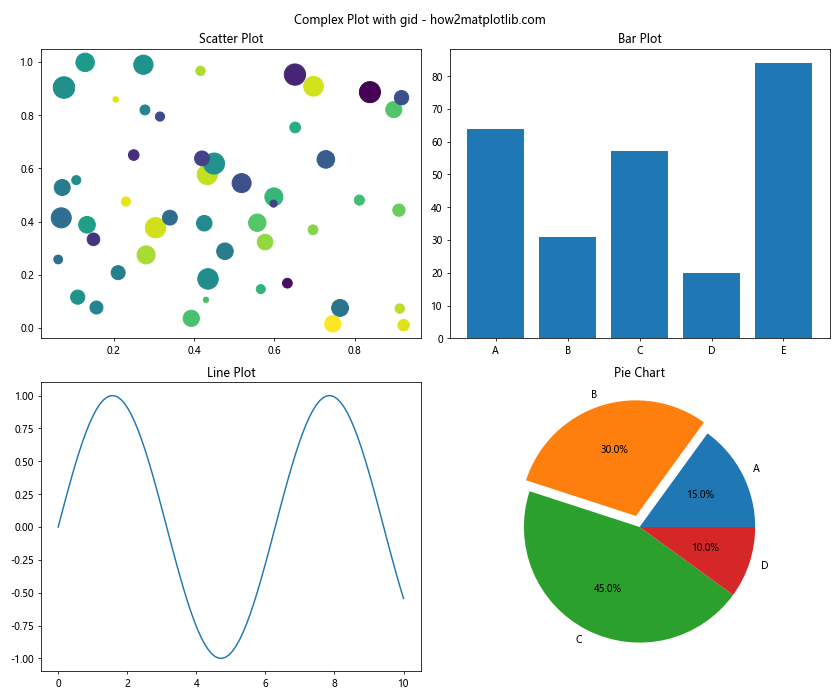
在这个复杂的例子中,我们创建了一个2×2的子图网格,每个子图包含不同类型的图表。我们为每个主要的图形元素设置了唯一的gid,然后遍历所有子图和其中的Artist对象,打印出所有设置了gid的元素。这种方法可以帮助我们在复杂的图表中快速定位和管理特定的图形元素。
6. get_gid()在自定义图例中的应用
get_gid()方法在创建自定义图例时也非常有用。我们可以使用gid来识别特定的图例元素,并根据需要修改它们的属性。以下是一个示例:
import matplotlib.pyplot as plt
import matplotlib.patches as mpatches

fig, ax = plt.subplots()

# 创建一些数据点
ax.scatter([1, 2, 3], [1, 2, 3], c='red', label='Red points')
ax.scatter([1, 2, 3], [2, 3, 4], c='blue', label='Blue points')

# 创建自定义图例
red_patch = mpatches.Patch(color='red', label='Custom Red')
blue_patch = mpatches.Patch(color='blue', label='Custom Blue')

red_patch.set_gid('red_legend')
blue_patch.set_gid('blue_legend')

legend = ax.legend(handles=[red_patch, blue_patch], loc='upper left')

# 修改特定图例元素的属性
for legend_handle in legend.legendHandles:
    if legend_handle.get_gid() == 'red_legend':
        legend_handle.set_alpha(0.5)
    elif legend_handle.get_gid() == 'blue_legend':
        legend_handle.set_hatch('/')

ax.set_title('Custom Legend with gid - how2matplotlib.com')
plt.show()
Output:
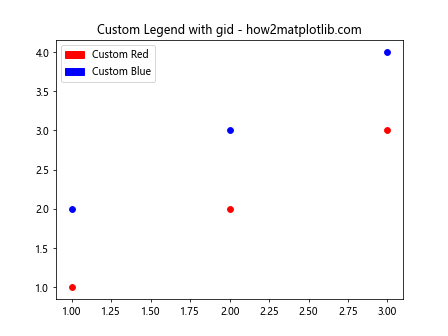
在这个例子中,我们创建了两组散点,然后使用mpatches.Patch创建了自定义的图例元素。我们为这些图例元素设置了唯一的gid,然后通过检查gid来修改特定图例元素的属性(如透明度和填充样式)。
7. get_gid()在保存和加载图形中的应用
get_gid()方法还可以在保存和加载图形时派上用场。虽然Matplotlib本身不直接支持通过gid保存和加载图形元素的状态,但我们可以创建自己的保存和加载机制。以下是一个示例:
import matplotlib.pyplot as plt
import json

def save_figure_state(fig, filename):
    state = {}
    for ax in fig.axes:
        for artist in ax.get_children():
            if artist.get_gid():
                state[artist.get_gid()] = {
                    'visible': artist.get_visible(),
                    'alpha': artist.get_alpha(),
                    'zorder': artist.get_zorder()
                }

    with open(filename, 'w') as f:
        json.dump(state, f)

def load_figure_state(fig, filename):
    with open(filename, 'r') as f:
        state = json.load(f)

    for ax in fig.axes:
        for artist in ax.get_children():
            if artist.get_gid() in state:
                artist_state = state[artist.get_gid()]
                artist.set_visible(artist_state['visible'])
                artist.set_alpha(artist_state['alpha'])
                artist.set_zorder(artist_state['zorder'])

# 创建一个示例图形
fig, ax = plt.subplots()

line1 = ax.plot([0, 1], [0, 1], 'r-', label='Line 1')[0]
line1.set_gid('line_1')

line2 = ax.plot([0, 1], [1, 0], 'b--', label='Line 2')[0]
line2.set_gid('line_2')

ax.set_title('Saving and Loading Figure State - how2matplotlib.com')
ax.legend()

# 保存图形状态
save_figure_state(fig, 'figure_state.json')

# 修改图形状态
line1.set_visible(False)
line2.set_alpha(0.5)

plt.show()

# 加载之前保存的状态
load_figure_state(fig, 'figure_state.json')

plt.show()
在这个例子中,我们定义了两个函数:save_figure_state()和load_figure_state()。save_figure_state()函数遍历图形中所有设置了gid的Artist对象,并将它们的一些属性(如可见性、透明度和z顺序)保存到一个JSON文件中。load_figure_state()函数则从JSON文件中读取这些属性,并将它们应用到相应的Artist对象上。
这种方法允许我们保存图形的特定状态,并在需要时恢复它,这在创建交互式应用程序或需要保存和恢复复杂图形配置时非常有用。
8. get_gid()在动态更新图形中的应用
get_gid()方法在需要动态更新图形的场景中也非常有用。例如,在实时数据可视化或交互式应用程序中,我们可能需要频繁地更新特定图形元素的属性。以下是一个示例,展示了如何使用get_gid()来实现动态更新:
import matplotlib.pyplot as plt
import numpy as np
from matplotlib.animation import FuncAnimation

fig, ax = plt.subplots()

# 创建初始数据
x = np.linspace(0, 2*np.pi, 100)
y1 = np.sin(x)
y2 = np.cos(x)

# 创建两条线并设置gid
line1, = ax.plot(x, y1, 'r-', label='Sine')
line1.set_gid('sine_curve')

line2, = ax.plot(x, y2, 'b-', label='Cosine')
line2.set_gid('cosine_curve')

ax.set_xlim(0, 2*np.pi)
ax.set_ylim(-1.5, 1.5)
ax.legend()

def update(frame):
    for artist in ax.get_children():
        if isinstance(artist, plt.Line2D):
            if artist.get_gid() == 'sine_curve':
                artist.set_ydata(np.sin(x + frame/10))
            elif artist.get_gid() == 'cosine_curve':
                artist.set_ydata(np.cos(x + frame/10))
    ax.set_title(f'Frame {frame} - how2matplotlib.com')
    return ax.get_children()

ani = FuncAnimation(fig, update, frames=100, interval=50, blit=True)

plt.show()
Output:
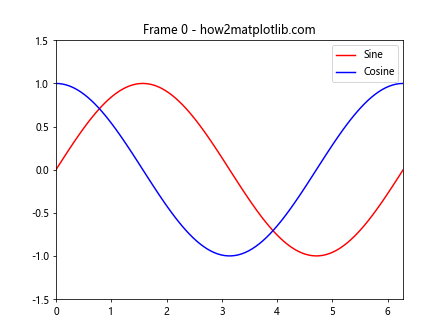
在这个例子中,我们创建了两条线(正弦曲线和余弦曲线),并为它们设置了唯一的gid。在update函数中,我们通过检查每个Line2D对象的gid来确定应该更新哪条线的数据。这种方法使得我们可以轻松地在复杂的动画中管理和更新特定的图形元素。
9. get_gid()在自定义交互工具中的应用
get_gid()方法在创建自定义交互工具时也非常有用。例如,我们可以创建一个工具,允许用户通过点击来切换特定图形元素的可见性。以下是一个示例:
import matplotlib.pyplot as plt
from matplotlib.widgets import Button

fig, ax = plt.subplots()

# 创建多个线条并设置gid
lines = []
for i in range(3):
    line, = ax.plot(range(10), [i*x for x in range(10)], label=f'Line {i+1}')
    line.set_gid(f'line_{i+1}')
    lines.append(line)

ax.legend()

# 创建按钮来切换线条可见性
button_axes = []
buttons = []
for i in range(3):
    button_ax = plt.axes([0.7, 0.9 - i*0.1, 0.1, 0.075])
    button = Button(button_ax, f'Toggle Line {i+1}')
    button_axes.append(button_ax)
    buttons.append(button)

def toggle_line(event):
    for line in lines:
        if line.get_gid() == f'line_{event.inaxes.get_label()}':
            line.set_visible(not line.get_visible())
            fig.canvas.draw()

for button in buttons:
    button.on_clicked(toggle_line)

ax.set_title('Interactive Line Toggling - how2matplotlib.com')
plt.show()
Output:
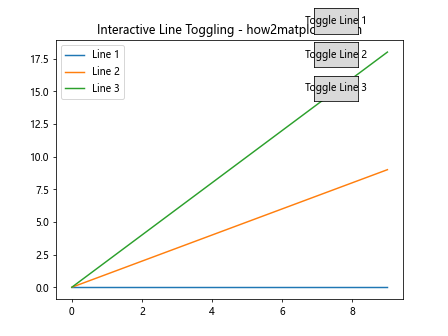
在这个例子中,我们创建了三条线,每条线都有一个唯一的gid。我们还创建了三个按钮,每个按钮对应一条线。当用户点击按钮时,toggle_line函数会被调用。这个函数通过检查线条的gid来确定应该切换哪条线的可见性。
10. get_gid()在图形元素分组中的应用
get_gid()方法还可以用于对图形元素进行分组和批量操作。我们可以为相关的图形元素设置相同的gid前缀,然后通过检查gid来对这些元素进行批量操作。以下是一个示例:
import matplotlib.pyplot as plt
import numpy as np

fig, ax = plt.subplots()

# 创建多组数据点
for i in range(3):
    x = np.random.rand(20)
    y = np.random.rand(20)
    color = ['r', 'g', 'b'][i]
    scatter = ax.scatter(x, y, c=color, label=f'Group {i+1}')
    for j, point in enumerate(scatter.get_offsets()):
        ax.annotate(f'P{j}', point, xytext=(5, 5), textcoords='offset points')
        scatter.get_paths()[j].set_gid(f'group_{i+1}_point')

ax.legend()

def highlight_group(group_number):
    for artist in ax.get_children():
        if isinstance(artist, plt.PathCollection):
            for path in artist.get_paths():
                if path.get_gid().startswith(f'group_{group_number}'):
                    path.set_edgecolor('yellow')
                    path.set_linewidth(2)
                else:
                    path.set_edgecolor('none')
                    path.set_linewidth(0)
    fig.canvas.draw()

# 创建按钮来高亮不同的组
button_axes = []
buttons = []
for i in range(3):
    button_ax = plt.axes([0.7, 0.9 - i*0.1, 0.2, 0.075])
    button = plt.Button(button_ax, f'Highlight Group {i+1}')
    button.on_clicked(lambda event, n=i+1: highlight_group(n))
    button_axes.append(button_ax)
    buttons.append(button)

ax.set_title('Group Operations with gid - how2matplotlib.com')
plt.show()
在这个例子中,我们创建了三组散点,每组散点的每个点都被赋予了一个包含组号的gid。我们还创建了三个按钮,每个按钮对应一个组。当用户点击按钮时,highlight_group函数会被调用,该函数通过检查点的gid来确定应该高亮显示哪一组的点。
结论
通过以上详细的介绍和丰富的示例,我们可以看到Matplotlib中Artist对象的get_gid()方法是一个非常强大和灵活的工具。它不仅可以用于简单的元素识别,还可以在复杂的图表管理、动态更新、交互式操作、自定义工具创建等多个方面发挥重要作用。
get_gid()方法的主要优势在于它提供了一种简单而有效的方式来为图形元素添加元数据,这些元数据可以在后续的操作中被方便地访问和使用。无论是在创建复杂的可视化、实现交互式功能,还是在管理大型项目中的图形元素,get_gid()方法都能提供有力的支持。
然而,需要注意的是,过度使用gid可能会导致代码复杂性增加。因此,在实际应用中,我们应该根据具体需求合理使用gid,在灵活性和代码可读性之间找到平衡。
总的来说,掌握get_gid()方法及其相关应用,将极大地提升您使用Matplotlib创建高质量、交互式数据可视化的能力。希望本文的详细讲解和丰富示例能够帮助您更好地理解和应用这一强大的工具。
 极客教程
极客教程