Matplotlib注释文本
Matplotlib是一个用于绘制二维图形的Python库,提供了丰富的绘图功能,包括在图形中添加注释文本。在数据可视化中,添加注释文本可以帮助观众更好地理解图表中的信息。本文将详细介绍如何在Matplotlib中添加注释文本。
基本用法
在Matplotlib中,可以使用annotate()函数来添加注释文本。该函数的基本用法如下:
import matplotlib.pyplot as plt

plt.figure()
plt.plot([1, 2, 3, 4], [1, 4, 9, 16])

plt.annotate('Example Annotation', xy=(2, 8), xytext=(3, 12),
             arrowprops=dict(facecolor='black', shrink=0.05))

plt.show()
Output:
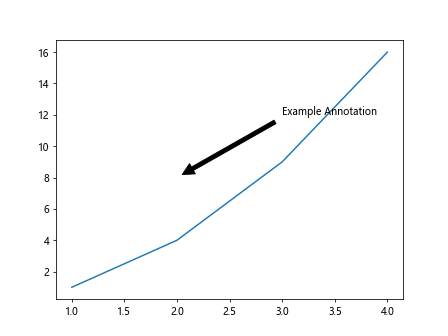
在上面的示例中,我们首先创建了一个简单的折线图,然后使用annotate()函数在图中添加了一个注释文本。xy参数指定了注释的位置,xytext参数指定了文本的位置,arrowprops参数可以设置箭头的样式。
指定注释文本的样式
除了基本的用法外,我们还可以指定注释文本的样式,包括文本的字体、颜色、大小等。以下是一个示例:
import matplotlib.pyplot as plt

plt.figure()
plt.plot([1, 2, 3, 4], [1, 4, 9, 16])

plt.annotate('Bold and Red Annotation', xy=(3, 9), xytext=(2, 12),
             arrowprops=dict(arrowstyle='->', connectionstyle='arc3,rad=0.5'),
             fontsize=12, fontweight='bold', color='red')
plt.show()
Output:
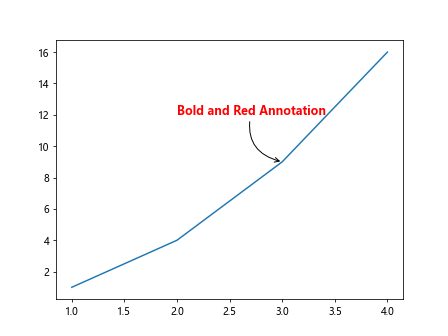
在这个示例中,我们将注释文本设置为红色、粗体,并且字体大小为12。
添加多个注释文本
有时候我们需要在一个图中添加多个注释文本,可以通过多次调用annotate()函数来实现。以下是一个示例:
import matplotlib.pyplot as plt

plt.figure()
plt.plot([1, 2, 3, 4], [1, 4, 9, 16])

plt.annotate('First Annotation', xy=(1, 3), xytext=(2, 5),
             arrowprops=dict(arrowstyle='->'))

plt.annotate('Second Annotation', xy=(2, 8), xytext=(3, 10),
             arrowprops=dict(arrowstyle='->'))
plt.show()
Output:
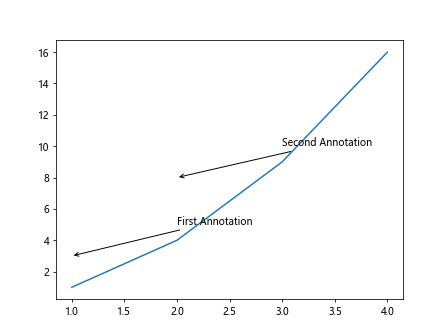
在上面的示例中,我们在图中添加了两个不同位置的注释文本。
自定义箭头样式
Matplotlib提供了多种箭头样式供我们选择,可以通过arrowprops参数进行设置。以下是一个示例:
import matplotlib.pyplot as plt

plt.figure()
plt.plot([1, 2, 3, 4], [1, 4, 9, 16])

plt.annotate('Custom Arrow Style', xy=(2, 7), xytext=(3, 8),
             arrowprops=dict(arrowstyle='fancy',
                             fc='gray', ec='black', lw=2))
plt.show()
Output:
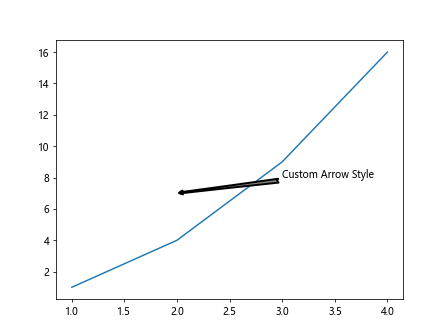
在这个示例中,我们使用了arrowstyle='fancy'来定义箭头样式,并设置了箭头的填充颜色、边框颜色和边框宽度。
添加带有文本框的注释文本
有时候我们需要在注释文本周围添加一个带边框的文本框,以突出显示注释内容。以下是一个示例:
import matplotlib.pyplot as plt

plt.figure()
plt.plot([1, 2, 3, 4], [1, 4, 9, 16])

plt.annotate('Annotation with Text Box', xy=(1.5, 6), xytext=(2, 9),
             bbox=dict(facecolor='yellow', alpha=0.5))
plt.show()
Output:
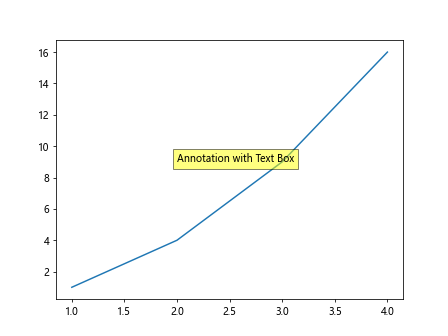
在这个示例中,我们使用bbox参数来定义文本框,设置了文本框的填充颜色和透明度。
添加注释文本到图形的中心位置
有时候我们希望将注释文本添加到图形的中心位置,可以通过matplotlib.text.Annotation对象实现。以下是一个示例:
from matplotlib.text import Annotation
import matplotlib.pyplot as plt

plt.figure()
plt.plot([1, 2, 3, 4], [1, 4, 9, 16])

anno = Annotation('Center Annotation', xy=(0.5, 0.5), xycoords='figure fraction',
                  bbox=dict(boxstyle='round,pad=1', fc='cyan', ec='blue', lw=2))
plt.gca().add_artist(anno)
plt.show()
Output:
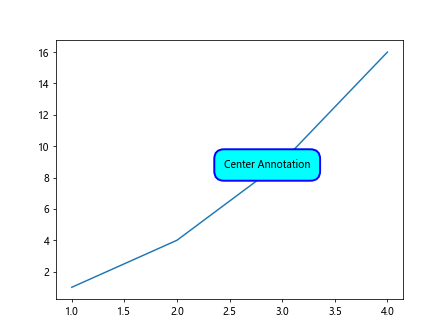
在这个示例中,我们使用Annotation对象将注释文本添加到了图形的中心位置,并设置了文本框的样式和边框。
添加注释文本到轴的特定位置
有时候我们希望将注释文本添加到轴的特定位置,可以通过matplotlib.text.Text对象实现。以下是一个示例:
from matplotlib.text import Text
import matplotlib.pyplot as plt

plt.figure()
plt.plot([1, 2, 3, 4], [1, 4, 9, 16])


text = Text(x=0.5, y=0.5, text='Axes Annotation', color='green', fontsize=12)
plt.gca().add_artist(text)
plt.show()
Output:
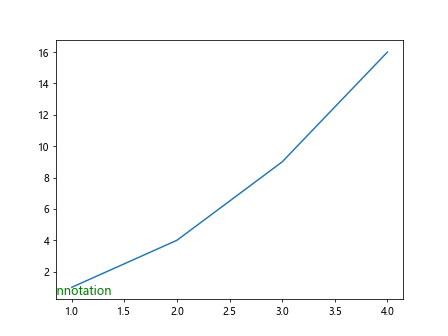
在这个示例中,我们使用Text对象将注释文本添加到了轴的指定位置,并设置了文本的颜色和字体大小。
在图中添加带有箭头和文本的注释框
有时候我们希望在图中添加一个带有箭头和文本的注释框,可以通过matplotlib.offsetbox.AnchoredText对象实现。以下是一个示例:
from matplotlib.offsetbox import AnchoredText
import matplotlib.pyplot as plt

plt.figure()
plt.plot([1, 2, 3, 4], [1, 4, 9, 16])


at = AnchoredText('Anchored Text', loc='upper right', prop=dict(size=12, color='purple'))

plt.gca().add_artist(at)
plt.show()
Output:
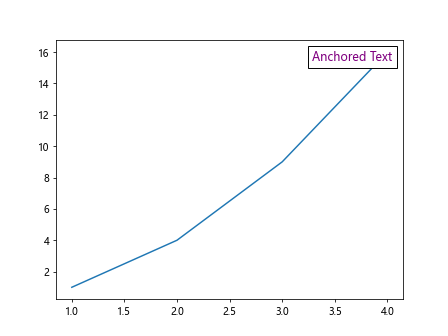
在这个示例中,我们使用AnchoredText对象将注释文本添加到了图中的右上角位置,并设置了文本的大小和颜色。
添加指向鼠标位置的实时注释文本
有时候我们希望在鼠标移动到某个点时,显示一个实时的注释文本,可以通过matplotlib.widgets.Cursor对象实现。以下是一个示例:
import matplotlib.widgets as widgets
import matplotlib.pyplot as plt

plt.figure()
plt.plot([1, 2, 3, 4], [1, 4, 9, 16])


cursor = widgets.Cursor(plt.gca(), horizOn=False, vertOn=False,
                        color='red', linewidth=2, linestyle='dotted')
annot = plt.annotate('', xy=(0, 0), xytext=(0, -20),
                     textcoords='offset points', arrowprops=dict(arrowstyle='->'))

def on_move(event):
    if event.inaxes:
        x, y = event.xdata, event.ydata
        annot.xy = (x, y)
        annot.set_text(f'x={x:.2f}, y={y:.2f}')
        plt.draw()

plt.gcf().canvas.mpl_connect('motion_notify_event', on_move)
plt.show()
Output:
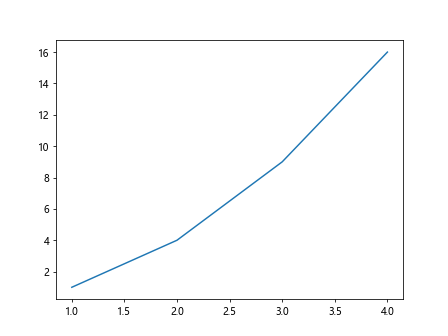
在这个示例中,我们使用Cursor和Annotation对象实现了一个实时的指向鼠标位置的注释文本。
添加自定义箭头到注释文本
有时候我们需要自定义箭头的形状,可以通过matplotlib.patches.Arrow对象实现。以下是一个示例:
import matplotlib.patches as patches
import matplotlib.pyplot as plt

plt.figure()
plt.plot([1, 2, 3, 4], [1, 4, 9, 16])


arrow = patches.Arrow(0.2, 0.2, 0.3, 0.3, width=0.05, color='orange')
plt.gca().add_patch(arrow)

plt.annotate('Custom Arrow', xy=(0.5, 0.5), xytext=(0.7, 0.7),
             arrowprops=dict(arrowstyle='-'), fontsize=12, color='blue')
plt.show()
Output:
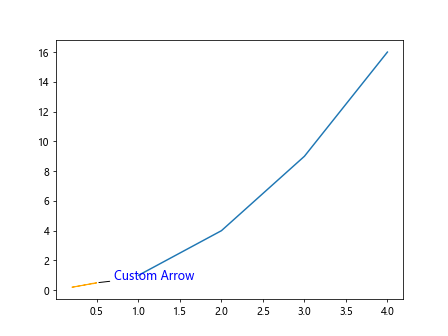
在这个示例中,我们使用Arrow对象创建了一个自定义形状的箭头,并将其添加到了图中。
结论
Matplotlib提供了丰富的注释文本功能,可以帮助我们在图形中添加注释信息,使得图表更加清晰易懂。通过本文的介绍,你可以学会如何在Matplotlib中添加注释文本,并可以根据需要自定义文本的样式、位置和箭头形状。
 极客教程
极客教程