Matplotlib绘制两条水平曲线之间的填充多边形
参考:Make filled polygons between two horizontal curves in Python using Matplotlib
Matplotlib是Python中强大的数据可视化库,它提供了丰富的绘图功能。本文将详细介绍如何使用Matplotlib在两条水平曲线之间创建填充多边形。这种技术在数据分析和科学可视化中非常有用,可以用来展示数据范围、置信区间或者比较不同数据集之间的差异。
1. 基本概念
在开始绘制填充多边形之前,我们需要了解一些基本概念:
- 水平曲线:指在二维平面上沿x轴方向变化的曲线。
- 填充多边形:指在两条曲线之间的区域用颜色或图案填充。
- Matplotlib的fill_between()函数:这是实现填充效果的核心函数。
让我们从一个简单的例子开始:
import matplotlib.pyplot as plt
import numpy as np

x = np.linspace(0, 10, 100)
y1 = np.sin(x)
y2 = np.cos(x)

plt.figure(figsize=(10, 6))
plt.fill_between(x, y1, y2, alpha=0.5, label='how2matplotlib.com')
plt.xlabel('X-axis')
plt.ylabel('Y-axis')
plt.title('Filled Polygon between Sin and Cos Curves')
plt.legend()
plt.show()
Output:
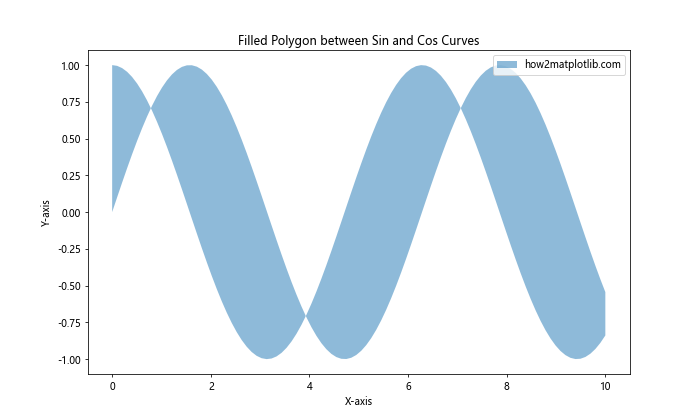
在这个例子中,我们创建了两条曲线(正弦和余弦),然后使用fill_between()函数在它们之间填充颜色。alpha参数控制填充的透明度。
2. 自定义填充样式
Matplotlib提供了多种方式来自定义填充多边形的样式:
2.1 颜色选择
你可以通过color参数来指定填充颜色:
import matplotlib.pyplot as plt
import numpy as np

x = np.linspace(0, 10, 100)
y1 = x**2
y2 = x**2 + 10

plt.figure(figsize=(10, 6))
plt.fill_between(x, y1, y2, color='skyblue', alpha=0.7, label='how2matplotlib.com')
plt.xlabel('X-axis')
plt.ylabel('Y-axis')
plt.title('Custom Color Filled Polygon')
plt.legend()
plt.show()
Output:
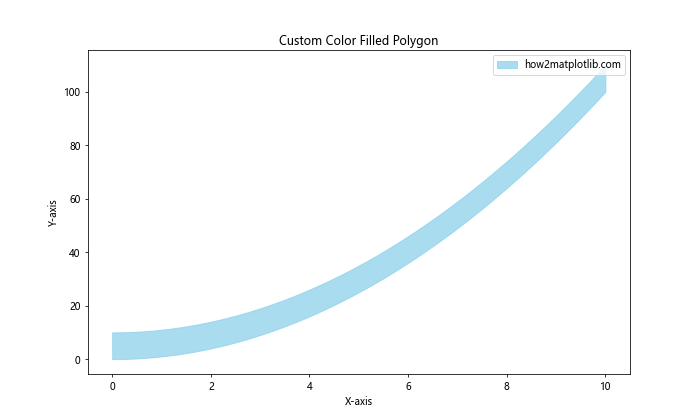
这个例子使用了淡蓝色(skyblue)来填充两条抛物线之间的区域。
2.2 渐变填充
你还可以创建渐变填充效果:
import matplotlib.pyplot as plt
import numpy as np

x = np.linspace(0, 10, 100)
y1 = np.exp(-x/10)
y2 = np.exp(-x/5)

plt.figure(figsize=(10, 6))
plt.fill_between(x, y1, y2, color='purple', alpha=0.1)
plt.fill_between(x, y1, y2, color='purple', alpha=0.2)
plt.fill_between(x, y1, y2, color='purple', alpha=0.3)
plt.xlabel('X-axis')
plt.ylabel('Y-axis')
plt.title('Gradient Filled Polygon - how2matplotlib.com')
plt.show()
Output:
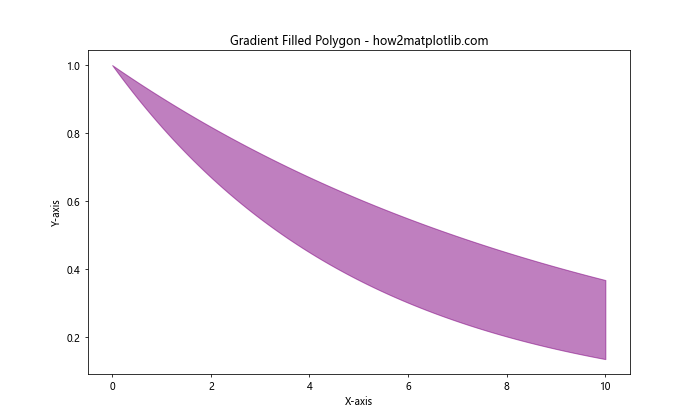
这个例子通过多次调用fill_between()并逐渐增加alpha值来创建渐变效果。
3. 条件填充
Matplotlib允许你根据条件来选择性地填充区域:
import matplotlib.pyplot as plt
import numpy as np

x = np.linspace(0, 10, 100)
y1 = np.sin(x)
y2 = np.sin(x + 0.5)

plt.figure(figsize=(10, 6))
plt.fill_between(x, y1, y2, where=(y1 > y2), color='red', alpha=0.5, label='y1 > y2')
plt.fill_between(x, y1, y2, where=(y1 <= y2), color='green', alpha=0.5, label='y1 <= y2')
plt.plot(x, y1, label='y1')
plt.plot(x, y2, label='y2')
plt.xlabel('X-axis')
plt.ylabel('Y-axis')
plt.title('Conditional Filling - how2matplotlib.com')
plt.legend()
plt.show()
Output:
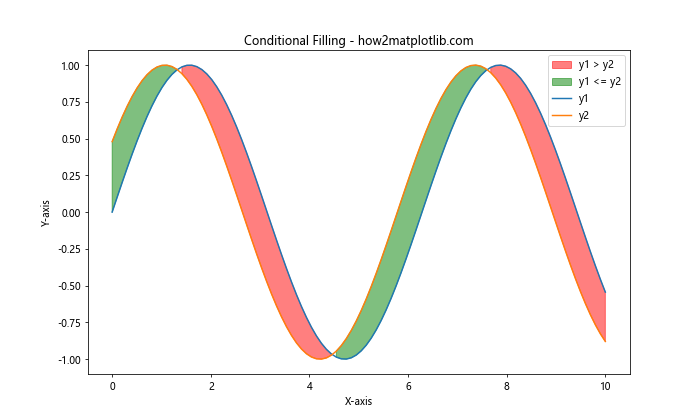
在这个例子中,我们根据y1和y2的相对大小来选择填充颜色。
4. 多重填充
你可以在同一个图表中创建多个填充区域:
import matplotlib.pyplot as plt
import numpy as np

x = np.linspace(0, 10, 100)
y1 = np.sin(x)
y2 = np.sin(2*x)
y3 = np.sin(3*x)

plt.figure(figsize=(10, 6))
plt.fill_between(x, y1, y2, color='yellow', alpha=0.5, label='Between y1 and y2')
plt.fill_between(x, y2, y3, color='green', alpha=0.5, label='Between y2 and y3')
plt.plot(x, y1, label='y1')
plt.plot(x, y2, label='y2')
plt.plot(x, y3, label='y3')
plt.xlabel('X-axis')
plt.ylabel('Y-axis')
plt.title('Multiple Filled Polygons - how2matplotlib.com')
plt.legend()
plt.show()
Output:
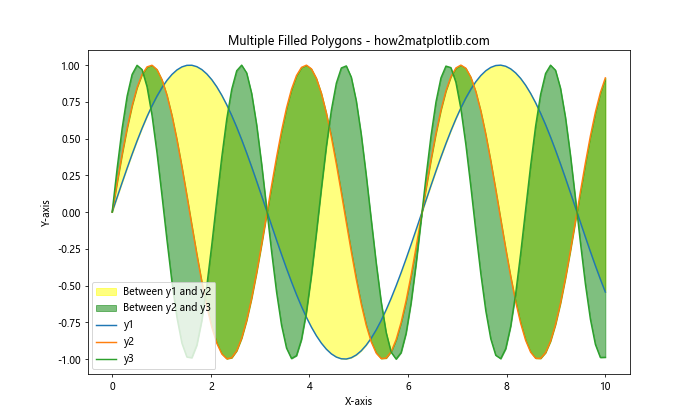
这个例子展示了如何在三条曲线之间创建两个不同的填充区域。
5. 填充到基线
有时你可能只想填充曲线和某个固定值(基线)之间的区域:
import matplotlib.pyplot as plt
import numpy as np

x = np.linspace(0, 10, 100)
y = np.sin(x)

plt.figure(figsize=(10, 6))
plt.fill_between(x, y, 0, where=(y > 0), color='green', alpha=0.5, label='Above baseline')
plt.fill_between(x, y, 0, where=(y <= 0), color='red', alpha=0.5, label='Below baseline')
plt.axhline(y=0, color='black', linestyle='--')
plt.xlabel('X-axis')
plt.ylabel('Y-axis')
plt.title('Filling to Baseline - how2matplotlib.com')
plt.legend()
plt.show()
Output:
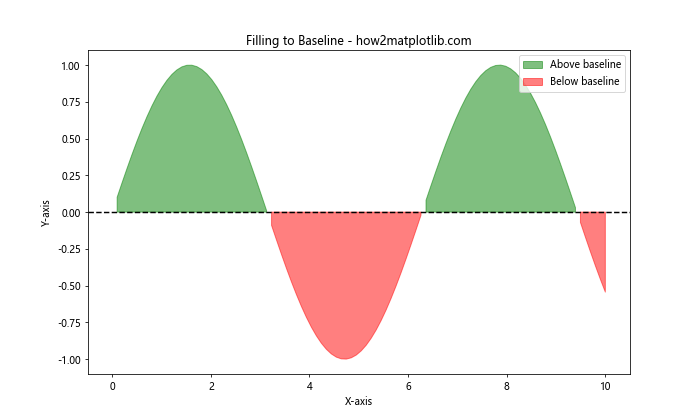
这个例子展示了如何填充正弦曲线和y=0基线之间的区域,并根据曲线是否在基线之上来使用不同的颜色。
6. 使用图案填充
除了纯色填充,Matplotlib还支持使用图案进行填充:
import matplotlib.pyplot as plt
import numpy as np

x = np.linspace(0, 10, 100)
y1 = np.sin(x)
y2 = np.cos(x)

plt.figure(figsize=(10, 6))
plt.fill_between(x, y1, y2, hatch='///', alpha=0.3, label='how2matplotlib.com')
plt.plot(x, y1, label='Sin')
plt.plot(x, y2, label='Cos')
plt.xlabel('X-axis')
plt.ylabel('Y-axis')
plt.title('Pattern Filled Polygon')
plt.legend()
plt.show()
Output:
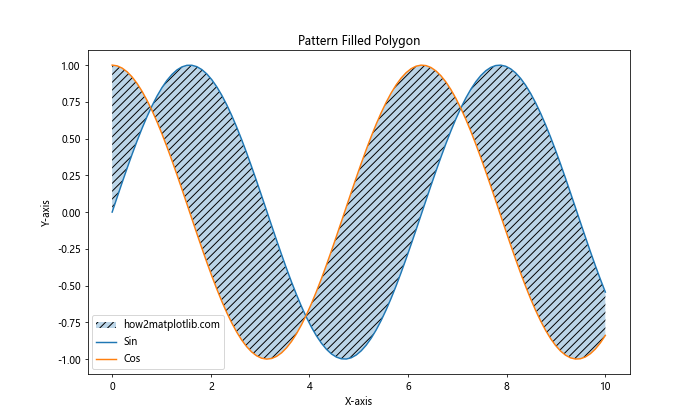
这个例子使用了斜线图案来填充正弦和余弦曲线之间的区域。
7. 填充不连续数据
有时你可能需要处理不连续的数据:
import matplotlib.pyplot as plt
import numpy as np

x = np.array([0, 1, 2, 3, 4, 5])
y1 = np.array([1, 2, np.nan, 2, 1, 2])
y2 = np.array([0, 1, 0, 3, 0, 1])

plt.figure(figsize=(10, 6))
plt.fill_between(x, y1, y2, where=~np.isnan(y1), interpolate=True, alpha=0.5, label='how2matplotlib.com')
plt.plot(x, y1, 'o-', label='y1')
plt.plot(x, y2, 'o-', label='y2')
plt.xlabel('X-axis')
plt.ylabel('Y-axis')
plt.title('Filling with Discontinuous Data')
plt.legend()
plt.show()
Output:
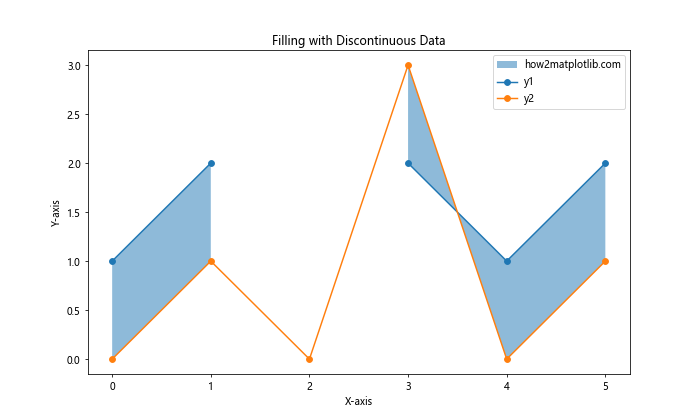
这个例子展示了如何处理包含NaN值的数据,where=~np.isnan(y1)确保只在非NaN值之间进行填充。
8. 3D填充
Matplotlib也支持在3D图表中创建填充多边形:
import matplotlib.pyplot as plt
import numpy as np
from mpl_toolkits.mplot3d import Axes3D

fig = plt.figure(figsize=(10, 6))
ax = fig.add_subplot(111, projection='3d')

x = np.linspace(0, 10, 100)
y = np.sin(x)
z = np.zeros_like(x)

ax.plot(x, y, zs=0, zdir='z')
ax.fill_between(x, y, 0, alpha=0.5, label='how2matplotlib.com')

ax.set_xlabel('X-axis')
ax.set_ylabel('Y-axis')
ax.set_zlabel('Z-axis')
ax.set_title('3D Filled Polygon')
plt.legend()
plt.show()
这个例子展示了如何在3D空间中创建填充多边形。
9. 动态填充
你可以创建动态变化的填充多边形:
import matplotlib.pyplot as plt
import numpy as np
from matplotlib.animation import FuncAnimation

fig, ax = plt.subplots(figsize=(10, 6))
x = np.linspace(0, 2*np.pi, 100)
line, = ax.plot([], [], 'r-', label='Curve')
fill = ax.fill_between([], [], alpha=0.5, label='how2matplotlib.com')

ax.set_xlim(0, 2*np.pi)
ax.set_ylim(-1.5, 1.5)
ax.set_xlabel('X-axis')
ax.set_ylabel('Y-axis')
ax.set_title('Dynamic Filled Polygon')
ax.legend()

def update(frame):
    y = np.sin(x + frame/10)
    line.set_data(x, y)
    fill.remove()
    ax.fill_between(x, y, 0, alpha=0.5, label='how2matplotlib.com')
    return line, fill

ani = FuncAnimation(fig, update, frames=100, blit=True)
plt.show()
Output:
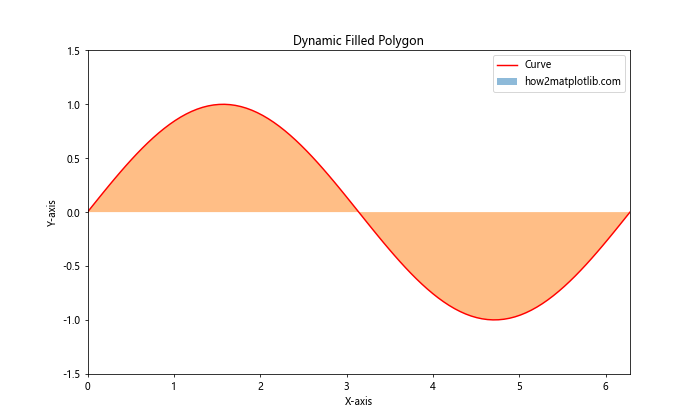
这个例子创建了一个动画,展示了随时间变化的填充多边形。
10. 误差范围可视化
填充多边形常用于可视化数据的误差范围:
import matplotlib.pyplot as plt
import numpy as np

x = np.linspace(0, 10, 50)
y = np.sin(x)
error = 0.2 * np.random.rand(len(x))

plt.figure(figsize=(10, 6))
plt.fill_between(x, y-error, y+error, alpha=0.3, label='Error range')
plt.plot(x, y, 'r-', label='Mean')
plt.xlabel('X-axis')
plt.ylabel('Y-axis')
plt.title('Error Range Visualization - how2matplotlib.com')
plt.legend()
plt.show()
Output:
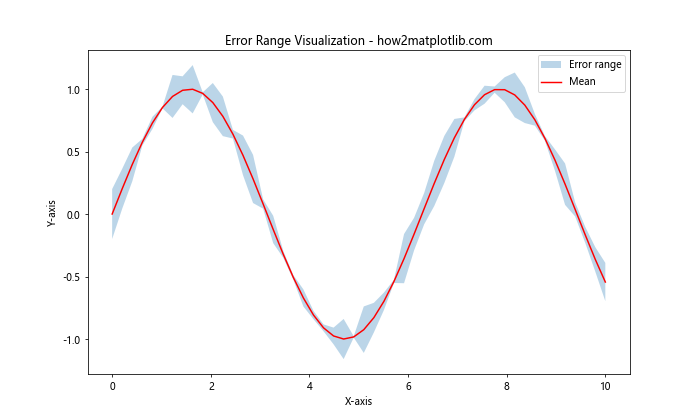
这个例子展示了如何使用填充多边形来可视化数据的误差范围。
11. 堆叠面积图
填充多边形也可以用来创建堆叠面积图:
import matplotlib.pyplot as plt
import numpy as np

x = np.linspace(0, 10, 100)
y1 = np.sin(x)
y2 = np.sin(x) + 0.5
y3 = np.sin(x) + 1

plt.figure(figsize=(10, 6))
plt.fill_between(x, 0, y1, alpha=0.3, label='Layer 1')
plt.fill_between(x, y1, y2, alpha=0.3, label='Layer 2')
plt.fill_between(x, y2, y3, alpha=0.3, label='Layer 3')
plt.xlabel('X-axis')
plt.ylabel('Y-axis')
plt.title('Stacked Area Chart - how2matplotlib.com')
plt.legend()
plt.show()
Output:
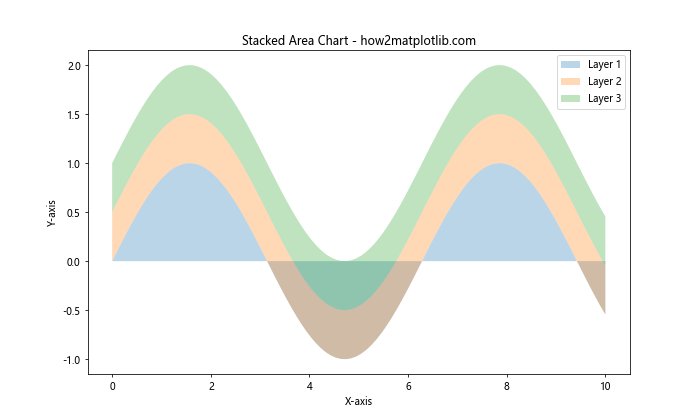
这个例子展示了如何创建一个简单的堆叠面积图。
12. 填充到特定阈值
有时你可能想填充曲线超过某个阈值的部分:
import matplotlib.pyplot as plt
import numpy as np

x = np.linspace(0, 10, 100)
y = np.sin(x)
threshold = 0.5

plt.figure(figsize=(10, 6))
plt.plot(x, y, label='Curve')
plt.axhline(y=threshold, color='r', linestyle='--', label='Threshold')
plt.fill_between(x, y, threshold, where=(y > threshold), alpha=0.3, label='Above threshold')
plt.xlabel('X-axis')
plt.ylabel('Y-axis')
plt.title('Filling Above Threshold - how2matplotlib.com')
plt.legend()
plt.show()
Output:
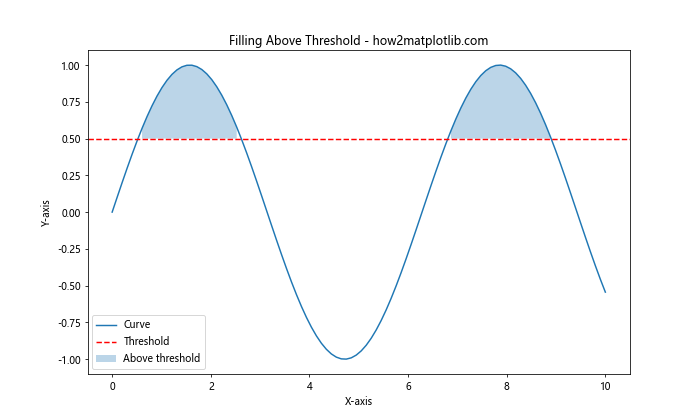
这个例子展示了如何填充曲线超过特定阈值的部分。
13. 使用颜色映射
你可以使用颜色映射来创建更复杂的填充效果:
import matplotlib.pyplot as plt
import numpy as np

x = np.linspace(0, 10, 100)
y1 = np.sin(x)
y2 = np.cos(x)

plt.figure(figsize=(10, 6))
plt.fill_between(x, y1, y2, cmap='viridis', alpha=0.5)
plt.colorbar(label='Color scale')
plt.xlabel('X-axis')
plt.ylabel('Y-axis')
plt.title('Colormap Filled Polygon - how2matplotlib.com')
plt.show()
这个例子使用了’viridis’颜色映射来填充两条曲线之间的区域。
14. 填充极坐标图
Matplotlib也支持在极坐标系中创建填充多边形:
“`python
import matplotlib.pyplot as plt
import numpy as np
theta = np.linspace(0, 2*np.pi, 100)
r1 = 0.5 + np.cos(theta)
r2 = 1 + np.sin(theta)
fig, ax = plt.subplots(subplot_kw=dict(projection='polar'), figsize=(10, 6))
ax.fill_between(theta, r1, r2, alpha=0.5, label='how2matplotlib.com')
ax.set_title('Filled Polygon in Polar Coordinates')
plt.legend()
plt.show()
<pre><code class="line-numbers">这个例子展示了如何在极坐标系中创建填充多边形。
## 15. 多子图中的填充多边形
你可以在一个图形中创建多个子图,每个子图都包含填充多边形:
“`python
import matplotlib.pyplot as plt
import numpy as np
x = np.linspace(0, 10, 100)
y1 = np.sin(x)
y2 = np.cos(x)
fig, (ax1, ax2) = plt.subplots(1, 2, figsize=(15, 6))
ax1.fill_between(x, y1, y2, alpha=0.5, label=’Sin vs Cos’)
ax1.set_title(‘Subplot 1′)
ax1.legend()
ax2.fill_between(x, y1, 0, where=(y1 > 0), alpha=0.5, label=’Positive Sin’)
ax2.fill_between(x, y1, 0, where=(y1 <= 0), alpha=0.5, label=’Negative Sin’)
ax2.set_title(‘Subplot 2’)
ax2.legend()
plt.suptitle(‘Multiple Subplots with Filled Polygons – how2matplotlib.com’)
plt.tight_layout()
plt.show()
这个例子展示了如何在多个子图中创建不同的填充多边形。
16. 填充带有标记的曲线
你可以结合使用线条、标记和填充多边形:
import matplotlib.pyplot as plt
import numpy as np

x = np.linspace(0, 10, 20)
y1 = np.sin(x)
y2 = np.cos(x)

plt.figure(figsize=(10, 6))
plt.fill_between(x, y1, y2, alpha=0.3)
plt.plot(x, y1, 'ro-', label='Sin')
plt.plot(x, y2, 'bo-', label='Cos')
plt.xlabel('X-axis')
plt.ylabel('Y-axis')
plt.title('Filled Polygon with Marked Lines - how2matplotlib.com')
plt.legend()
plt.show()
这个例子展示了如何在填充多边形的基础上添加带有标记的线条。
17. 使用步进填充
你可以创建阶梯状的填充效果:
import matplotlib.pyplot as plt
import numpy as np

x = np.arange(0, 10, 1)
y1 = np.random.rand(10)
y2 = y1 + 0.5

plt.figure(figsize=(10, 6))
plt.fill_between(x, y1, y2, step='pre', alpha=0.3, label='how2matplotlib.com')
plt.step(x, y1, where='pre', label='Lower')
plt.step(x, y2, where='pre', label='Upper')
plt.xlabel('X-axis')
plt.ylabel('Y-axis')
plt.title('Step Filled Polygon')
plt.legend()
plt.show()
这个例子展示了如何创建阶梯状的填充多边形。
18. 填充到移动平均线
你可以使用填充多边形来可视化数据与其移动平均线之间的差异:
import matplotlib.pyplot as plt
import numpy as np
from scipy.ndimage import uniform_filter1d

x = np.linspace(0, 10, 100)
y = np.sin(x) + 0.1 * np.random.randn(100)
y_smooth = uniform_filter1d(y, size=10)

plt.figure(figsize=(10, 6))
plt.plot(x, y, label='Original data')
plt.plot(x, y_smooth, label='Moving average')
plt.fill_between(x, y, y_smooth, alpha=0.3, label='Difference')
plt.xlabel('X-axis')
plt.ylabel('Y-axis')
plt.title('Filling to Moving Average - how2matplotlib.com')
plt.legend()
plt.show()
这个例子展示了如何填充原始数据和其移动平均线之间的区域。
19. 使用插值填充
当数据点稀疏时,你可以使用插值来创建平滑的填充效果:
import matplotlib.pyplot as plt
import numpy as np
from scipy.interpolate import interp1d

x = np.linspace(0, 10, 10)
y1 = np.sin(x)
y2 = np.cos(x)

x_dense = np.linspace(0, 10, 100)
y1_interp = interp1d(x, y1, kind='cubic')(x_dense)
y2_interp = interp1d(x, y2, kind='cubic')(x_dense)

plt.figure(figsize=(10, 6))
plt.fill_between(x_dense, y1_interp, y2_interp, alpha=0.3, label='Interpolated')
plt.plot(x, y1, 'ro', label='Sin data')
plt.plot(x, y2, 'bo', label='Cos data')
plt.xlabel('X-axis')
plt.ylabel('Y-axis')
plt.title('Interpolated Filled Polygon - how2matplotlib.com')
plt.legend()
plt.show()
这个例子展示了如何使用插值来创建平滑的填充效果,即使原始数据点很稀疏。
20. 使用渐变色填充
最后,让我们创建一个使用渐变色的填充多边形:
import matplotlib.pyplot as plt
import numpy as np
from matplotlib.colors import LinearSegmentedColormap

x = np.linspace(0, 10, 100)
y1 = np.sin(x)
y2 = np.cos(x)

colors = ['blue', 'red']
n_bins = 100
cmap = LinearSegmentedColormap.from_list('custom', colors, N=n_bins)

plt.figure(figsize=(10, 6))
for i in range(n_bins):
    plt.fill_between(x, y1, y2, where=(y2-y1 >= i/n_bins) & (y2-y1 < (i+1)/n_bins),
                     color=cmap(i/n_bins), alpha=0.5)
plt.xlabel('X-axis')
plt.ylabel('Y-axis')
plt.title('Gradient Filled Polygon - how2matplotlib.com')
plt.show()
这个例子创建了一个从蓝色到红色的渐变填充效果,颜色变化基于两条曲线之间的距离。
总结
通过以上20个示例,我们详细探讨了如何使用Matplotlib在Python中创建两条水平曲线之间的填充多边形。这些技术涵盖了从基本的填充到高级的动态和渐变填充效果。填充多边形是数据可视化中一个强大的工具,可以用来展示数据范围、比较不同数据集、显示误差范围等。通过调整颜色、透明度、填充条件等参数,你可以创建出丰富多样的视觉效果,使你的数据展示更加生动和有说服力。
记住,在实际应用中,选择合适的填充方式和样式取决于你要传达的信息和目标受众。适当的使用填充多边形可以大大提高数据可视化的效果,使复杂的数据关系更容易理解和解释。
无论你是在进行科学研究、数据分析还是创建报告,掌握这些技术都将使你的Matplotlib图表更加专业和富有洞察力。继续探索和实践,你会发现更多创造性的方式来使用填充多边形,以最佳方式展示你的数据。
 极客教程
极客教程