Matplotlib 线性图
介绍
Matplotlib是一个用于绘制数据可视化图形的Python库,其中的pyplot模块提供了很多用于绘制不同类型图形的函数。在本文中,我们将详细介绍如何使用Matplotlib的pyplot模块绘制线性图(line plot)。
准备工作
在开始之前,首先需要安装Matplotlib库。如果您还没有安装,可以使用以下命令进行安装:
pip install matplotlib
绘制简单的线性图
首先,让我们来绘制一个简单的线性图。假设我们有以下数据:
import matplotlib.pyplot as plt

x = [1, 2, 3, 4, 5]
y = [2, 4, 6, 8, 10]

plt.plot(x, y)
plt.show()
Output:
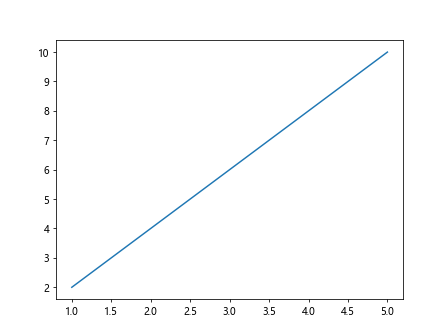
运行以上代码后,您将会看到绘制出了一条简单的直线。
设置线条样式
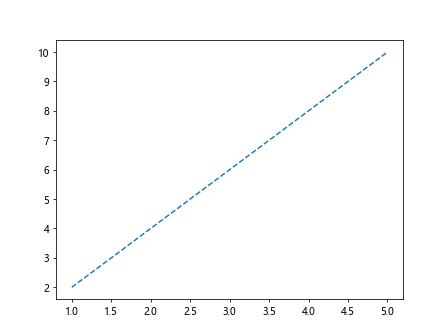
我们可以通过linestyle参数来设置线条的样式。常用的线条样式包括实线('-')、虚线('--')、点线('-.')、点划线(':')等。例如:
import matplotlib.pyplot as plt

x = [1, 2, 3, 4, 5]
y = [2, 4, 6, 8, 10]

plt.plot(x, y, linestyle='--')
plt.show()
Output:
设置线条颜色
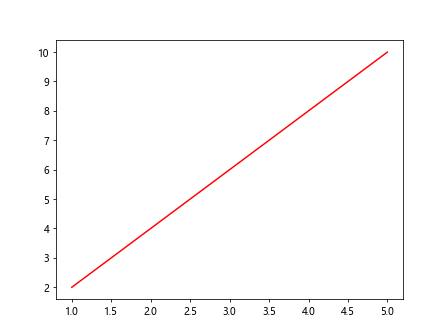
同样,我们也可以通过color参数来设置线条的颜色。常见的颜色包括红色('r')、蓝色('b')、绿色('g')等。例如:
import matplotlib.pyplot as plt

x = [1, 2, 3, 4, 5]
y = [2, 4, 6, 8, 10]

plt.plot(x, y, color='r')
plt.show()
Output:
设置线宽
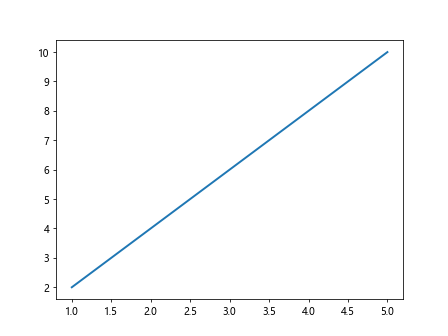
线宽可以通过linewidth参数来设置。例如:
import matplotlib.pyplot as plt

x = [1, 2, 3, 4, 5]
y = [2, 4, 6, 8, 10]

plt.plot(x, y, linewidth=2)
plt.show()
Output:
添加标记点
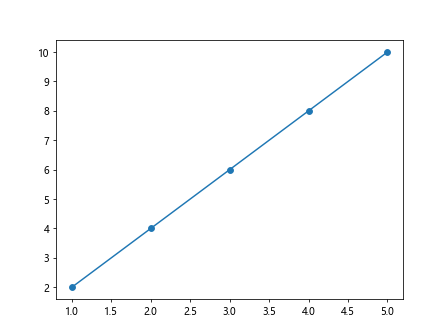
我们可以通过marker参数来添加标记点。常见的标记点包括圆形('o')、方形('s')、三角形('^')、菱形('D')等。例如:
import matplotlib.pyplot as plt

x = [1, 2, 3, 4, 5]
y = [2, 4, 6, 8, 10]

plt.plot(x, y, marker='o')
plt.show()
Output:
设置标记点大小
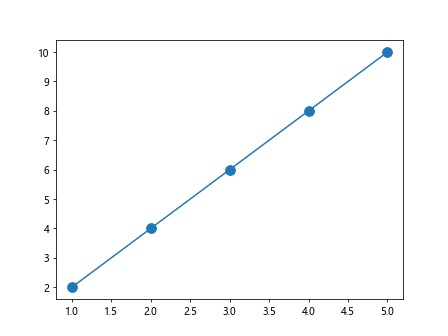
标记点大小可以通过markersize参数来设置。例如:
import matplotlib.pyplot as plt

x = [1, 2, 3, 4, 5]
y = [2, 4, 6, 8, 10]

plt.plot(x, y, marker='o', markersize=10)
plt.show()
Output:
添加标题和标签
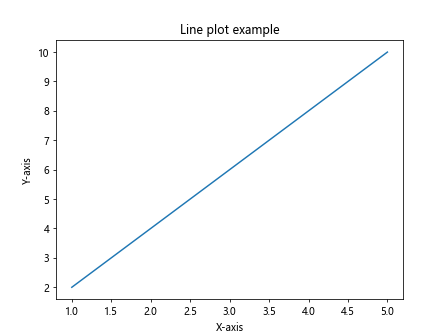
我们可以使用title函数来添加标题,使用xlabel和ylabel函数来添加横轴和纵轴标签。例如:
import matplotlib.pyplot as plt

x = [1, 2, 3, 4, 5]
y = [2, 4, 6, 8, 10]

plt.plot(x, y)
plt.title('Line plot example')
plt.xlabel('X-axis')
plt.ylabel('Y-axis')
plt.show()
Output:
绘制多条线性图
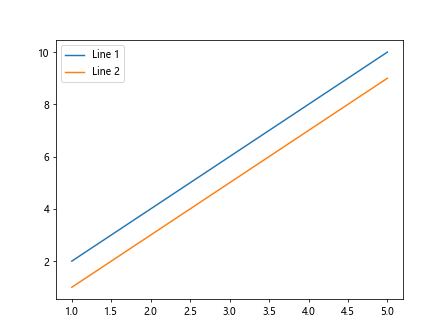
我们也可以同时绘制多条线性图。例如:
import matplotlib.pyplot as plt

x = [1, 2, 3, 4, 5]
y = [2, 4, 6, 8, 10]

y2 = [1, 3, 5, 7, 9]

plt.plot(x, y, label='Line 1')
plt.plot(x, y2, label='Line 2')
plt.legend()
plt.show()
Output:
设置图例位置
图例的位置可以通过loc参数来设置。例如:
import matplotlib.pyplot as plt

x = [1, 2, 3, 4, 5]
y = [2, 4, 6, 8, 10]

plt.plot(x, y, label='Line 1')
plt.plot(x, y2, label='Line 2')
plt.legend(loc='upper right')
plt.show()
自定义线条属性
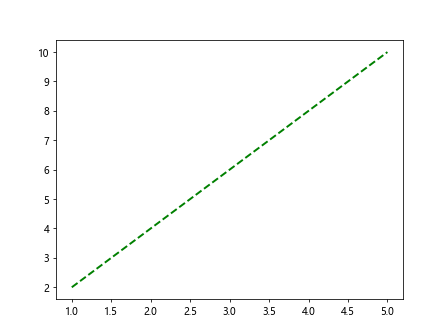
我们可以使用kwargs参数来同时设置线条的样式、颜色、线宽等属性。例如:
import matplotlib.pyplot as plt

x = [1, 2, 3, 4, 5]
y = [2, 4, 6, 8, 10]

plt.plot(x, y, 'g--', linewidth=2)
plt.show()
Output:
添加网格线
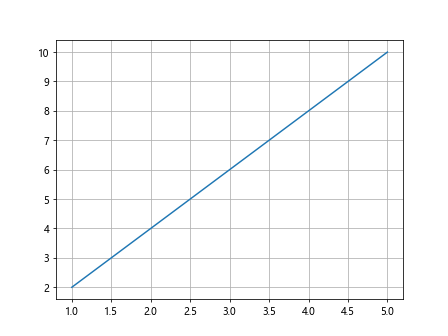
我们可以使用grid函数来添加网格线。例如:
import matplotlib.pyplot as plt

x = [1, 2, 3, 4, 5]
y = [2, 4, 6, 8, 10]

plt.plot(x, y)
plt.grid(True)
plt.show()
Output:
设置坐标轴范围
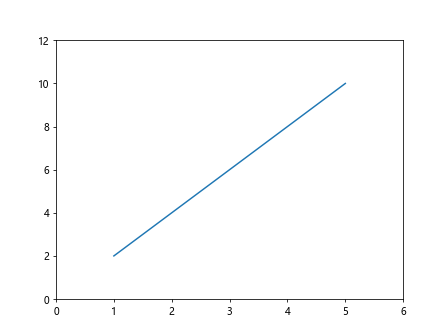
我们可以使用xlim和ylim函数来设置坐标轴的范围。例如:
import matplotlib.pyplot as plt

x = [1, 2, 3, 4, 5]
y = [2, 4, 6, 8, 10]

plt.plot(x, y)
plt.xlim(0, 6)
plt.ylim(0, 12)
plt.show()
Output:
改变坐标轴刻度
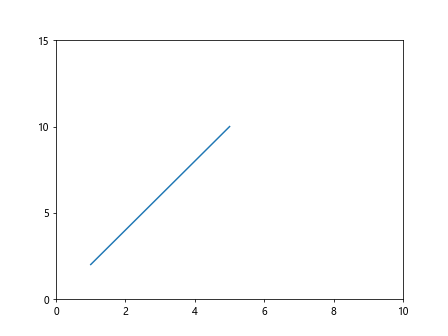
我们可以使用xticks和yticks函数来改变坐标轴的刻度。例如:
import matplotlib.pyplot as plt

x = [1, 2, 3, 4, 5]
y = [2, 4, 6, 8, 10]

plt.plot(x, y)
plt.xticks([0, 2, 4, 6, 8, 10])
plt.yticks([0, 5, 10, 15])
plt.show()
Output:
添加注释
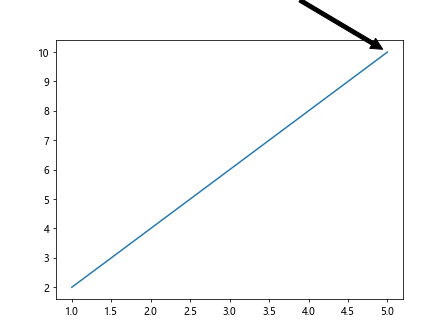
我们可以使用annotate函数来添加注释。例如:
import matplotlib.pyplot as plt

x = [1, 2, 3, 4, 5]
y = [2, 4, 6, 8, 10]

plt.plot(x, y)
plt.annotate('Highest point', xy=(5, 10), xytext=(3, 12),
             arrowprops=dict(facecolor='black', shrink=0.05))
plt.show()
Output:
在同一图中绘制多个子图
我们可以使用subplot函数来在同一图中绘制多个子图。例如:
import matplotlib.pyplot as plt

x = [1, 2, 3, 4, 5]
y = [2, 4, 6, 8, 10]

plt.subplot(2, 1, 1)
plt.plot(x, y)
plt.subplot(2, 1, 2)
plt.plot(x, y2)
plt.show()
设置图形大小和分辨率
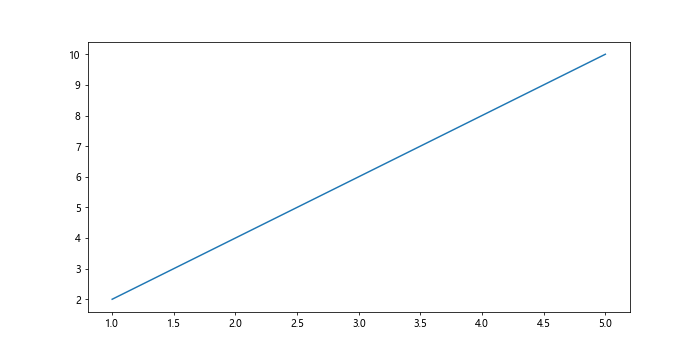
我们可以使用figure函数来设置图形的大小和分辨率。例如:
import matplotlib.pyplot as plt

x = [1, 2, 3, 4, 5]
y = [2, 4, 6, 8, 10]

plt.figure(figsize=(10, 5), dpi=100)
plt.plot(x, y)
plt.show()
Output:
保存图形
我们可以使用savefig函数来保存图形为文件。例如:
import matplotlib.pyplot as plt

x = [1, 2, 3, 4, 5]
y = [2, 4, 6, 8, 10]

plt.plot(x, y)
plt.savefig('line_plot.png')
结论
通过本文的介绍,您现在应该已经掌握了如何使用Matplotlib库的pyplot模块绘制线性图。希望本文对您有所帮助。
 极客教程
极客教程